Quasiparticle Excitations and Charge Transition Levels of Oxygen Vacancies in Hafnia
Abstract
We calculate the quasiparticle defect states and charge transition levels of oxygen vacancies in monoclinic hafnia. The charge transition levels, although they are thermodynamic quantities, can be critically dependent on the band gap owing to localized defect states. These quasiparticle defect level effects are treated using the first principle GW approximation to the self energy. We show that the quality and reliability of the results may be evaluated by calculating the same transition level via two physical paths and that it is important to include the necessary electrostatic corrections in a supercell calculation. Contrary to many previous reports, the oxygen vacancies in monoclinic hafnia are found to be a positive U center, where U is the defect electron addition energy. We identify a physical partitioning of U in terms of an electronic and structural relaxation part.
pacs:
73.40.Qv, 85.30.Tv, 61.72.jdHafnia has recently received much attention because of its many applications, in particular as high-dielectric gate material replacing silica in microelectronic devices. However, devices based on hafnia suffer from several problems such as voltage threshold instabilities Ribes et al. (2005) and flat band voltage shifts Hobbs et al. (2004). These problems are believed to be due to a high density of defects in the material in particular oxygen vacancies are believed to play an important role as electron traps.
There have been several theoretical studies on the structural and electronic properties of oxygen vacancies in monoclinic hafnia. In early studies, formation energies as well as defect levels were calculated within density functional theory (DFT) using the local density approximation Foster et al. (2002) and the generalized gradient approximation (GGA) Zheng et al. (2007); *Kang03. The onsite energy, U, for adding an additional electron to the defect was calculated and the vacancies were found to be negative U Anderson (1975) centers within these approximations. In these studies, however, the defect levels in the gap could not be determined unambiguously, owing to the well-known problem of underestimation of band gaps using Kohn-Sham eigenvalues Hybertsen and Louie (1986). Later studies used hybrid functionals Gavartin et al. (2006); Broqvist and Pasquarello (2006); Xiong et al. (2005) to calculate the defect levels of oxygen vacancies in hafnia. These functionals, which were constructed to fix the band gap underestimation problem, found that the defect was no longer a negative U center Broqvist and Pasquarello (2006). Recently, there has been a higher level theory study Choi and Chang (2009) using a combined DFT and GW approach on these defects. These authors found a negative U behavior for the oxygen vacancy. The GW part of the study in Ref. Choi and Chang (2009) was, however restricted to a 24-atom super cell.
In this letter, we report a new study of the quasiparticle excitations and charge transition levels of oxygen vacancies in monoclinic hafnia. To insure the accuracy of the results, we computed the charge transition levels via two physical paths and took into account an important electrostatic correction that was not included in the previous studies. The defects are found to be positive U centers. Further, we develop a methodology to understand the defect charging energy. We use a combined approach Hedström et al. (2006); *Rinke09 based on DFT and GW formalism Hybertsen and Louie (1986). This formalism corrects for the error incurred in calculating formation energy and charge transition levels within standard DFT. The calculations were done using large super cells with 96 atoms. Such large super cells are necessary to minimize any spurious defect-defect interactions from overlap of the defect state wave functions in neighboring super cells.
The formation energy of a defect in charge state q and at arbitrary ionic coordinates and chemical potential , , can be expressed as
| (1) |
where is the total energy of the system in charge state q and ionic coordinates , and is the energy of a reference system with the same number of atoms as the charged system. We note that is an arbitrary configuration which needs not be the equilibrium configuration of the charge state q which we denote as . Charge transition level, , is defined as the value of the chemical potential at which the charge state of the defect changes from q to q-1 (q/q-1). Conventionally, one defines the charge transition level from the valence band maximum, . It is defined as the chemical potential at which the formation energies of the q and q-1 defects are equal and can be written in terms of formation energies as:
| (2) |
Within standard DFT, charge transition level is determined by calculating each of the formation energies in Eq. 2 in their respective equilibrium configurations as accurately as possible. But, because of the band gap problem and self-interaction terms within standard DFT methods, significant errors may be introduced. However, within the combined DFT and GW formalism, a charge transition level is written as:
| (3) |
by adding and subtracting the term Hedström et al. (2006); *Rinke09. (All the formation energies in the above expression as well as throughout the rest of the letter are evaluated with .) This reformulation allows us to combine terms to eliminate most of the errors mentioned above. Figure 1 shows schematically the procedure for calculation of charge transition levels within the DFT+GW formalism. The first bracketed term on the right hand side of the Eq. 3 is a relaxation energy E (red line in Figure 1) and the second bracketed term is a quasiparticle excitation energy E (blue line in Figure 1). For the excitation energy, one uses the GW formalism Hybertsen and Louie (1986); while for the relaxation energy, one uses DFT. This ensures an accurate calculation of the appropriate physical quantities and hence the charge transition level and relative formation energies.
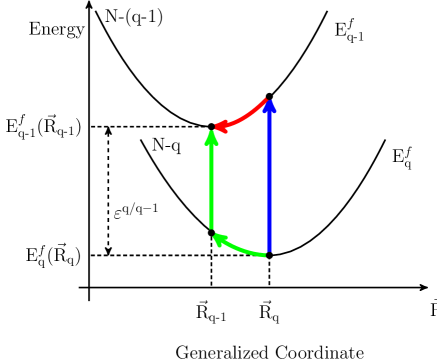
It is worth noting that the charge transition level is a thermodynamic quantity and does not depend on the path in the formation energy-generalized coordinate space one takes to calculate it. In other words, the value of charge transition level remains unaffected when one adds and subtracts any formation energy to it. In particular, we can alternatively choose to add and subtract in Eq. 2. This would correspond to another path (the green line) in Figure 1. Calculating the charge transition level via multiple paths not only serves as a check for our calculations, but also gives some idea about the accuracy of the method.
For the DFT part of our calculation we used an ab initio pseudopotential plane-wave method, as implemented in Quantum ESPRESSO Giannozzi et al. (2009), with PBE Perdew et al. (1996) exchange correlation functional. We used non-local pseudopotentials constructed using the Troullier Martins Troullier and Martins (1991) scheme with valence configurations and for Hf and O, respectively. The electronic wave functions were expanded in plane waves with cutoff energy of 250 Ry. The k-point sampling was restricted to the point in view of the large super cell used. Our calculated lattice parameters for monoclinic hafnia are in excellent agreement with experiment Wang et al. (1992); *Adams91; *Stacy72 as well as with previous calculations Zheng et al. (2007); *Kang03. Using the PBE eigenvalues and eigenfunctions, the quasiparticle energies were calculated within the approximation Hybertsen and Louie (1986) to the electron self- energy as implemented in the BerkeleyGW package ber . The static dielectric matrix was calculated with a 10 Ry energy cutoff in a plane wave basis and extended to finite frequencies within the generalized plasmon pole model Hybertsen and Louie (1986). The band gap for bulk monoclinic hafnia is calculated to be 6.0 eV, which is in good agreement with previous studies 5.45-5.9 Choi and Chang (2009); Jiang et al. (2010); *Gruning10 as well as experiments 5.7-5.9 Sayan et al. (2004); Bersch et al. (2008).
There are two distinct types of oxygen vacancies (with different coordination) in monoclinic hafnia – 3-fold coordinated (V) and 4-fold coordinated (V). We performed calculations for charge states q = 0, 1, 2 for both kind of vacancies, i.e. zero, one and two missing electrons from the vacancy.
| V | V | |||||||
| +2/+1 | +1/0 | +2/+1 | +1/0 | |||||
| P1 | P2 | P1 | P2 | P1 | P2 | P1 | P2 | |
| E | –0.64 | 0.76 | –0.57 | 0.67 | –0.75 | 0.80 | –0.55 | 0.65 |
| E | 3.30 | 1.69 | 3.93 | 2.88 | 3.04 | 1.33 | 3.46 | 2.50 |
| 2.66 | 2.45 | 3.36 | 3.55 | 2.29 | 2.13 | 2.91 | 3.15 | |
| Avg. | 2.56 | 3.46 | 2.21 | 3.03 | ||||
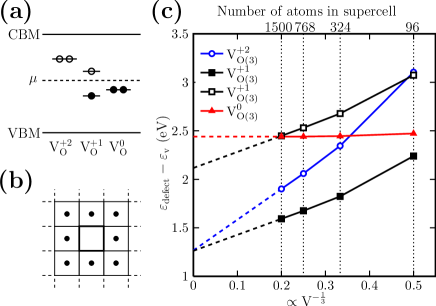
Figure 2 (a) shows a schematic of the oxygen vacancy induced quasiparticle defect levels in the band gap of hafnia. The defect levels for all the charge states lie deep in the gap. Table 1 shows the relaxation energies (E), quasiparticle energies (E) and charge transition levels () calculated within DFT+GW approach. Despite the large differences in the quasiparticle energies required for the calculation in the two paths, the final charge transition levels via the two paths are always within 0.2 eV of one another. This gives us an error estimate of eV for the DFT+GW method for calculation of charge transition levels.
It is worth noting that quasiparticle energies in Table 1 include an electrostatic correction owing to the super cell geometry used. Within the standard DFT-only methodology of calculating charge transition levels, one corrects the total energies of charged defects for unphysical electrostatic terms from the charge on the image defects using Makov-Payne Makov and Payne (1995) like corrections. Within the DFT+GW method, the electrostatic error in the DFT eigenvalues in general needs to be accounted for. The origin of these electrostatic errors in the DFT eigenvalues is the spurious electrostatic potential from charged neighboring defects Lany and Zunger (2010); *Freysoldt09 as shown schematically in Figure 2 (b). To quantify these errors, we plotted the position of the Kohn-Sham defect level with respect to the valence band maximum for various super cell sizes as shown in Figure 2 (c). These calculations were done using the SIESTA code Ordejón et al. (1996); *soler02siesta with increasing super cell sizes - the largest of which contained 1499 atoms + defect. To get the infinite cell size value, we linearly extrapolated from the largest two super cell sizes. Figure 2 (c) shows that even at 1500 atoms, the errors are large with respect to the converged answer. Table 2 shows the effect of electrostatic corrections on quasiparticle defect levels along the two paths for V. The two paths have different electrostatic corrections to the quasiparticle energies and that these corrections are substantial. Accounting for these errors is important to get a reliable value of charge transition level.
| +2/+1 | +1/0 | |||
|---|---|---|---|---|
| P1 | P2 | P1 | P2 | |
| E (Uncorrected) | 5.14 | 2.66 | 4.90 | 2.88 |
| E (Corrected) | 3.30 | 1.69 | 3.93 | 2.88 |
| 1.84 | 0.97 | 0.97 | 0.00 | |
Our quasiparticle defect levels and charge transition levels are in disagreement with previous DFT+GW calculations Choi and Chang (2009). This disagreement is likely a consequence of their choice of a small super cell and, more importantly, neglect of electrostatic corrections. Reference Choi and Chang (2009)’s value of for V (V) is 4.00 eV (3.22 eV) and of is 3.10 eV (2.43 eV); these values are close to our corresponding uncorrected values. Our calculations also disagree with the hybrid functional value Broqvist and Pasquarello (2006) of 3.7 eV for in V and 4.0 eV for between V and V. (Our corresponding values are 2.56 eV and 3.32 eV respectively.) It is also worth noting that the Kohn-Sham eigenvalues calculated with hybrid functionals also disagree with our calculations. Also, in hybrid calculations, even though total energies were corrected for electrostatic errors, the eigenvalues were not. While this is not necessary for the charge transition level calculated as a total energy difference, it can lead to erroneous results whenever eigenvalues are directly compared to single-particle excitation experiment.
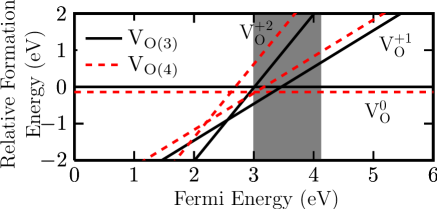
Figure 3 shows the relative formation energy of various charge states for the oxygen vacancies as a function of the chemical potential in monoclinic hafnia based on the values in Table 1. The formation energy in Figure 3 is plotted with respect to the formation energy of V. As evident from Figure 3, V, V and V are the most stable defects in the system depending on the value of . The experimentally relevant charge transition levels, and would be 2.56 eV and 3.32 eV respectively. Not shown in the figure is the stability for V/V defects. For larger values of the chemical potential, the V/V defects may become more stable. Also, shown in Figure 3 (in shaded grey), is the band gap and the expected band offset for Si (3 eV) when placed next to hafnia Bersch et al. (2008). For p-doped Si next to hafnia, the system is expected to have V vacancies.
It is also noted from Figure 3 that oxygen vacancies are positive U centers. U is defined as the energy of the reaction: . In terms of the charge transition levels, U for V+1 can be written as:
| U | (4) | |||
Our calculated values of U for both vacancies (V and V) are given in Table 3. Further, U can be broken into two parts – an electronic part (U) and a relaxation part (U) as defined in the curly brackets in the Eq. 5 below:
| (5) | ||||
This partitioning of U is instructive, because physically, U represents the quasiparticle gap of the system in the +1 charge state keeping the structure fixed and U represents sum of structural relaxation energies. Physically, U and U. Table 3 shows our calculated values of U and U. The reason for large relaxation energy is that, in the +1 and +2 charge state, the atoms nearest to the vacancy relax by up to 5-10% of their bond lengths. This is in agreement with previous studies of relaxation around the vacancies Foster et al. (2002); Zheng et al. (2007); *Kang03.
| U | |||
|---|---|---|---|
| V | 2.24 | -1.33 | 0.90 |
| V | 2.13 | -1.35 | 0.81 |
In conclusion, we have reported quasiparticle energies and charge transition levels of oxygen vacancies in monoclinic hafnia. We find that V, V and V are the most stable oxygen vacancies in the system as the Fermi level spans the band gap. By calculating the charge transition levels via two paths in configuration-space we gain insight to the charge defect stability and highlighted the importance of electrostatic corrections in super cell defect calculations. Further, we developed an intuitive partitioning of the defect charging energy U into a quasiparticle gap and sum of relaxation energies. Contrary to some previous studies, which found negative U or U close to zero, the oxygen vacancies were found to be positive U centers.
M.J. would like to thank Brad Malone and Dr. Georgy Samsonidze for fruitful discussions. This work was supported by National Science Foundation Grant No. DMR07-05941, the U.S. Department of Energy under Contract No. DE-AC02-05CH11231 and DE-SC0001878. Computational resources have been provided by NSF through TeraGrid resources at NICS. M.J. was supported by the DOE. Part of the modeling and simulations were carried out with electronic structure and quasiparticle codes developed under NSF support.
References
- Ribes et al. (2005) G. Ribes, J. Mitard, M. Denais, S. Bruyere, F. Monsieur, C. Parthasarathy, E. Vincent, and G. Ghibaudo, IEEE Trans. Device Mater. Reliab. 5, 5 (2005).
- Hobbs et al. (2004) C. Hobbs et al., IEEE Trans. Electron Devices 51, 971 (2004).
- Foster et al. (2002) A. S. Foster, F. Lopez Gejo, A. L. Shluger, and R. M. Nieminen, Phys. Rev. B 65, 174117 (2002).
- Zheng et al. (2007) J. X. Zheng, G. Ceder, T. Maxisch, W. K. Chim, and W. K. Choi, Phys. Rev. B 75, 104112 (2007).
- Kang et al. (2003) J. Kang, E.-C. Lee, and K. J. Chang, Phys. Rev. B 68, 054106 (2003).
- Anderson (1975) P. W. Anderson, Phys. Rev. Lett. 34, 953 (1975).
- Hybertsen and Louie (1986) M. S. Hybertsen and S. G. Louie, Phys. Rev. B 34, 5390 (1986).
- Gavartin et al. (2006) J. L. Gavartin, D. M. Ramo, A. L. Shluger, G. Bersuker, and B. H. Lee, Appl. Phys. Lett. 89, 082908 (2006).
- Broqvist and Pasquarello (2006) P. Broqvist and A. Pasquarello, Appl. Phys. Lett. 89, 262904 (2006).
- Xiong et al. (2005) K. Xiong, J. Robertson, M. C. Gibson, and S. J. Clark, Appl. Phys. Lett. 87, 183505 (2005).
- Choi and Chang (2009) E.-A. Choi and K. J. Chang, Appl. Phys. Lett. 94, 122901 (2009).
- Hedström et al. (2006) M. Hedström, A. Schindlmayr, G. Schwarz, and M. Scheffler, Phys. Rev. Lett. 97, 226401 (2006).
- Rinke et al. (2009) P. Rinke, A. Janotti, M. Scheffler, and C. G. Van de Walle, Phys. Rev. Lett. 102, 026402 (2009).
- Giannozzi et al. (2009) P. Giannozzi et al., J. Phys.: Condens. Matt. 21, 395502 (2009).
- Perdew et al. (1996) J. P. Perdew, K. Burke, and M. Ernzerhof, Phys. Rev. Lett. 77, 3865 (1996).
- Troullier and Martins (1991) N. Troullier and J. L. Martins, Phys. Rev. B 43, 1993 (1991).
- Wang et al. (1992) J. Wang, H. P. Li, and R. Stevens, J. Mater. Sci. 27, 5397 (1992).
- Adams et al. (1991) D. M. Adams, S. Leonard, D. R. Russell, and R. J. Cernik, J. Phys. Chem. Solids 52, 1181 (1991).
- Stacy et al. (1972) D. W. Stacy, J. K. Johnstone, and D. R. Wilder, J. Am. Ceram. Soc. 55, 482 (1972).
- (20) http://www.berkeleygw.org.
- Jiang et al. (2010) H. Jiang, R. I. Gomez-Abal, P. Rinke, and M. Scheffler, Phys. Rev. B 81, 085119 (2010).
- Grüning et al. (2010) M. Grüning, R. Shaltaf, and G.-M. Rignanese, Phys. Rev. B 81, 035330 (2010).
- Sayan et al. (2004) S. Sayan, T. Emge, E. Garfunkel, X. Zhao, L. Wielunski, R. A. Bartynski, D. Vanderbilt, J. S. Suehle, S. Suzer, and M. Banaszak-Holl, J. of Appl. Phys. 96, 7485 (2004).
- Bersch et al. (2008) E. Bersch, S. Rangan, R. A. Bartynski, E. Garfunkel, and E. Vescovo, Phys. Rev. B 78, 085114 (2008).
- Makov and Payne (1995) G. Makov and M. C. Payne, Phys. Rev. B 51, 4014 (1995).
- Lany and Zunger (2010) S. Lany and A. Zunger, Phys. Rev. B 81, 113201 (2010).
- Freysoldt et al. (2009) C. Freysoldt, J. Neugebauer, and C. G. Van de Walle, Phys. Rev. Lett. 102, 016402 (2009).
- Ordejón et al. (1996) P. Ordejón, E. Artacho, and J. M. Soler, Phys. Rev. B 53, R10441 (1996).
- Soler et al. (2002) J. M. Soler, E. Artacho, J. D. Gale, A. Garcia, J. Junquera, P. Ordejon, and D. Sanchez-Portal, J. Phys.: Condens. Matt. 14, 2745 (2002).