V2492 CYGNI: THE EARLY EVOLUTION OF THE 2010 OUTBURST
Abstract
We present Gemini-North optical and near-IR observations of a young eruptive star in Cygnus, designated as V2492 Cygni in the General Catalog of Variable Stars. This object is one of two young stars, located within 2 degrees of each other, that recently brightened by around 5 mags and were reported as possible new FU Orionis-type variables.
The outburst spectrum of V2492 Cygni shows atomic emission features throughout the optical and near-infrared. In the optical, H is in emission and has an associated blue-shifted absorption component. The far-red Ca II triplet lines are also in emission and, as with H, possess significant blue-shifted absorption. The optical TiO molecular bands are also in emission. In the near-infrared, Pa, Br, and the CO overtone bandheads are strongly in emission. Such spectral characteristics are very similar to those exhibited by both EX Lupi, the progenitor of the EXor class of eruptive variables, during its 2008 extreme outburst, and V1647 Ori during its elevated phase in 2003.
Additionally, we consider archival data on V2492 Cygni and investigate the pre-outburst nature of this young star. We construct a quiescent-phase spectral energy distribution which, via model fitting, gives insight into the circumstellar environment of the object prior to the current eruption.
Our investigation strongly suggests that the V2492 Cygni outburst appears to be more consistent with an EXor event, a fact supported by its recent 2 mag fading and stochastic variability.
1 INTRODUCTION
During the month of August 2010, eruptive outbursts of the two young stars HBC 722 and V2492 Cygni were reported by Semkov & Peneva (2010a,b) and Itagaki (2010), respectively. Both stars are located in the extensive Cygnus star formation complex near the North America and Pelican nebulae (see Reipurth & Schneider 2008 and references therein), and both were found to have optically brightened by between 4 and 6 magnitudes. In the case of HBC 722, this brightening occurred over a period of around three months, while for V2492 Cyg, the change in brightness occurred over 10 months. V2492 Cyg was independently discovered by the Palomar Transient Factor (PTF) and labeled PTF10nvs in a detailed study by Covey et al. (2011). The American Association of Variable Star Observers, the AAVSO, designate the star VSX J205126.1+440523.
These two independent events are significant because such large amplitude outbursts are rare occurrences. Two types of eruptive events are known in young stellar objects (YSOs), specifically, those named after FU Orionis (Wachmann 1954; Herbig 1966) and those named after EX Lupi (Herbig 1977). FU Orionis outbursts, often referred to as FUor outbursts (Ambartsumian 1971), show 5–6 magnitude increases in optical brightness and can take from decades to even a century to fade back into quiescence. The two most most recent FUor events observed were the outbursts of V1057 Cyg in 1969 (Welin 1971; Herbig & Harlan 1971) and the eruption of V1647 Ori in 2004 (e.g., Reipurth & Aspin 2004, Briceno et al. 2004, Aspin & Reipurth 2009). The latter has had an unusual light curve, fading away after only two years, but returning again to its elevated state, and today the available evidence supports its classification as a FUor. EX Lupi outbursts, commonly called EXors (Herbig 1977, 1989), exhibit optical brightness increases of 2–5 mags and fade after periods of a few months to a few years (Herbig 1977, 2008). They are also observed to be repetitive. For example, the EXor variable VY Tau brightened and faded more than a dozen times between 1930 and 1970 (Meinunger 1969, 1971; Herbig 1977, 1990).
Both types of eruptive events are thought to be driven by the same underlying process, commonly believed to be enhanced mass accretion through a disturbed/disrupted circumstellar disk and onto the young stellar photosphere. Quiescent T Tauri star accretion rates of 10-7 to 10-8 M⊙ yr-1 have been observed to increase by a factor of 100 to 1000 during eruptive outbursts and can thereby result in a significant amount of mass being accreted over relatively short timescales. This so-called “accretion disk model” (Hartmann & Kenyon 1985, 1996) can explain many of the observed properties of both FUors and EXors, although the mechanism by which the disk becomes unstable is still being debated. An outstanding question regarding FUor and EXor outbursts is why they differ so much in many of their observed characteristics including, for example, the event timescale and amplitude, and their optical and near-infrared (NIR) spectral properties (FUors exhibit predominantly optical and NIR absorption spectra whereas EXors always possess strong emission features). An alternative explanation for FUor outbursts has been proposed by Herbig (1989), Herbig et al. (2003), and Petrov & Herbig (1992, 2008). Their model, which is based on a rapidly rotating star with regions of significantly different photospheric temperatures, can also explain many of the observed characteristics of FUor eruptions.
In this paper we present optical and NIR observations of the recently discovered eruptive variable V2492 Cyg. The star is located in a small molecular cloud core surrounded by a bright rim in the Lynds Bright Nebula LBN 343. Our goals are to i) characterize the early stages of the eruption, ii) better understand how such a young star fits into the established framework of FUor and EXor outbursts, iii) provide new observations that can be used to further test theoretical/numerical models, and iv) gain further insight into the initiation and progression of such dramatic and highly energetic events.
2 OBSERVATIONS AND DATA REDUCTION
Table 1 shows the complete observing log for the observations presented below. All observations of V2492 Cyg were taken using the “Fredrick C. Gillett” Gemini-North 8 m telescope located on Mauna Kea, HI, in September, October, and November 2010 (see Table 1 for complete dates). The instrument used for the optical observations was GMOS-N, the facility optical imager and spectrograph (Davies et al. 1997; Hook et al. 2004). For the imaging, we used the r’ filter and a total exposure time per source of 60 s. For the spectroscopy, we used the B600 grating and central wavelength 7500 Å. A 075 wide long-slit was used resulting in a resolving power, R, of 1200 (0.45 Å pixel-1). This value of R gives a full-width half maximum (FWHM) of unresolved lines of 130 km s-1. The total on-source exposure time for the spectroscopy was 300 s. Identical observations of the spectrophotometric standard star G191-B2B were also taken to allow flux calibration and sensitivity function definition. All spectra were reduced using the Gemini GMOS iraf package (v1.10).
Our NIR imaging observations were taken over the aforementioned period using the Gemini-North facility NIR camera, NIRI (Hodapp et al. 2003). Due to the intrinsic brightness of the sources, the f/32 camera was used (allowing shorter exposure times) and data was acquired in J, H, K’, and L’ filters. For each filter, four dithered images were taken to allow for both sky subtraction and uncertainty estimation. Total exposure times of 20 s were used for J, H, and K’, and 48 s for L’. Similar observations of the NIR faint standard star FS 150 were also taken for flux calibration purposes. The images were reduced using the Gemini NIRI iraf package (v1.10). Extraction of aperture photometry from the reduced images was performed using the Starlink gaia program.
NIR spectroscopic observations were acquired using the Gemini-North facility integral-field unit (IFU) spectrograph, NIFS (McGregor et al. 2003). Observations using the J, H, and K gratings were taken with total exposure times of 120 s per waveband and resulted in spectra with a spectral resolution of R5000. Sky observations, taken using an ’ABBA’ offset sequence, were also acquired to facilitate accurate sky subtraction. Similar observations of the A0 V star HIP 103222 were taken to allow the removal of telluric features from the target spectra. The data were reduced using the Gemini NIFS iraf package (v1.10). The final spectra of the targets are the sum of the IFU pixels lying within an 05 radius software aperture centered on the targets. Flux calibration was performed using the broad-band J, H, and K source brightness close to the time of the spectroscopic observations. We converted the broad-band magnitudes to flux density using the Gemini Observatory conversion tool111http://www.gemini.edu/sciops/instruments/midir-resources/imaging-calibrations/fluxmagnitude-conversion.
3 V2492 Cyg AND ITS ENVIRONMENT
Below we consider our knowledge of V2492 Cyg prior to its 2010 outburst. In what follows, we use the phrase ’post-outburst’ to refers to the period from immediately after the rise to maximum light but prior to the sources return to its pre-outburst, quiescent brightness.
3.1 At Optical Wavelengths
In optical archival images taken in October 1997, V2492 Cyg appears as a faint, unremarkable star located close to the edge of an irradiated molecular cloud edge around 15′ southeast of the Pelican Nebula (see Figure 1). It is associated with an IRAS source, IRAS 20496+4354, and is the possible exciting source of a Herbig-Haro bow shock, HH 569, some 2′ (0.35 pc) to the south (Bally & Reipurth 2003). Images of the region immediately surrounding V2492 Cyg are shown in Figure 2. Bally & Reipurth (2003) classified IRAS 20496+4354 as a moderate-luminosity Class I protostellar object. In the Dobashi et al. (2005) visual extinction (AV) maps, V2492 Cyg lies near a filamentary dust structure in a region with a general line-of-sight AV of 4–5 mags. The distance to the North America/Pelican Nebula region of Cygnus has been estimated to be 55050 pc (Laugalys et al. 2006).
Itagaki (2010) recently documented eruptive behavior in V2492 Cyg finding that its optical (unfiltered) brightness rose from 17.5 on UT 2008 Aug 7 to 13.8 two years later. The commencement of this outburst, however, could have been any time between UT 2008 Aug 7 and his next observation on UT 2009 Dec 19. His multiple observations between 2009.9 and 2010.7 show a close to linear rise in optical brightness of approximately 0.25 mag month-1. For reference, USNO-B1 gave optical magnitudes for V2492 Cyg of B=20.17 and R=18.28 on 1979.9. Covey et al. (2011) presented an extensive, detailed study of V2492 Cyg including considerable R-band optical photometry from the Palomar Transient Factory images. These data demonstrated that the current event peaked in August 2010 (at R=13.3) and rather than the linear rise in brightness as seen by Itagaki (2010), significant stochastic variability was present from as early as August 2009. In addition, their light curve showed multiple brightness peaks with a typical peak-to-peak timescale of 100 days suggesting the possibility of periodic as well as uncorrelated variability.
3.2 At Infrared Wavelengths
V2492 Cyg was not detected in the 2MASS survey at any wavelength. This implies that at the time the survey images were acquired, the source was considerably fainter than the quoted 2MASS 10 detection limits of 15.8, 15.1, and 14.3 mags at J, H, and K’, respectively (Skrutskie et al. 2006)222Figure 15 of Skrutskie et al (2006) indicates that the 3 detection limit of 2MASS is approximately 0.5, 1.0, and 1.4 mags fainter at J, H, and K’, respectively. In the 2MASS images, there is no indication of any object at the optical/NIR coordinates of V2492 Cyg. We have, however, found a detection of V2492 Cyg in the UKIDSS333UKIDSS is the UKIRT Infrared Deep Sky Survey. See http://www.UKIDSS.org. database (Lawrence et al. 2007) from UT 2006 June 10; the only wavelength at which it is brighter than the 2MASS detection limits is K’ where it has a magnitude of 13.3. A comparison of the 2MASS and UKIDSS K’ images (taken in 2000 and 2006, respectively) is shown in Figure 3. Magnier et al. (1999) included V2492 Cyg in a catalog of young stellar objects (YSOs) and noted that at far-IR wavelengths it had a flat spectrum suggestive of an object transitioning from the protostellar to T Tauri evolutionary phase. Finally, Covey et al. (2011) present NIR photometric observations from five epochs spanning the period July 2010 to September 2010.
The AKARI/IRC Point Source Catalog (Murakami et al. 2007) contains a source within 6′′ of the optical/NIR coordinates with 9 and 18 m fluxes of 2.0 and 2.9 Jy, respectively. The star was not detected in AKARI/FIS observations. Spitzer did, however, detect V2492 Cyg in all four IRAC bands and with MIPS at 24 and 70 m. Spitzer images, centered on V2492 Cyg, are shown in Figure 4. MSX6C also detected V2492 Cyg at infrared wavelengths from 8.28 to 21.34 m.
The IRAS source associated with V2492 Cyg has Point-Source Catalog (PSC) fluxes at 12, 25, 60, and 100 m fluxes of 3.4, 6.6, 28.2, and 58.3 Jy, respectively. The precessed IRAS coordinates are within 05 of the optical/NIR position and therefore well within the 16′′ IRAS error ellipse. No obvious optical/infrared sources are in the immediate vicinity of V2492 Cyg, making the association of optical and IRAS sources firm. One interesting point, however, is that the IRAS 60 m flux (taken in 1983) is 5 larger than the 60 m Spitzer/MIPS flux (taken in 2006/2007).
3.3 At mm Wavelengths
The Bolocam Galactic Plane Survey (GPS) contains 1.1 mm images of the region containing V2492 Cyg and lists a source within 4′′ of its coordinates (GPS designation G084.466-00.135). The flux quoted in the GPS catalog is 14874 mJy and since the next closest mm source is 46′′ away, we adopt this value for its 1.1 mm flux.
4 RESULTS
4.1 Optical Imaging
The optical images of V2492 Cyg presented in Figure 2 show a pre-outburst 1997 H image taken from Bally & Reipurth (2003, left) and our post-outburst Gemini GMOS r’ image (right) taken on UT 2010 September 5. V2492 Cyg, located at the image centers, is very much brighter post-outburst. No obvious optical nebulosity is seen around V2492 Cyg, even in its photometrically elevated state. Nor was one found in the R-band images of Covey et al. (2011). For comparison, we note that all classical FUors and FUor-like objects have been found to exhibit nebulous structure in outburst which often takes the form of curving tails extending from the young star (Goodrich 1985). EXors do not typically possess associated nebulosity.
Due to source saturation, we could not obtain photometry from our optical images, however, we note that at the time of the GMOS observations, the American Association of Variable Star Observers (AAVSO) database shows the source having an optical V-band magnitude of 15.10.1. In Figure 5 we show the AAVSO V-band light curve of V2492 Cyg. In addition to the AAVSO data444We refer the reader to the AAVSO web site at http://www.aavso.org for access to the V-band photometry shown in Figure 5., we have also included the ’unfiltered’ photometry from Itagaki (2010, blue downward-facing arrows) and the R-band data from Covey et al. (2011, grey filled circles). The Itagaki (2010) photometry serves as an indication of the optical progression of the rise from quiescence to outburst and since these data are in unfiltered optical light, they are upper limits. The Covey et al. (2011) data indicates both the level of variability present over the time period shown.
4.2 Near-Infrared Photometry
We can place V2492 Cyg in NIR color-color (henceforth c-c) diagrams and thereby investigate the level and associated variability of overlying extinction and intrinsic thermal excess emission. One note of caution is, however, warranted. If V2492 Cyg is a Class I protostar, its NIR fluxes may be significantly modified by circumstellar scattering. This was studied in detail by Whitney, Kenyon, & Gomez (1997) who, using simple extinction+scattering models, discussed the effect of scattering on emergent flux. Below we assume that the direct flux from V2492 Cyg is not dominated by scattering but that it is true, reddened stellar/disk flux. Our results are likely not applicable if scattered flux forms the major component of the observed NIR signal.
Figure 6a shows on the a NIR J–H vs. H–K (henceforth JHK) while Figure 6b shows the H–K vs. K–L (henceforth HKL) c-c diagram. Some of the 2 and 3 m photometric data included were taken using filters with slightly different central wavelengths and bandpasses (e.g. K and K’, and L and L’), however, within the associated uncertainties (typically 10% on photometry, 14% on colors) we consider the slight differences in magnitudes/fluxes between filters unimportant for the analysis below. Our new NIR photometric values are detailed in Table 2.
In the JHK c-c diagram (panel a), points #1, #4, and #8 shows the location of V2492 Cyg at three different epochs i.e. the UKIDSS (JHK’) observations (UT 2006 June 10) and our two Gemini/NIRI (JHK’L’) observations (UT 2010 September 5 and November 25). In our Gemini/NIRI data from September 5 (the closest observation to the peak optical brightness), V2492 Cyg has a K’ magnitude of 8.120.1 while approximately 3 months later (November 25) it had faded to 9.630.1. With a pre-outburst UKIDSS K’ magnitude of 13.15, the source had therefore brightened at 2 m by 5 mags between 2006 (#1) and 2010 (#4). This is likely the result of a combination of a decrease in 2 m thermal excess and/or a reduction in overlying visual extinction.555An alternative may be that the disk is hotter at maximum and optically thick gas interior of the dust sublimation radius adds NIR continuum flux. In addition to points #1, #4, and #8, we have also included the J, H, and K photometry from Covey et al. (2011), points #2, #3, and #5, #6, and #7, in chronological order. The trend from the earliest photometry (#1) to the observation just after maximum brightness (#4) is approximately linear with both J–H and H–K decreasing with time. This progression is close to being along a reddening vector suggesting that the change is due to a reduction in overlying extinction. In Figure 6a we show reddening vectors (dashed lines) using the extinction law defined by Robitaille et al. (2007) and used in their young star spectral energy distribution (SED) models. These extend from the extremes of the zero-age main sequence/giant branch and from the end of the CTTS locus defined by Greene & Meyer (1995), the latter extends between points labeled A and B. It may be the case that the linear change in location of V2492 Cyg in the JHK c-c diagram is the result of the presence of a somewhat different reddening law than that shown in Figure 6a. Perhaps more plausibly, the variation in JHK colors could be caused by a combination of changes in overlying extinction and K-band thermal excess.
To explore the first of these two options, we plot a selection of reddening laws together with the V2492 Cyg data in Figure 7 with the sequence of JHK observation of V2492 Cyg shown as filled black circles. Point #1, however, is outside the area plotted but is located on the dashed green line (see Figure 6a for details). All reddening vectors, together with the dotted line extending to point #1, originate at the red end of the CTTS locus (point B, again, see Figure 6a). We have plotted four different reddening laws defined in the literature and often used in young star JHK diagrams. All vectors represent AV=10 mags. The solid grey lines show the Cardelli, Clayton, and Mathis (1989, henceforth CCM) reddening vectors for four different values of R, the ratio of total to selective extinction. The values shown are for R = 2, 3.1, 5.0, and 7.0. R=3.1 is the typical interstellar reddening value while R=5.0 is often quoted for extinction towards young stars in dense dark clouds. As can be seen, all four CCM reddening vectors have very similar slopes with the major effect of changing the value of R being the length of the AV=10 mags reddening vector. Close to the CCM vectors lies a generic reddening law in which the wavelength dependence of reddening is proportional to the scaled wavelength (with respect to the value at 0.55 m) to the power of =–1.6 (red dashed line). Reddening from this relationship closely matches the CCM reddening laws. The single-dotted-dash line (blue) shows the Rieke & Lebofsky (1985) reddening law defined using observations of the galactic center while the triple-dotted-dash line (purple) shows the law adopted by Robitaille et al. (2007) in the generation of their SED models. The latter two reddening laws produce somewhat different slopes with respect to the CMM and =–1.6 laws. However, none of these reddening laws extend through the sequence of V2492 Cyg colors. What we can conclude from Figure 7 is that neither changes in the adopted reddening law nor in the value of R used would result in the colors variations observed in V2492 Cyg.
The location of the three Covey et al. (2011) JHK observations, obtained between our two Gemini/NIRI datasets (i.e. points #5–7), indicate that within a few days of our acquisition of the data that gave rise to point #4 the source’s JHK colors began to reverse the progression observed (from points #1 to #4). A similar behavior was seen during the 2003–2006 eruption of V1647 Ori (Aspin, Beck, & Reipurth 2008) where it was attributed to a variation of overlying extinction of around 10 mags. However, in the case of the color variations of V1647 Ori, they occurred directly along a Rieke & Lebofsky (1985) reddening vector. Our most recent observation, point #8, shows that this reversal continued and at the end of November 2010 the source’s JHK colors were similar to what they were in July 2010 (points #2 and #3) although in November 2010, V2492 Cyg had a K’ magnitude of 9.630.1 while in July 2010 Covey et al. found a value of 8.450.02. As an exercise, if we attribute the total change in JHK colors from point #2 to point #4 to changes in AV, then the amount of overlying visual extinction would have to have reduced by 7 mags. If we also attribute the extremely large colors in June 2006 (point #1) to reddening, then the change of AV from #1 to #4 would amount to 20 mags.
In our HKL c-c diagram (Figure 6b, right) there exists only two epochs of data. Point #4 (2010 September 5) shows V2492 Cyg to possess a significant 3 m thermal excess suggesting that even though the outburst had already occurred, a considerable amount of heated dust must still be present in the circumstellar environment close to the star. Approximately three months later (UT 2010 November 25, point #8), the 3 m thermal excess had grown even larger implying a continuing build-up of dust close enough to the star/accretion region to be heated to temperatures of 1000 K. This dust, however, must be far enough so as not to be sublimated at temperatures of 1500 K. Tuthill et al. (2001), and subsequently Lykou et al. (2010), suggested that the distance from a star where dust sublimates can be estimated using the equation
| (1) |
where rsub is the sublimation radius in AU, Tsub is the sublimation temperature in K, and Lbol is the system bolometric luminosity in L⊙. Assuming Tsub = 1500 K and a pre-outburst Lbol of 35 L⊙ (Bally & Reipurth 1997; Covey et al. 2011), we obtain a value for rsub of 0.2 AU. In its elevated state, Covey et al. (2010) suggest that the bolometric luminosity increases by a factor 100. This would result in rsub increasing by a factor 10 to 2 AU. Therefore, we suggest that the dust content of the disk region between 0.2 and 2 AU must have been accreted or sublimated during the outburst.
4.3 Spitzer Photometry
Similarly, c-c plots can be made from Spitzer IRAC and MIPS photometry. Such diagrams are useful for assigning evolutionary classes to young stars since in them Class I protostars, Class II classical T Tauri stars (CTTSs), Class III weak-line T Tauri stars, and main sequence stars are well separated (Allen et al. 2002). We have extracted photometric magnitudes from the Spitzer IRAC and MIPS images using the IDL routine photvis (v1.1, Gutermuth et al. 2004, 2008666We have used the same aperture sizes and photometric zeropoints as in the aforementioned papers.). These values are given in Table 5. In the IRAC [3.6]–[4.5] vs. [5.6]–[8.0] plot (Figure 8a) V2492 Cyg (point #1) lies well within the Class I regime. In the IRAC/MIPS [3.6]–[4.5] vs. [8.0]–[24] plot (Figure 8b), the source lies on the Class I–II boundary. In these Figures we also show the locations of several FUors for comparative purposes (points #2 through #6) together with the location of V2492 Cyg using the Spitzer fluxes given in Covey et al. (2011, point #7). What we can conclude from these plots is that the location of V2492 Cyg is consistent with it being a Class I protostar. We note that in the [3.6]–[4.5] vs. [5.6]–[8.0] plot, V2492 Cyg lies closest to the FUor-like object L1551 IRS5 (point #5)777L1551 IRS5 was saturated in the Spitzer MIPS 24 m images and so our photometry is that given at 24 m in Osorio et al. (2003).. We are uncertain as to why the Covey et al. (2011) [3.6]–[4.5] vs. [8.0]–[24] V2492 Cyg point is displaced from our measurement since both use the same datasets. Perhaps this indicates that the uncertainties on the extracted 24 m photometry are somewhat larger than the error bars shown.
4.4 Optical Spectroscopy
4.4.1 The UT 2010 September 5 GMOS-N Spectrum
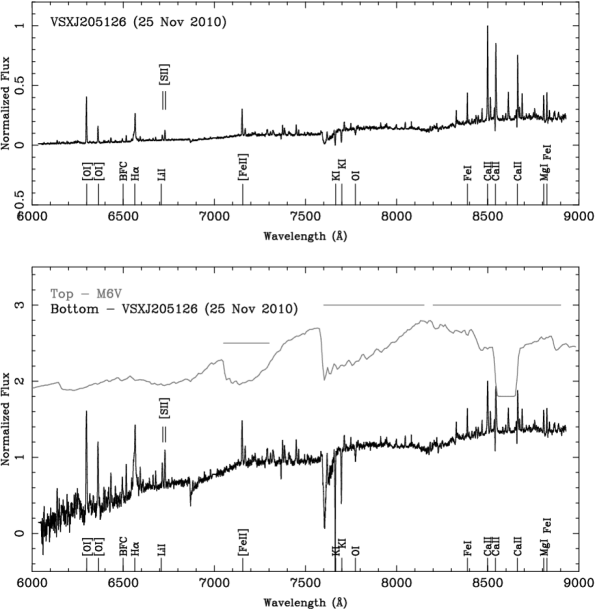
Our GMOS-N optical spectrum of V2492 Cyg from UT 2010 September 5 is shown in Figure 9 (top). It has a signal-to-noise of 200 and was acquired close to maximum optical brightness. The spectrum is heavily veiled and, hence, no photospheric absorption features are visible. V2492 Cyg shows a wealth of emission lines including H (6563 Å), Ca II (8498, 8542, and 8662 Å), and numerous neutral and singly ionized Fe lines. Both K I (7665 and 7699 Å), and O I (7773 and 8446 Å) are, however, in absorption. We note that Li I is not detected. The complete list of emission and absorption lines with equivalent widths, EW, 1 Å, together with flux values, are given in Table V2492 CYGNI: THE EARLY EVOLUTION OF THE 2010 OUTBURST. Figure 9 (bottom) also shows a comparison of this optical spectrum with that of an M6 V dwarf. As Covey et al. (2011) discovered, and we confirm here, the TiO bands, found in absorption in late-type stars, are in emission in V2492 Cyg. The spectrum of the M6 V dwarf is used here as an example of a late-type star showing strong TiO band absorption and we have marked the extent of the TiO emission in V2492 Cyg by horizontal lines above the M6 V spectrum.
Although the resolving power of our GMOS spectra is only R1200, we can nevertheless obtain some insight into the velocity structure present in various spectral features via line profile fitting. We note that an unresolved arc lamp line using the B600 grating and 075 slit has a FWHM130 km s-1 and, hence, profile fitting should conservatively give reliable velocity information at the 20% level or 30 km s-1. It is this value we adopt for the uncertainty on quoted velocities.
The H emission feature shows associated blue-shifted absorption out to velocities of –450 km s-1, similar to that found by Covey et al. (2011). The Ca II triplet emission lines possess weak blue-shifted absorption components out to velocities of –300 km s-1. The absorption components on H and Ca II can be better seen in the expanded views shown in Figure 10. H has an EW of –16.3 Å but in reality the value will be somewhat larger (i.e. more negative) due to the presence of the associated absorption components. The (deconvolved) full-width 10% intensity (FW10%) of H is 550 km s-1 while the location of the minimum of the absorption component is –210 km s-1. The peak of the H emission is close to zero velocity as it is for the Fe I lines and the Ca II triplet lines. The velocity of the minimum blue-shifted absorption associated with the Ca II triplet lines is –190 km s-1 and, within the associated uncertainties, is the same as on H.
4.4.2 The UT 2010 November 25 GMOS-N Spectrum
Optical spectroscopy of V2492 Cyg was also obtained on Gemini-North using GMOS on UT 2010 November 25. The same instrumental setup was used as for the September 5 spectrum. Figure 11 shows this spectrum in the same format as the earlier spectrum. At the time of acquisition, V2492 Cyg had optically faded by 4.5 mags and had an R-band magnitude of 180.2 (Covey 2010, private communication).
There are several differences between the optical spectra taken on UT 2010 September 5 and November 25, specifically, the TiO emission bands have slightly changed shape (as was also seen by Covey et al. 2011), H has lost its deep blue-shifted absorption component, and several other spectral lines have changed strength or have appeared/disappeared. The fading of V2492 Cyg from R13.5 to 18.0 between UT 2010 September 5 and November 25 would correspond to an EW increase for constant line emission of 60. With this in mind, we find that:
-
•
As noted above, H has lost its deep blue-shifted absorption component. Absorption appears to be present nonetheless but at lower velocities. One possible scenario is that H emission has filled in the blue-shifted absorption. The EW of the H emission is –27.6 Åas opposed to –16.3 Å on September 5. For constant H emission, the change in continuum level between the two dates would result in an H EW of 1000 Å. We can conclude that the H emission has declined in intensity by a factor 35 between the two observations. In addition, the FW10% intensity of H has declined from 550 km s-1 to 300 km s-1.
-
•
The [O I] lines at 6300 and 6363 Å have become much more prominent and rival H. Their EW changed from –1.3 and –0.6 Å on September 5 to –38.9 and –13.3 Å on UT 2010 November 25. This increase in EW is a factor of about 30 suggesting that the [O I] emission declined by around a factor 2 between the two dates. However, the O I absorption lines at 7774 and 8446 Å have weakened by factor 2 over the same time period.
-
•
The reappearance of [S II] lines at 6716 and 6731 Å, which were absent in the September 5 spectrum yet present in the optical spectra of Covey et al. (2011), suggests that shocks have reappeared in the intervening period. The ratio of the EWs of the two [S II] emission lines (6716/6731) is 0.6. Since the production of these lines and their flux ratio are only weakly dependent on temperature and more strongly dependent on density, we have used the IRAF program nebular.temden to calculate the electron density, ne, necessary to produce this ratio. We find that a high density environment is needed with an ne4000 cm-3 for an electron temperature of 104 K. We note that the critical density for [S II] is 5 larger than this value and that typical electron densities in Herbig-Haro shocks is 1000 cm-3.
-
•
The disappearance of blue-shifted absorption on the Ca II triplet line at 8498 Å is peculiar especially since it is still present and well detected on the 8543 and 8662 Å Ca II triplet lines. On September 5, this line, however, had the weakest blue-shifted absorption of the three lines (see Figure 10). The velocity of the minimum in the blue-shifted absorption has declined from –190 km s-1 to –125 km s-1, a proportionally similar velocity change as the blue-shifted absorption on H. Interestingly, the EW of the Ca II triplet lines are similar on the two observing dates. This implies that as the broad-band R flux declined the Ca II emission declined by a similar amount.
-
•
The K I absorption lines at 7665 and 7699 Å behave in a similar manner to the Ca II triplet lines in that their EW remained approximately constant in the September and November spectra.
4.5 NIR Spectroscopy
4.5.1 The UT 2010 October 2/3 NIFS Spectra
The NIFS J, H, and K spectra of V2492 Cyg taken on UT 2010 October 2 (K band) and 3 (J and H bands) are shown in Figure 13. The full spectral range observed is shown in the top-left panel with the J, H, and K bands shown in the top-right, bottom-left, and bottom-right panels, respectively. For comparison we also show the prototypical EXor eruptive variable EX Lup.888The EX Lup spectrum is from the SpeX spectrograph at the NASA IRTF telescope and has a lower spectral resolution of 1200. Apart from the continuum slope, which increases with wavelength in V2492 Cyg and decreases with wavelength in EX Lup, almost all features observed in EX Lup are reproduced in V2492 Cyg and are totally dissimilar to those seen in FUors such as FU Ori. Specifically, the CO overtone bandheads are strongly in emission as are Br and Pa. Other H I emission lines are also present as are emission lines from Mg I, Na I, and Fe I999The forest of emission lines from 1.15 to 1.22 m are mostly from neutral Fe.. We additionally note that the broad water vapor bands at 1.4 m and 1.8 m are weakly in absorption in EX Lup while in V2492 Cyg they appear weakly in emission (as indicated by the small increase in continuum slope near those wavelengths).
The observed Pa and Br line fluxes in the UT 2010 October 2/3 NIR spectra of V2492 Cyg are 1.110-13 (EW=–11.8 Å) and 9.010-14 ergs cm-2 s-1 Å-1 (EW=–5.1 Å), respectively. These correspond to line luminosities of 0.001 L⊙ in both Pa and Br assuming AV=0, d=600 pc, and that the line flux is emitted isotropically. A complete list of spectral features present in the NIR spectra of V2492 Cyg is given in Table V2492 CYGNI: THE EARLY EVOLUTION OF THE 2010 OUTBURST.
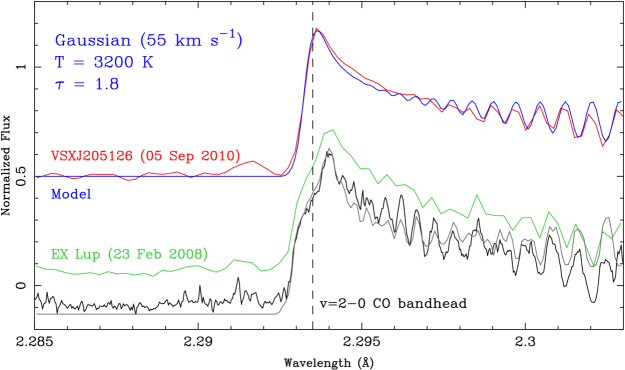
Since V2492 Cyg exhibits CO overtone bandhead emission, we can investigate the characteristics of the CO emission region using simple numerical models. We follow our previous CO modeling in Aspin et al. (2010) where we studied the bandhead structure in EX Lup during its 2008 extreme eruption. The model we used is based on that of Dent & Geballe (1991) and Carr & Tokunaga (1992) and calculates the CO bandhead emission from an isothermal slab of emitting molecular gas characterized by a CO temperature, TCO, and optical depth in the CO bandhead, , and a gas velocity profile. The velocity profiles we have used are either Gaussian of FWHM vg or that of a Keplerian rotating gas disk with velocities defined by the mass of the star, M∗, the inner and outer radii of the CO gas disk, rin and rout, respectively. Although this model is relatively simple, its ability to produce good matches to CO bandhead emission spectra and its small number of free-parameters lend credence to the uniqueness of the values obtained and the values themselves.
Prior to presenting the results of the CO bandhead modeling, it is informative to comment on the effect of changing the various free parameters used on the model spectrum. This is shown in Figure 14. In panel (a) we plot a model (blue) using the free-parameters vg = 55 km s-1, TCO = 3200 K, and = 1.8. In the subsequent panels we vary one of the free-parameters of the model to demonstrate the changes that occur. In panels (b) and (c, red) we change vg to 100 and 25 km s-1, respectively. Note that the bandhead slope changes as does the visibility of the higher order transitions (resulting in the sinusoidal structure). In panels (d) and (e, green) we change TCO from 1500 to 4000 K, respectively. The effect of changing TCO is to raise or lower the level of the emission longward of the bandhead wavelength, specifically, i) at low TCO values (e.g. 1500 K) the higher order CO transitions are stronger and hence the bandhead emission remains strong to longer wavelength, and ii) at high TCO values the opposite is true and the longer wavelength CO bandhead emission is suppressed. In panels (f) and (g, purple) we change from an optically thin = 0.01 to optically thick ( = 3.6). This changes the emission strength at wavelengths longward of the bandhead and, in some ways, mimics the effect of changing TCO. If we next consider a disk velocity profile, as shown in panels (h, pink), the so-called ’blue hump’101010The ’blue hump’ is the name given to the enhanced emission on the blue side of the CO bandhead limit at 2.2935 m). appears and the shape of the bandhead changes significantly from that occurring when using a simple Gaussian velocity profile. The disk velocity profile used in panel (h) we had M∗ = 0.6 M⊙, TCO = 2500 K, 0.1, and rin and rout = 1.2 and 2.01010 m, respectively. These were the values used for the best-fit model to the EX Lup spectrum shown in Figure 15. If we obscure part of the disk velocity profile, as might be the case in a real star–disk system, we obtain the CO bandhead profiles shown in panels (i) and (j, pink). In panel (i) we have removed all blue-shifted velocities from the disk velocity profile and the resultant spectrum shows a significantly red-shifted bandhead peak and peculiar structure in the higher CO transitions. If we remove all red-shifted velocities from the disk velocity profile (panel j) we see a CO bandhead with a ’blue hump’ and truncated emission longward of 2.2935 m. Clearly intermediate obscuration between these two extremes will produce an intermediate CO profile; such spectral peculiarities could be considered as diagnostics of a partly obscured gas disk around a young star.
For V2492 Cyg, we have investigated a wide range of values for the above free parameters for both a Gaussian and disk velocity profile. Specifically, these are vg = 0–150 km s-1, TCO = 1500–4500 K, = 0.01–10, M∗ = 0.1–10 M⊙, and rin and rout = 109–1011 m with rout rin. The best-fit model to the observed CO bandhead profile required a Gaussian velocity profile with vg = 5510 km s-1, TCO = 3200200 K, and = 1.80.1. This model (in blue) is shown overlaid on the observed profile (in red) in Figure 15. For comparison, we also show the observed (black) and best-fit model profile (grey) for EX Lup from Aspin et al. (2010). Here, a disk profile was required to fit the observations. Although the spectral resolution of the EX Lup spectrum was considerably higher than that of our Gemini/NIFS spectrum (Keck II/NIRSPEC with R18,000 as opposed to Gemini/NIFS with R5,000), a version of the EX Lup spectrum binned to match our V2492 Cyg resolution (green) shows that the observed ’blue-hump’ structure, indicative of a disk velocity profile, is still clearly present. We conclude, therefore, that a disk velocity profile is not required to reproduce the observed CO bandhead profile in V2492 Cyg, rather, a simple Gaussian profile is sufficient. This suggests that the CO emission arises from gas with a simple Gaussian velocity profile, perhaps in accretion funnels or in regions with little radial velocity component such as the inner edge of an accretion disk viewed pole-on.
4.5.2 The UT 2010 November 26/27 NIFS Spectra
Second epoch NIR NIFS spectra of V2492 Cyg was obtained on UT November 26 (K band) and 27 (H band)111111No J band spectrum was acquired due to poor weather conditions and instrument problems.. These spectra are presented in Figure 16. As in Figure 13, top-left is the full 1–2.5 m spectrum of V2492 Cyg together with the same EX Lup spectrum. Bottom-left is a closer view of the H-band spectra and bottom-right is the same for the K-band. Instead of the J-band spectrum at the top-right, we now show a dereddened version of the full 1–2.5 m spectrum. The dereddening used an extinction of AV=20 mags and shows that such a value for optical extinction produces a spectral slope that more resembles that of EX Lup (which has an intrinsic AV of around 0–1 mags). The EW, line flux, and continuum values for this spectrum are also shown in Table V2492 CYGNI: THE EARLY EVOLUTION OF THE 2010 OUTBURST.
The main differences between the UT 2010 October 2/3 and November 26/27 NIR spectra of V2492 Cyg are:
-
•
The continuum slope is now considerable redder than previously seen. This is consistent with the significant change in NIR colors between the two epochs and related above.
-
•
The water vapor bands exemplified by the 1.7–2.2 m feature, are more strongly in emission than previously observed.
-
•
The CO overtone bandheads remain in emission although their strength has declined by a factor 4 during the intervening period. The profile of the v=2-0 CO bandhead at 2.294 m is similar to that seen in October, however, the spectral structure observed is less well defined and the slope of the bandhead itself is slightly shallower. Fitting our CO bandhead emission model to the UT 2010 November 26 data produces a best fit as shown in Figure 17. This model requires vg=8510 km s-1, TCO=4200200 K, and =2.00.1 to reproduce the observations. This represents increases in Gaussian velocity, CO temperature, and optical depth with respect to the values found for the best fit to the UT 2010 October 2/3 data. Since the same instrument and instrumental setup was used for both sets of observations, we consider these changes to be significant at the level determined by the associated uncertainties.
-
•
Molecular hydrogen (H2) emission, in the form of the v=1-0 S(1) line at 2.122 m, has become more apparent although its intrinsic strength has remained approximately constant at 1.410-14 ergs cm-2 s-1. [Fe II] emission at 1.644 m is now detected albeit at a weak level (3.610-15 ergs cm-2 s-1). Both these lines are typically associated with the generation of shocks.
-
•
The Br line flux decreased by a factor 4 between UT 2010 October 2/3 and November 26/27. This is very similar to the reduction in both the CO bandhead emission and the Na I emission at 2.208 m. The profile of Br is very similar in the two spectra with a (deconvolved) FWHM200 km s-1. The line luminosity in Br has declined from 0.001 L⊙ on UT 2010 October 2 to 0.0003 L⊙ on UT 2010 November 26, again assuming AV=0 and d=600 pc.
4.5.3 A Comparison to the pre-October 2010 NIR Spectra
Covey et al. (2011) presented NIR spectra of V2492 Cyg taken on UT 2010 July 14 and 18. On these dates the star had an optical brightness of RPTF121212PTF stands for the Palomar Transient Factory. Definition of the RPTF filter is given in Covey et al. (2011). 15.5 and 16, respectively. These values are around 2 and 2.5 mags fainter (on the RPTF magnitude scale) than at maximum light which occurred in early September 2010. In quiescence (e.g. in July 2009), V2492 Cyg had an RPTF brightness of 19.
We find, in comparison to our subsequent spectra, that:
-
•
On UT 2010 July 14 and 18, V2492 Cyg possessed Br line fluxes of 1.4 and 2.910-14 ergs cm-2 s-1, respectively. This compares to 9 and 2.310-14 ergs cm-2 s-1 on UT October 2 and November 26, respectively. If we equate Br line flux to accretion then we can conclude that in early October 2010, V2492 Cyg had an accretion rate some 3–5 of that in July and November 2010.
-
•
The v=1-0 S(1) H2 emission line at 2.122 m appears to be relatively constant over the period UT 2010 July 14 to November 26. The line flux measured by Covey et al. (2011) and in our spectra was 1, 1.7, 1.3, and 1.510-14 ergs cm-2 s-1, on UT 2010 July 14 and 18, September 5, and November 26, respectively. The v=2-1 S(1) H2 line at 2.2477 m line is detected at three of the four epochs, specifically, July 14 and 18, and November 26. Since it is significantly weaker than the v=1-0 S(1) line this is understandable due to the v=1-0 S(1) line flux being the smallest on UT 2010 October 2. Beck et al. (2007) considered the ratio of certain H2 lines for different sources of excitation131313Fluorescent excitation ratio calculated by Black & van Dishoeck (1987). Shock excitation ratios calculated by Smith (1995). as a diagnostic for the excitation mechanism in effect. The ratio of the v=2-1 S(1)/v=1-0 S(1) was found to be 0.55, 0.05, and 0.24 for UV pumped fluorescent excitation, continuous C-type shock excitation141414C-shocks occur in regions of strong magnetic field which buffer the higher velocity (50 km s-1) continuous shock from dissociating the H2 molecules (Draine & McKee 1993)., and jump J-type shock excitation151515J-shocks show a discontinuous change in density, temperature, and velocity across the shock front and are typically of lower velocity (35 km s-1) which does not dissociate the H2 molecule (Draine & McKee 1993)., respectively. On the three dates the v=2-1 S(1) line was detected, the above ratio was 0.24, 0.33, and 0.19 suggesting that the H2 excitation mechanism is likely to be J-type shocks.
-
•
The flux ratio of Br emission to Na I 2.206 m emission was found by Lorenzetti et al. (2009) and Antoniucci et al. (2008) to be dependent on the type of young star being observed. Covey et al. (2011), used the ratio of these lines to show that for V2492 Cyg, the value was 2 suggesting that the emission in the source was more typical of that from an EXor/jet driving source. Our two epochs of NIR spectroscopy give a ratio of 2.4 and are hence consistent with the values of Covey et al.
5 Discussion
5.1 Pre-Outburst Spectral Energy Distribution
Using the photometry in Table 5 we can construct a pre-outburst SED of V2492 Cyg. This is shown graphically in Figure 18. We have used the Robitaille et al. (2006, 2007) models and on-line SED fitting tool161616At URL: http://caravan.astro.wisc.edu/protostars/ to estimate the contributions to the SED from the stellar photosphere, circumstellar disk, and circumstellar envelope, and to provide insight into their physical nature. As well as specifying the source flux vs. wavelength, the fitting tool also allows one to input a range of distances and interstellar extinctions (AV). We have adopted a distance of 500–600 pc and a possible range of interstellar AV of 0–10 mags. The fitting process produces reasonably good fits to the data, however, it is judicious to note that because of the many free parameters, the model may clearly produce a good fit to the data which is not truly representative of the physical nature of the source. Nevertheless, such a procedure does provide insight into the quiescent nature of the source and hence the SED and model fits are considered below.
The SED of V2492 Cyg (Figure 18) rises steeply from the optical to 3 m where it flattens out to 100 m then declines into the mm-wave regime. Using the above constraint on distance and interstellar extinction, we find that the fitting procedure produces the best-fit parameters shown in Figure 18 as model #3009214 (solid line). This model has a mass, effective temperature, and total luminosity consistent with an intermediate-mass Herbig Ae/Be star i.e. M∗=3.5 M⊙, T∗=13000 K, and Ltot=126 L⊙, respectively. The age of the star is t∗4106 yrs and it has a total (circumstellar + interstellar) extinction of AV=35 mags. However, almost all of this extinction is unrealistically required to be of interstellar origin.
If we place additional constraints on the best-fit procedure, specifically, M2 M∗, the best-fit model #3019063 (dashed line) has M∗=0.7 M⊙, T∗=3850 K, Ltot=14 L⊙, and AV=12 mags. However, the source age for this model is small at t∗2000 yrs. If we additionally constrain t∗ to be between 104 and 107 yrs, the best-fit model #3015948 (dotted line) has M∗=1.9 M⊙, T∗=4350 K, Ltot=30 L⊙, and AV=25 mags. The age of the young star in this model is 1.5105 yrs. Inspection of Figure 18 shows that models #3009214 and #3019063 fit the data reasonably well. However, model #3015948 under-estimates the flux from 5–11 m and over-estimates it from 11–100 m. The full list of the above model values are given in Table 6.
Taking a somewhat different approach, which is the one adopted here, if constrain the interstellar AV component to be 10 mags (as suggested by the JHK c–c diagram) and average the top 20 best-fit models that satisfy this constraint, we obtain the final column of values in Table 6. As can be seen, the top 20 models show free-parameters with, in most cases, reasonable 1 standard deviations. These values are most likely the best we can obtain for V2492 Cyg. The source age is again very small at 2.10.2103 yrs, however, it is calculated from the derived values of stellar radius, temperature, and mass and so are model dependent (B. Whitney 2011, private communication). All we can likely say is that the top 20 AV-constrained models indicate that V2492 Cyg is relatively young.
5.2 Accretion Luminosities and Rates
It is possible to investigate the accretion luminosity, Lacc, and mass accretion rate, Ṁ, using the V-band flux excess, the H FW10% values, and the observed Pa and Br fluxes as we have previously attempted for V1647 Ori (Aspin, Beck & Reipurth 2008) and EX Lup (Aspin et al. 2010). However, the value of AV to adopt in the post-outburst period is critically important to the results obtained. In the JHK c-c diagram (Figure 6a), the location of V2492 Cyg on UT 2010 September 5 (point #4) was close to the upper end of the CTTS locus. This suggests that soon after the outburst occurred, the source was not particularly reddened by overlying extinction. If we deredden its location to a slightly extended CTTS locus (point B), we find A2 mag. This is in contrast to its location in 2006 when it was both highly reddened and possessed a significant K-band thermal excess. On UT 2010 November 25 (point #8), it appears that the overlying extinction had increased with respect to that on October 2. Dereddening to the CTTS locus gives an A7 mags. Since the 1.282 m Pa flux is significantly more affected by extinction than the 2.166 m Br flux, we only use the fluxes from the longer wavelength line below.
Above we noted that the observed Br line fluxes were 9 and 2.310-14 ergs cm-2 s-1 on UT 2010 October 2 and November 26, respectively. Dereddening these values by AV=2 and 7 mags, respectively, gives fluxes of 1.110-13 and 4.710-14 ergs cm-2 s-1 s-1. Following Muzerolle et al. (1998) and Gullbring et al. (1998), we can derive Lacc and Ṁ, however, for this determination we have to adopt values for the parameters M∗ (the mass of the young star), L∗ (the stellar luminosity), T∗ (the star’s effective temperature), and rin (the inner radius of the accretion disk). As we have seen, the SED fitting gave ambiguous results. However, if we adopt the most likely physical nature for V2492 Cyg, that of a young, low-mass T Tauri star, we can constrain the above parameters to be M0.7 M⊙, T4000 K, R5–6 R⊙ and using the standard luminosity, temperature and stellar radius relationship, L7 L⊙. Gullbring et al. (1998) adopted r5 R∗ as a typical value for CTTSs and we also adopt this value. For the UT 2010 October 2 Br flux and an AV=2, we derive Lacc=5.92 L⊙ and Ṁ=1.80.410-6 M⊙ yr-1. For the UT 2010 November 26 Br flux and an AV=7, these values become Lacc=2.00.7 L⊙ and Ṁ=6.30.510-7 M⊙ yr-1. If we perform the same analysis with the Br fluxes from Covey et al. (2011) we obtain Lacc values of 2.10.5 and 5.21.5 L⊙ for UT July 14 and July 18, respectively (using AV=12 mags on both dates). Using the same stellar/disk parameters, these convert to Ṁ rates of 6.41.510-7 and 1.60.510-6 M⊙ yr-1. The above results are shown in tabular form in Table 7. Although the derived values are dependent on the assumed star/disk parameters, using the same values for all four epochs allows us to inter-compare our results. We find that the accretion luminosity and mass accretion rate increases by a factor 2.5 between UT 2010 July 14 and 18, increased still further by a factor 1.1 between UT July 18 and October 2, then declined by a factor 2.9 between UT 2010 October 2 and November 26. If we integrate the accretion rate over the period UT 2010 July 14 to November 26 we obtain a total mass accreted of 210-4 M⊙.
Figure 9 shows that V2492 Cyg has a deconvolved H FW10% of 550 km s-1. Using equation (1) of Natta et al. (2004) we obtain a value for Ṁ of 310-8 M⊙ yr-1. The uncertainties on this value (from Natta et al. equation 1) give a possible range of rates of 610-9 to 110-7 M⊙ yr-1. Even the high end of this range is 10 smaller than the value above derived using the dereddened Br flux.
Despite the significant uncertainties of the above analysis, we can conclude that the above estimates of Ṁ for V2492 Cyg during outburst are considerably lower than the expected values in a FUor eruption e.g. 10-5 to 10-4 M⊙ yr-1. We find, therefore, that the outburst of V2492 Cyg seems more consistent with those observed in EXors than in FUors.
5.3 Indicators of Outflow and Stellar/Disk Winds
As discussed by Covey et al. (2011), Hartigan, Edwards, & Ghandour (1995) presented a relationship between mass-loss rate and the luminosity of certain forbidden optical emission lines related to shock-excitation by outflowing gas. Using their equations A8 and A10, Covey et al. estimated the mass outflow rate, Ṁwind, to be 710-7 and 210-6 M⊙ yr-1 from the 6716 Å [S II] line and the 6300 Å [O I] line, respectively. Stressing the large uncertainties in these values due to the assumed values for visual extinction and the physical properties of the shock region, they nonetheless showed that significant mass outflow is occurring during periods of intense mass accretion. Using both the [O I] line fluxes from Covey et al. (2011) and or own from TableV2492 CYGNI: THE EARLY EVOLUTION OF THE 2010 OUTBURST, we have re-calculated mass-loss rates using a standard set of input parameters. The only quantity we have varied between epochs is the overlying visual extinction. This we estimated from the JHK c-c diagram shown in Figure6a. Table 8 shows the estimated mass loss-rates for the four epochs for which [O I] emission line fluxes are available. We only use the [O I] line here since it is stronger than the [S II] lines present and, hence, the fluxes are considered more reliable. For all calculations, we assume values for the electron density, Ne, equal to the [O I] critical density, Nc=1.97106 cm-3, the projected size of the aperture on the plane of the sky, lperp=2.621015 cm (corresponding to 03 at 600 pc), and the wind velocity component in the plane of the sky, vperp=150 km s-1. We note that Ṁwind scales as (1+Nc/Ne), l, and v. For the observed [O I] fluxes and assumed values of AV, we estimate mass-loss rates of 1–210-6 M⊙ yr-1 in July 2010 dropping very significantly to 2–310-9 M⊙ yr-1 in September 2010, and increasing to 410-8 M⊙ yr-1 in November 2010. Clearly, these values are highly uncertain and evidently dependent on the assumed AV value. However, the overall trend indicates that the mass-loss rate in the wind was highest in July 2010 (RPTF=15.7), prior to the September peak in optical brightness, then declined by three orders of magnitude at the time of the September 2010 brightness peak (RPTF=13.6), and then increased by a factor 10 as the source faded back to a more quiescent-like optical brightness in November 2010 (RPTF=18.0). This behavior is somewhat peculiar since the expectation would more likely be that the mass-loss rate would increase significantly immediately after the dramatic increase in brightness occurred.
6 Summary
What we have learned about the young star V2492 Cyg is summarized below.
-
1.
The outburst of V2492 Cyg appears to be more representative of those occurring in EXor rather than FUor variables. Its optical and NIR emission line spectra and shorter timescale brightness variations are much more like those found in EX Lup and VY Tau than in any of the classical FUors or FUor-like objects.
-
2.
Based on Spitzer c-c diagrams, V2492 Cyg is designated a Class I protostar consistent with the evolutionary state determined by Covey et al. (2011).
-
3.
Although it is not clear when precisely the outburst in V2492 Cyg began, we can obtain a timeline, albeit incomplete, of events by utilizing the light-curve of Covey et al. (2011) together with our Figure 5. In quiescence, V2492 Cyg appears to be optically faint with an R-band magnitude of 18–19. The source had such a brightness in the USNO-B1 survey from 1979.9 and in September and October 2009 (Covey et al. 2011). However, rather than being relatively constant in optical brightness in quiescence, some small-scale variability seems to be present (hence the above quiescent magnitude range). For example, Itagaki (2010) presented photometry from UT 2009 May 7 which showed V2492 Cyg had an unfiltered optical magnitude of 15.4. This corresponds to R15.8 (see Figure 5 for a comparison of unfiltered to R-band photometry). At some time between UT 2009 October 25 (the last 2009 point from Covey et al. (2011) and UT 2009 December 19 (the first of the Itagaki 2010 points shown in Figure 5) the current activity period began.
-
4.
A significant fraction of the total change in optical and NIR brightness is likely due to the disappearance and re-formation of dust along our line-of-sight. Although the changes in NIR colors do not correspond well to those expected from previously used extinction laws, the more or less linear (in log10–space) change in location of V2492 Cyg in a JHK c-c diagram strongly suggests that extinction variations are the dominant factor. Dust sublimation and re-formation have been previously observed in the eruptive variable V1647 Ori; the dust is sublimated by an accretion burst and then re-forms as the accretion process returns to a more stable state.
-
5.
During the outburst, V2492 Cyg developed a strong stellar/disk wind seen as blue-shifted absorption on several strong emission lines. For example, on UT 2010 September 5 both H and the far-red Ca II triplet lines showed velocities of –200 km s-1 in the sub-continuum blue-shifted absorption minimum. Between that date and UT 2010 November 26, the velocity of the minimum absorption trough on two of the Ca II triplet lines reduced to 125 km s-1 (this trough disappeared on the other Ca II line) while the sub-continuum absorption in H became a low-velocity absorption on the blue-wing of the emission profile. An emission line typically associated with mass-loss is the 6300 Å [O I] line. The dereddened [O I] line fluxes suggest that the star/disk wind was strongest prior to the September 2010 brightness peak. At the time of the September 2010 maximum, it had declined by three orders of magnitude but then increased in strength by a factor 10 some 3 months later.
-
6.
The NIR CO overtone bandhead emission from UT 2010 October 2 indicates that the emitting region has a temperature, T3200 K, is somewhat optically thick, and has a Gaussian velocity dispersion, v55 km s-1. Approximately two months later, both TCO and vg had increased to 4200 K and 85 km s-1, respectively. This is consistent with the buildup of gaseous, circumstellar material closer to the star as the eruption subsides. The lack of evidence for this gaseous material being in the form of a circumstellar disk either suggests that the emitting region is located elsewhere, perhaps in accretion funnels, or that the disk is viewed either relatively face-on or partly obscured from directly view. For a 0.7 M⊙ central star with a Keplerian disk, velocities of 55 and 85 km s-1 correspond orbital radii of 0.2 and 0.09 AU, respectively.
-
7.
Optical (e.g. [S II]) and NIR (e.g. H2) shock-excited emission lines were present in the earliest Covey et al. (2011) spectrum from UT 2010 July 14, absent (or very weak) in our UT 2010 September 5 spectrum, and present again in our most recent spectrum from UT 2010 November 25. There is no evidence as to the origin of these lines but possibilities include shocks associated with the accretion flow or those created by outflowing gas such as in a collimated Herbig-Haro flow. We cannot distinguish between these mechanisms at this time.
-
8.
The pre-outburst SED of V2492 Cyg has been fitted using the model SEDs of Robitaille et al. (2006, 2007). The best fits indicate that the star is at a very young evolutionary stage and is of low-mass with M0.5 M⊙, T3600 K, L20 L⊙, and R7 R⊙. Due to its age, the star still possesses a significant circumstellar envelope (M0.02 M⊙) and disk (M0.01 M⊙). All indications are that it is still in the Class I protostar phase.
-
9.
From an analysis of the Br line fluxes from Covey et al. (2011) and from our spectra, we find that the accretion luminosity and rate fall in the ranges Lacc=1–6 L⊙ and Ṁ=0.4–610-6 M⊙ yr-1, respectively. Although these values depend on the assumed AV at the time of observations, we can say with reasonable confidence that these accretion parameter values are significantly lower than found in FUors/FUor-like objects and more like those occurring in EXor outbursts.
It remains to be seen how V2492 Cyg evolves and whether it continues to exhibit short-timescale variability or returns to a more quiescent state. Nevertheless, our conclusion is that it appears to be another example of an EXor variable similar in nature to EX Lup although apparently significantly younger. Continuous optical monitoring of the star by the AAVSO observers will clearly greatly assist in a better understanding of this enigmatic young stellar object.
Acknowledgments We are extremely grateful to the referee, Barbara Whitney, for many useful comments on the manuscript, in particular, on the interpretation of the best-fit SED models. We wish to express our sincere thanks to Nancy Levinson for allocating the Director’s time used to obtain our GMOS-N, NIRI, and NIFS Gemini-North observations. We are grateful to the AAVSO and their dedicated observers who continue to provide high quality optical photometry of V2492 Cyg. We are pleased to acknowledge Kevin Covey for valuable discussions and providing some additional information on his recent paper and on the source itself. We thanks Bo Reipurth for useful discussions and critical reading of the manuscript. This project was supported by the Gemini Observatory, which is operated by the Association of Universities for Research in Astronomy, Inc., on behalf of the international Gemini partnership of Argentina, Australia, Brazil, Canada, Chile, the UK, and the US. This work is based in part on data obtained as part of the UKIRT Infrared Deep Sky Survey. This publication makes use of data products from the Two Micron All Sky Survey, which is a joint project of the University of Massachusetts and the Infrared Processing and Analysis Center/California Institute of Technology, funded by the National Aeronautics and Space Administration and the National Science Foundation. This work is based in part on observations made with the Spitzer Space Telescope, which is operated by the Jet Propulsion Laboratory, California Institute of Technology under a contract with NASA. Support for this work was provided by NASA through an award issued by JPL/Caltech. This research is based in part on observations with AKARI, a JAXA project with the participation of ESA.
References
- (1) Allen, L.E. et al. (2002) ApJ, 566, 993
- (2) Ambartsumian, V.A. 1971, Astrophysics, 7, 331
- (3) Aspin, C., Reipurth, B., Herczeg, G.J. & Capak, P., 2010, ApJ, 719, 50
- (4) Aspin, C., Beck, T.L., & Reipurth, B. 2008, AJ, 135, 423
- (5) Aspin, C., & Reipurth, B. 2009, AJ, 138, 1137
- (6) Bally, J. & Reipurth, B. 2003, AJ, 126, 893
- (7) Briceno, C. et al. 2004, ApJ, 606, L123
- (8) Covey, K. et al. 2011, in press
- (9) Davies, R.L. et al. 1997, SPIE, 2871, 1099
- (10) Dobashi, K. et al. 2005, PASJ, 57, S1
- (11) Draine, B.T. & McKee, C.F. 1993, ARA&A, 31, 373
- (12) Greene, T.P. & Meyer, P. 1995, ApJ, 450, 233
- (13) Gutermuth, R.A., Megeath, S.T., Muzerolle, J., et al. 2004, ApJS, 154, 374
- (14) Gutermuth, R.A., Myers, P.C., Megeath, S.T., et al. 2008, ApJ, 674, 336
- (15) Hartmann, L., & Kenyon, S.J. 1985, ApJ, 299, 462
- (16) Hartmann, L. & Kenyon, S.J. 1996, ARAA, 34, 207
- (17) Herbig, G.H. 1966, Vistas in Astronomy, 8, 109
- (18) Herbig, G.H. 1977, ApJ, 217, 693
- (19) Herbig, G.H. 1989, in ESO Workshop on Low Mass Star Formation and Pre-Main Sequence Objects, ed. B. Reipurth, p. 233
- (20) Herbig, G.H. 1990, ApJ, 360, 639
- (21) Herbig, G.H. 2008, AJ, 135, 637
- (22) Herbig, G.H. & Harlan, E.A. 1971, IBVS, 543
- (23) Herbig, G.H., Petrov, P.P., & Duemmler, R. 2003, ApJ, 595, 384
- (24) Hodapp, K.-W. et al. 2003, PASP, 115, 1388
- (25) Hook, I., Jorgensen, I., Allington-Smith, J.R., Davies, R.L., Metcalfe, N., Murowinski, R.G., & Crampton, D. 2004, PASP, 116, 425
- (26) Itagaki, K. 2010, CBET, 2426
- (27) Laugalys, V. et al. 2006, Baltic Astron., 15, 483
- (28) Lawrence, A., et al. 2007, MNRAS, 379, 1599
- (29) Meinunger, L. 1969, Mitt. über Veränderlichen Sterne, 5, 47
- (30) McGregor, P.J. et al. 2003, SPIE, 4841.1581
- (31) Murakami, H., Baba, H., & Barthel, P., et al. 2007, PASJ, 59, 369
- (32) Osorio, M., D’Alessio, P., Muzerolle, J., Calvet, N., & Hartmann, L. 2003, RevMexAA (Serie de Conferencias) 15, 142
- (33) Petrov, P.P. & Herbig, G.H. 1992, ApJ, 392, 209
- (34) Petrov, P.P. & Herbig, G.H. 2008, AJ, 136, 676
- (35) Reipurth, B. & Schneider, N. 2008, in Handbook of Star Forming Regions Vol. I, ed. B. Reipurth, ASP, p. 36
- (36) Reipurth, B. & Aspin, C. 2004, ApJ, 606, L119
- (37) Robitaille, T.P., Whitney, B.A., Indebetouw, R., Wood, K., & Denzmore, P. 2006, ApJS, 167, 256
- (38) Robitaille, T.P., Whitney, B.A., Indebetouw, R., & Wood, K. 2007, ApJS, 169, 328
- (39) Semkov, E. & Peneva, S. 2010a, ATel, 2801
- (40) Semkov, E. & Peneva, S. 2010b, ATel, 2819
- (41) Skrutskie, M.F. et al. 2006, AJ, 131, 1163
- (42) Wachmann, A.A. 1954, Zs. f. Ap. 35, 74
- (43) Welin, G. 1971, A&A, 12, 312
- (44) Whitney, B.A., Kenyon, S.J., & Gomez, M. 1997, ApJ, 485, 703
| UT Date | JD | Telescope/ | Details |
|---|---|---|---|
| Instrument | |||
| 2010 Sep 5 | 2455445 | Gemini-N/GMOS | r’ imaging |
| 2010 Sep 5 | 2455445 | Gemini-N/GMOS | B600 spectroscopy |
| 2010 Sep 5 | 2455445 | Gemini-N/NIRI | J,H,K’,L’ photometry |
| 2010 Oct 2 | 2455472 | Gemini-N/NIFS | K-band spectroscopy |
| 2010 Oct 3 | 2455473 | Gemini-N/NIFS | J,H spectroscopy |
| 2010 Nov 25 | 2455525 | Gemini-N/GMOS | B600 spectroscopy |
| 2010 Nov 25 | 2455525 | Gemini-N/NIRI | J,H,K’,L’ photometry |
| 2010 Nov 26 | 2455526 | Gemini-N/NIFS | K-band spectroscopy |
| 2010 Nov 27 | 2455527 | Gemini-N/NIFS | H-band spectroscopy |
| Filter | 2000/06/10 | 2006/06/10 | 2010/09/05 | 2010/11/25 |
|---|---|---|---|---|
| (2MASS) | (UKIDSS) | (Gemini) | (Gemini) | |
| J | 15.8 | 19.400.09 | 10.580.1 | 13.130.1 |
| H | 15.1 | 16.550.02 | 9.330.1 | 11.450.1 |
| K’ | 14.3 | 13.150.01 | 8.120.1 | 9.630.1 |
| L/L’ | – | – | 5.360.1 | 6.050.1 |
| J-H | – | 2.850.09 | 1.250.14 | 1.680.14 |
| H-K’ | – | 3.400.02 | 1.210.14 | 1.820.14 |
| K’-L’ | – | – | 2.760.14 | 3.580.14 |
| Line | EWaaEquivalent widths have associated uncertainties of 0.2 Å. | Line Flux | Continuum | EWaaEquivalent widths have associated uncertainties of 0.2 Å. | Line Flux | Continuum | |
|---|---|---|---|---|---|---|---|
| (Å) | (Å) | (ergs cm-2 s-1) | (ergs cm-2 s-1 Å-1) | (Å) | (ergs cm-2 s-1) | (ergs cm-2 s-1 Å-1) | |
| 05 September 2010 | 25 November 2010 | ||||||
| Fe I | 6136 | –1.5 | 1.53(–14)bbNumber in parentheses is exponent e.g. 1.53(–14) means 1.5310-14. | 1.02(–14) | –2.4 | 2.64(–16) | 1.10(–16) |
| Fe II | 6148 | –1.0 | 1.03(–14) | 1.03(–14) | –0.9 | 1.01(–16) | 1.12(–16) |
| Fe I | 6192 | –0.8 | 8.53(–15) | 1.07(–14) | –1.0 | 1.19(–16) | 1.19(–16) |
| Fe II | 6238 | –0.9 | 9.84(–15) | 1.09(–14) | –1.6 | 1.99(–16) | 1.24(–16) |
| Fe II | 6247 | –0.8 | 8.78(–15) | 1.10(–14) | –1.1 | 1.37(–16) | 1.25(–16) |
| O I | 6300 | –1.3 | 1.44(–14) | 1.11(–14) | –38.9 | 4.94(–15) | 1.27(–16) |
| O I | 6364 | –0.6 | 6.77(–15) | 1.13(–14) | –13.3 | 1.72(–15) | 1.30(–16) |
| Fe I | 6393 | –0.7 | 8.02(–15) | 1.15(–14) | –1.7 | 2.24(–16) | 1.32(–16) |
| Fe I | 6399 | –0.7 | 8.05(–15) | 1.15(–14) | –1.5 | 1.99(–16) | 1.33(–16) |
| Fe II | 6433 | –2.3 | 2.73(–14) | 1.19(–14) | –3.1 | 4.27(–16) | 1.38(–16) |
| Ca II/Fe IIccIndicates blended line. | 6456 | –0.8 | 9.74(–15) | 1.22(–14) | –1.5 | 2.14(–16) | 1.43(–16) |
| Fe I | 6496 | –0.9 | 1.16(–14) | 1.28(–14) | –2.4 | 3.66(–16) | 1.52(–16) |
| Fe II | 6516 | –2.6 | 3.43(–14) | 1.32(–14) | –3.6 | 5.68(–16) | 1.58(–16) |
| N II | 6548 | –0.7 | 9.61(–15) | 1.37(–14) | –1.3 | 2.16(–16) | 1.66(–16) |
| H | 6563 | –16.3 | 2.28(–13) | 1.40(–14) | –27.6 | 4.68(–15) | 1.70(–16) |
| N II | 6592 | –1.2 | 1.72(–14) | 1.44(–14) | –2.0 | 3.52(–16) | 1.76(–16) |
| Fe I | 6664 | …dd… means line not present. | … | … | –1.0 | 1.84(–16) | 1.84(–16) |
| Fe I | 6677 | –0.8 | 1.19(–14) | 1.48(–14) | –1.3 | 2.39(–16) | 1.84(–16) |
| S II | 6716 | … | … | … | –2.8 | 5.15(–16) | 1.84(–16) |
| S II | 6731 | … | … | … | –5.1 | 9.37(–16) | 1.84(–16) |
| Fe II | 7155 | … | … | … | –8.4 | 2.40(–15) | 2.86(–16) |
| Fe II | 7169 | … | … | … | –2.2 | 6.39(–16) | 2.90(–16) |
| Ca II | 7291 | –1.5 | 2.90(–14) | 1.93(–14) | –2.2 | 6.75(–16) | 3.07(–16) |
| Fe II | 7308 | –0.6 | 1.15(–14) | 1.91(–14) | –1.0 | 3.06(–16) | 3.06(–16) |
| Ca II | 7324 | –0.9 | 1.70(–14) | 1.89(–14) | –2.2 | 6.73(–16) | 3.06(–16) |
| Na I?eeQuestion mark indicates uncertain identification with strongest/most likely line listed. | 7374 | … | … | … | –2.8 | 8.47(–16) | 3.03(–16) |
| Fe II | 7388 | –0.8 | 1.47(–14) | 1.84(–14) | –2.3 | 6.94(–16) | 3.02(–16) |
| Si I?eeQuestion mark indicates uncertain identification with strongest/most likely line listed. | 7409 | … | … | … | –1.3 | 3.91(–16) | 3.01(–16) |
| Fe II | 7448 | –0.6 | 1.11(–14) | 1.85(–14) | –3.6 | 1.08(–15) | 3.00(–16) |
| Fe II | 7461 | –1.2 | 2.23(–14) | 1.86(–14) | –1.2 | 3.61(–16) | 3.01(–16) |
| Fe I | 7618 | … | … | … | –4.1 | 1.41(–15) | 3.43(–16) |
| K I | 7665 | +3.8 | 8.58(–14) | 2.26(–14) | +4.3 | 1.59(–15) | 3.70(–16) |
| K I | 7699 | +2.7 | 6.33(–14) | 2.34(–14) | +3.2 | 1.25(–15) | 3.91(–16) |
| Fe II | 7711 | –1.9 | 4.51(–14) | 2.37(–14) | –2.4 | 9.56(–16) | 3.98(–16) |
| O IffUnresolved triplet. | 7774 | +3.3 | 8.26(–14) | 2.50(–14) | +1.9 | 8.17(–16) | 4.30(–16) |
| Fe I | 7998 | … | … | … | –1.1 | 4.83(–16) | 4.39(–16) |
| Fe I | 8046 | –0.9 | 2.20(–14) | 2.45(–14) | –1.2 | 5.13(–16) | 4.28(–16) |
| Fe I | 8219 | –0.6 | 1.50(–14) | 2.50(–14) | –1.1 | 4.93(–16) | 4.48(–16) |
| Fe I | 8327 | –1.4 | 3.97(–14) | 2.84(–14) | –2.9 | 1.52(–15) | 5.23(–16) |
| H I (Pa 24) | 8334 | … | … | … | –1.1 | 5.81(–16) | 5.28(–16) |
| Fe I | 8388 | –2.7 | 8.19(–14) | 3.03(–14) | –4.3 | 2.43(–15) | 5.66(–16) |
| H I (Pa 18) | 8435 | –0.8 | 2.53(–14) | 3.16(–14) | –1.5 | 8.93(–16) | 5.96(–16) |
| O I | 8446 | +1.0 | 3.19(–14) | 3.19(–14) | … | … | … |
| Fe II | 8448 | … | … | … | –1.2 | 7.24(–16) | 6.03(–16) |
| H I (Pa 17) | 8467 | –1.1 | 3.56(–14) | 3.24(–14) | –1.8 | 1.11(–15) | 6.14(–16) |
| Ca II | 8498 | –15.4 | 5.08(–13) | 3.30(–14) | –15.6 | 9.83(–15) | 6.30(–16) |
| Fe I | 8514 | –2.1 | 6.98(–14) | 3.32(–14) | –2.9 | 1.85(–15) | 6.38(–16) |
| Ca II | 8543 | –13.6 | 4.57(–13) | 3.36(–14) | –12.6 | 8.20(–15) | 6.51(–16) |
| Fe I | 8611 | –0.8 | 2.73(–14) | 3.41(–14) | –4.3 | 2.91(–15) | 6.76(–16) |
| Ca II/Fe IccIndicates blended line. | 8662 | –10.5 | 3.58(–13) | 3.41(–14) | –9.6 | 6.59(–15) | 6.87(–16) |
| Fe I | 8674 | –1.2 | 4.08(–14) | 3.40(–14) | –1.4 | 9.63(–16) | 6.88(–16) |
| Fe I | 8689 | –2.1 | 7.13(–14) | 3.39(–14) | –2.8 | 1.93(–15) | 6.89(–16) |
| Mg I | 8807 | –3.6 | 1.18(–13) | 3.27(–14) | –3.6 | 2.42(–15) | 6.73(–16) |
| Fe I | 8824 | –2.1 | 6.82(–14) | 3.25(–14) | –3.4 | 2.28(–15) | 6.72(–16) |
| Fe I | 8838 | –1.1 | 3.55(–14) | 3.23(–14) | –1.2 | 8.05(–16) | 6.71(–16) |
| Wavelength | Origin | Epoch | Flux |
|---|---|---|---|
| (m) | of Flux | of Flux | (mJy) |
| 1.25 | UKIDSS | 2006.7 | 0.030.003 |
| 1.65 | UKIDSS | 2006.7 | 0.250.025 |
| 2.20 | UKIDSS | 2006.7 | 3.80.38 |
| 3.6 | Spitzer/IRAC | 2006.6 | 747 |
| 4.5 | Spitzer/IRAC | 2006.6 | 15816 |
| 5.6 | Spitzer/IRAC | 2006.6 | 65365 |
| 8.0 | Spitzer/IRAC | 2006.6 | 1200120 |
| 9.0 | AKARI/IRC | 2006.6 | 1960200 |
| 18.0 | AKARI/IRC | 2006.6 | 3875457 |
| 24.0 | Spitzer/MIPS | 2006.6 | 3402340 |
| 70.0 | Spitzer/MIPS | 2006.6 | 5880588 |
| 1100.0 | Bolocam GPS | 2009.4 | 14874 |
| Additional Photometry | |||
| 8.28 | MSX6C | 1996.6 | 161066 |
| 12.0 | IRAS | 1983 | 3390330 |
| 12.13 | MSX6C | 1996.6 | 2490137 |
| 14.65 | MSX6C | 1996.6 | 3045189 |
| 21.34 | MSX6C | 1996.6 | 3140201 |
| 25.0 | IRAS | 1983 | 6590660 |
| 60.0 | IRAS | 1983 | 278901000 |
| 100.0 | IRAS | 1983 | 573501000 |
| Parameter | Units | Best-FitaaEquivalent widths have associated uncertainties of 0.2 Å. | Best-FitbbNumber in parentheses is exponent e.g. 1.53(–14) means 1.5310-14. | Best-Fitccna means data not available. | Best-Fitdd… means line not present. |
|---|---|---|---|---|---|
| Name | Value | Value | Value | Value | |
| Model # | 3009214 | 3019063 | 3015948 | Top 20 | |
| 274 | 602 | 1519 | 79514 | ||
| Mass | (M⊙) | 3.5 | 0.7 | 1.9 | 0.520.43 |
| Temperature | (K) | 13000 | 3800 | 4400 | 358085 |
| Age | (yrs) | 4106 | 1.6103 | 1.5105 | 2.10.2103 |
| R∗eeLine included even though it has an EW 1 Å since it is useful for comparative purposes. | (R⊙) | 2 | 9 | 10 | 6.90.3 |
| LtotffEW measured from 2.2930–2.3000 m. | (L⊙) | 126 | 14 | 30 | 172 |
| Distance | (pc) | 500 | 500 | 500 | 5218 |
| InclinationggRequired disk inclination with respect to the line-of-sight. | (degs) | 31.8 | 31.8 | 31.8 | 503 |
| ṀenvhhMass accretion rate from envelope to disk. | (M⊙ yr-1) | 0 | 410-6 | 310-5 | 3.60.310-6 |
| ṀdiskiiMass accretion rate from disk to stellar surface. | (M⊙ yr-1) | 810-8 | 910-8 | 310-9 | 5.21.110-6 |
| AV(int)jjVisual extinction not associated with circumstellar disk and envelope. | (mags) | 35 | 12 | 25 | 70.5 |
| AV(cir)kkVisual extinction from circumstellar disk and envelope. | (mags) | 0 | 57 | 26 | 968 |
| MenvllEnvelope mass. | (M⊙) | 810-9 | 110-2 | 410-1 | 1.80.210-2 |
| MdiskmmDisk mass. | (M⊙) | 610-3 | 110-2 | 810-4 | 8.41.310-3 |
| UT Date | Flux (observed)aaUnconstrained best-fit values. | AVbbBest-fit values constraining M2 M⊙. | Flux (dereddened)ccBest-fit values constraining M2 M⊙ and age between 105 and 107 yrs. | LaccddValues obtained from averaging the top 20 best-fit models with AV(interstellar)10 mags. | ṀacceeRadius of star. |
|---|---|---|---|---|---|
| (ergs cm-2 s-1) | (mags) | (ergs cm-2 s-1) | (L⊙) | (M⊙ yr-1) | |
| 2010 July 14ffTotal luminosity = star+accretion luminosities. | 1.4(–14)ggNumber in parentheses is exponent e.g. 1.4(–14) means 1.410-14. | 12 | 4.8(–14) | 2.1 | 6.4(–7) |
| 2010 July 18ffFrom Covey et al. (2011). | 2.9(–14) | 12 | 1.0(–13) | 5.2 | 1.6(–6) |
| 2010 October 2 | 9.0(–14) | 2 | 1.1(–13) | 5.9 | 1.8(–6) |
| 2010 November 26 | 2.3(–14) | 7 | 4.7(–14) | 2.0 | 6.3(–7) |
| UT Date | Flux | AVaaObserved Br emission line flux. | L6300(observed)bbVisual extinction from JHK c-c diagram. | L6300(dereddened)ccDereddened Br emission line flux. | Ṁwind |
|---|---|---|---|---|---|
| (ergs cm-2 s-1) | (mags) | (L⊙) | (L⊙) | (M⊙ yr-1) | |
| 2010 July 8ddAccretion luminosity. | 5.5(–15)eeAccretion rate. | 12 | 6.2(–5) | 4.4(–1) | 1.6(–6) |
| 2010 July 19ddFrom Covey et al. (2011). | 4.0(–15) | 12 | 4.5(–5) | 3.3(–1) | 1.1(–6) |
| 2010 September 5 | 1.4(–14) | 2 | 1.6(–4) | 7.1(–4) | 2.5(–9) |
| 2010 November 25 | 4.9(–15) | 7 | 5.5(–5) | 1.0(–2) | 3.4(–8) |