Molecular CO(1-0) gas in the radio galaxy MRC 0152-209
Abstract
We report the detection of molecular CO(1-0) gas in the high- radio galaxy MRC 0152-209 () with the Australia Telescope Compact Array Broadband Backend (ATCA/CABB). This is the third known detection of CO(1-0) in a high- radio galaxy to date. CO(1-0) is the most robust tracer of the overall molecular gas content (including the wide-spread, low-density and subthermally excited component), hence observations of CO(1-0) are crucial for studying galaxy evolution in the Early Universe. We derive for MRC 0152-209, which is comparable to that derived from CO(1-0) observations of several high- submillimeter and starforming galaxies. The CO(1-0) traces a total molecular hydrogen mass of M (/0.8) M⊙. MRC 0152-209 is an infra-red bright radio galaxy, in which a large reservoir of cold molecular gas has not (yet) been depleted by star formation or radio source feedback. Its compact radio source is reliably detected at 40 GHz and has a steep spectral index of between 1.4 and 40 GHz ( GHz in the galaxy’s rest-frame). MRC 0152-209 is part of an ongoing systematic ATCA/CABB survey of CO(1-0) in high- radio galaxies between .
1 Introduction
High-redshift radio galaxies (HzRGs; W Hz-1) are among the most massive galaxies in the early Universe (Miley & De Breuck, 2008). They are typically surrounded by rich proto-cluster environments and are believed to be the ancestors of early-type central-cluster galaxies (e.g. Venemans et al., 2007). HzRGs are in an active stage of their evolution, with powerful radio jets emanating from a massive central black-hole. These radio jets vigorously interact with their surrounding environment (e.g. Humphrey et al., 2006) and serve as beacons for tracing the faint host galaxy and surrounding proto-cluster. This makes HzRGs among the best studied high- objects and ideal laboratories for investigating both the formation and evolution of galaxies/clusters as well as the relationship between early star formation and AGN activity.
A crucial component in the evolutionary studies of HzRGs and their associated star formation processes is a detailed knowledge about the content and properties of the molecular gas. The most abundant molecule, molecular hydrogen or H2, has strongly forbidden rotational transitions and is virtually invisible, except when it is shocked or heated to high temperatures. An excellent tracer for H2 gas is carbon monoxide or CO, which emits strong rotational transition lines that occur primarily through collisions with H2, even at relatively low densities (e.g. Solomon & Vanden Bout, 2005). Brown & Vanden Bout (1991) were the first to observe 12CO (referred to as CO in this paper) beyond .
During that same decade, intensive searches failed to detect CO in HzRGs (Evans et al., 1996; van Ojik et al., 1997a). Since then, CO emission has been detected in individual studies of powerful radio galaxies between (see reviews by Solomon & Vanden Bout, 2005; Miley & De Breuck, 2008, and Sect. 4.2 for individual references). In some cases the CO has been resolved on scales of several tens of kpc (e.g. Papadopoulos et al., 2000).
Despite these results, two major limitations to systematic searches for CO in HzRGs have been the very limited velocity coverage of existing mm-spectrometers (often not much wider than the velocity range of the CO gas and/or the accuracy of the redshift) and the fact that most observatories can only target the higher rotational transitions of CO at high-. While these higher CO transitions trace the dense and thermally excited gas (such as that in the nuclear starburst/AGN region), Papadopoulos et al. (2000, 2001) suggest that more widely distributed reservoirs of less dense and sub-thermally excited gas could be largely missed by these observations and could thus more easily be detected in the lower transitions than often assumed (see also e.g. Dannerbauer et al., 2009; Carilli et al., 2010; Ivison et al., 2011, and references therein). The luminosity of the ground transition, CO(1-0), is least affected by the excitation conditions of the gas. Therefore, observations of CO(1-0) are crucial for deriving the most accurate estimates of the overall molecular gas content in high- galaxies.
Ongoing developments in broadband correlators are overcoming the above mentioned limitations. As we discussed in Emonts et al. (2011), the upgrade of the Australia Telescope Compact Array (ATCA) with the GHz Compact Array Broadband Backend (CABB; Wilson et al., 2011) now allows searching for CO(1-0) across the southern hemisphere. We are currently in the process of observing an unbiased sample of HzRGs from the Molonglo Reference Catalogue (McCarthy et al., 1990) in CO(1-0) with the ATCA/CABB 7mm system between .
In this Letter, we present the detection of CO(1-0) emission in one of our sample sources, MRC 0152-209 (=). MRC 0152-209 is a radio galaxy with a disturbed optical morphology (Pentericci et al., 2001). It is bright in the near- and mid-IR (Seymour et al., 2007; De Breuck et al., 2010), detected in Ly (McCarthy et al., 1991) and has a compact radio source (1.6 arcsec/13 kpc in diameter; Pentericci et al., 2000).
Throughout this paper, we assume H km s-1 Mpc-1, and , corresponding to an angular distance scale of 8.3 kpc arcsec-1 and luminosity distance Mpc for MRC 0152-209 (following Wright, 2006).111See http://www.astro.ucla.edu/wright/CosmoCalc.html
2 Observations
MRC 0152-209 was observed on 25 26 August and 28 29 September 2010 with ATCA/CABB in the most compact hybrid H168 and H75 array configurations. The total effective on-source integration time was 15.5h (with 45 of our overall observing time spent on overheads and calibration). We used the coarsest spectral-line CABB mode ( GHz bandwidth; 1 MHz resolution) and centered both 2 GHz observing bands around 39.476 GHz222The actual central frequency of the bands was chosen to be 39.9 GHz, because channels were missing in the first half of each band at the time of our observations. Only one of the observing bands was used in the final data analysis (see also Emonts et al., 2011)., the frequency that corresponds to the CO(1-0) line ( GHz) Doppler-shifted to . We observed only above 30∘ elevation and during atmospheric conditions in which there was no significant phase decorrelation of the signal, with T during the various runs. Short (2 min) scans were made on the nearby strong calibrator PKS B0130-171 ( Jy beam-1) roughly every 10 minutes in order to derive frequent gain- and bandpass-calibration solutions, both of which were interpolated in time and applied to the data of MRC 0152-209. We observed Uranus when it was at roughly the same elevation as PKS B0130-171 in order to flux calibrate our data with an accuracy of 30. Details on the calibration strategy (using miriad) and flux calibration uncertainties are described in Emonts et al. (2011).
We used multi-frequency synthesis to obtain a continuum image (with ; Briggs, 1995), which we subsequently cleaned. We then separated the spectral-line from the continuum data with a linear fit to the line-free channels in the uv-domain before Fourier transforming the data into a line-data cube (). The velocity axis was translated to match the optical barycentric rest-frame velocity at the redshift of MRC 0152-209 (; De Breuck et al., 2000). The spatial resolution of our final data is arcsec (PA = 89.8∘), with a velocity resolution in the line data of 7.6 km s-1 per 1 MHz channel at 39.476 GHz across an effective velocity range of 15000 km s-1. The noise is 58 Jy beam-1 in the continuum image and 0.47 mJy beam-1 per 1 MHz channel in the line data. For the data analysis presented in this paper we have binned the line data to 40 km s-1 wide channels and subsequently applied a hanning smooth, resulting in an effective velocity resolution of 80 km s-1 and a noise level of = 0.16 mJy beam-1 chan-1.
3 Results
3.1 CO(1-0)
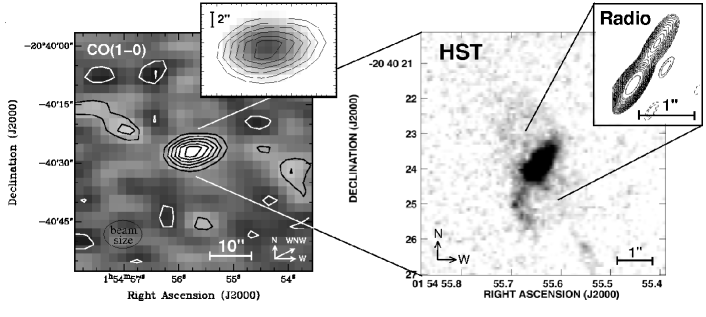
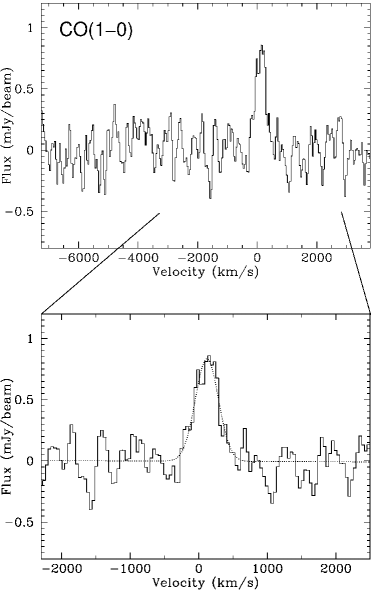
Figure 1 shows the spectrum of CO(1-0) against the central region of MRC 0152-209. From fitting a Gaussian to this profile, we derive that the CO(1-0) signal has a peak flux density of mJy beam-1 333The error reflects the accuracy of the flux calibration (Sect. 2) and km s-1. The CO(1-0) signal peaks at a redshift of , in agreement with the optical redshift of (McCarthy et al., 1991; De Breuck et al., 2000). Figure 2 (left) shows a total intensity map of the CO(1-0) line integrated over the channels in which the line was detected. The integrated CO(1-0) signal is detected at the 8 level and Jy beam-1 km s-1. There is a tentative indication from Figure 2 (left) that the CO(1-0) emission is marginally resolved in west-north-western (WNW) direction. This would mean that the CO(1-0) gas is distributed on scales larger than the major beam axis, which corresponds to 81 kpc. Observations at higher spatial resolution are in progress to verify this.
The CO(1-0) emission-line luminosity can be calculated following Solomon & Vanden Bout (2005, and references therein):
| (1) |
with expressed in . For MRC 0152-209, .
3.2 Radio continuum
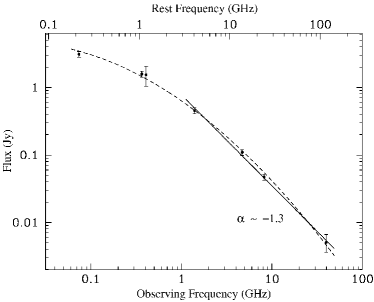
The radio continuum emission of MRC 0152-209 is unresolved in our ATCA observations and has a flux of mJy. Using our 40 GHz flux and 8.2, 4.7 and 1.4 GHz data from Pentericci et al. (2000), the spectral index can be fitted with a power-law of the form from 1.4 to 40 GHz ( GHz in the galaxy’s rest-frame; Fig. 3). This yields a steep high-frequency spectral index of . Data obtained from surveys conducted below 1 GHz suggest a flattening of the spectrum at low frequencies, possibly fitted more accurately by a second order polynomial rather than a single power-law (Fig. 3). Additional measurements are required to determine this reliably, but this is beyond the scope of the current paper.
4 Discussion
4.1 Molecular gas and star formation
From the CO(1-0) luminosity we can estimate the mass of molecular gas in MRC 0152-209 by adopting a standard conversion factor [M⊙ (K km s-1 pc2)-1] (where MH2 includes a helium fraction; e.g. Solomon & Vanden Bout, 2005). In this paper, we use M⊙ (K km s-1 pc2)-1 found by Downes & Solomon (1998) for ultra-luminous infra-red galaxies (ULIRGs). This also agrees with M⊙ (K km s-1 pc2)-1 found for high- sub-millimeter and star forming galaxies (Tacconi et al., 2008; Stark et al., 2008). We note, however, that the conversion of CO luminosity into H2 mass depends on the properties of the gas, such as metallicity and radiation field (e.g. Glover & Mac Low, 2011), and that conversion factors as high as of M⊙ (K km s-1 pc2)-1 have been derived for molecular clouds in the Milky Way (e.g. Solomon & Barrett, 1991). Our assumption of M⊙ (K km s-1 pc2)-1 thus results in a conservative estimate of the total molecular gas mass in MRC 0152-209 of M.
The 24m infra-red (IR) flux of MRC 0152-209 (Jy) is among the highest in a large sample of HzRGs observed with Spitzer by De Breuck et al. (2010). At , the observed m corresponds to m in the rest-frame, hence from we derive a mono-chromatic rest-frame luminosity of (). When comparing the mid-IR rest-frame colors (De Breuck et al., 2010) with IRAC color diagrams by Stern et al. (2005), MRC 0152-209 falls within the region that is dominated by active galaxies, indicating that a significant fraction of the 8 m flux may originate from a hot dusty torus surrounding the central AGN.
Alternatively, part of () may arise from a dust-enshrouded starburst, which peaks in the far-IR (FIR). Evans et al. (2005) show that low- radio galaxies follow a strong correlation between and . This trend is also seen among high- submillimeter galaxies (SMGs; Greve et al., 2005; Ivison et al., 2011) and likely reflects the Schmidth-Kennicutt relation between star formation rates and gas reservoir (Schmidt, 1959; Kennicutt, 1998). If this correlation is also valid for HzRGs, the CO(1-0) luminosity of MRC 0152-209 implies a FIR luminosity of order (Ivison et al., 2011), well in the regime of ULIRGs. Bavouzet et al. (2008) show that the mono-chromatic IR luminosities of starburst-dominated ULIRGs at 8, 24, 70 and 160m are strongly correlated with the total IR luminosity (), with reliable correlations up to . While these correlations may not necessarily be valid in case a significant fraction of () in MRC 0152-209 is AGN related, we argue that they still provide a reliable upper limit to , given that a ‘starburst-only’ scenario will provide the highest possible energy output in the FIR and thus maximize . From () and following Bavouzet et al. (2008, their Equation 6), we therefore estimate that for MRC 0152-209.
The upper limit on the dust-to-gas ratio in MRC 0152-209 can then be estimated to be , consistent with that of nearby ULIRGs (Solomon et al., 1997). Following Kennicutt (1998), the upper limit on the star formation rate is yr-1. Assuming that the molecular gas in MRC 0152-209 offers a reservoir to sustain this maximum star formation rate, the lower limit on the gas depletion time-scale is t Myr (with the star formation efficiency). According to models by Mihos & Hernquist (1994), this minimum gas depletion time-scale is comparable to the typical lifetime of a massive burst of star formation during a major merger, which could give the merging system the appearance of a ULIRG for about Myr (although Swinbank et al. (2006) show that for high- SMGs a starburst age of several 100 Myr is more realistic). It is conceivable that also MRC 0152-209 has undergone a recent merger, given its disturbed optical morphology (Pentericci et al., 2001).
Therefore, MRC 0152-209 shares characteristics commonly found among ULIRGs, but its classification remains somewhat ambiguous until the nature of the IR emission and star formation properties are better understood. It is clear, however, that MRC 0152-209 contains a large reservoir of molecular gas that has not (yet) been depleted by vigorous star formation.
4.2 CO(1-0) in HzRGs
The CO(1-0) luminosity of MRC 0152-209 is an order of magnitude larger than that found in nearby radio galaxies (Ocaña Flaquer et al., 2010; Evans et al., 2005), indicating that MRC 0152-209 contains significantly more molecular gas than its low- counterparts.
Assuming , the H2 mass of MRC 0152-209 is of the same order as that derived from CO detections in other HzRGs (Scoville et al., 1997; Papadopoulos et al., 2000, 2001; Alloin et al., 2000; De Breuck et al., 2003a, b, 2005; Greve et al., 2004; Klamer et al., 2005; Ivison et al., 2008; Nesvadba et al., 2009) as well as from a survey of high- SMGs (Greve et al., 2005). However, most of these CO studies relied on observations of the higher rotational CO transitions, which could underestimate the total mass and spatial extent of the molecular gas (see Sect. 1).
To our knowledge, CO(1-0) detections have been claimed for only two other HzRGs, namely TN J0924-2201 (; Klamer et al., 2005) and 4C 60.07 (; Greve et al., 2004; Ivison et al., 2008). Both systems contain M. Interestingly, they both are IR-faint objects (De Breuck et al., 2010; Ivison et al., 2008). CO(1-0) observations of four SMGs (; Ivison et al., 2011) and three massive star-forming disk () galaxies (; Aravena et al., 2010) reveal CO(1-0) luminosities comparable to that of MRC 0152-209. CO(1-0) observations of larger and unbiased samples of various types of high- galaxies are necessary to investigate and compare the molecular gas content in these systems in a systematic way.
4.2.1 CO(1-0) and radio source properties
The radio source in MRC 0152-209 is fairly compact (13 kpc) and not reaching beyond the optical boundaries of the host galaxy (Pentericci et al., 2000, 2001). Based on a CO(3-2) detection in the outer part of the Ly halo that surrounds the radio galaxy TXS 0828+193, Nesvadba et al. (2009) speculate that large amounts of dense gas (and perhaps dust) may be present in the halos of HzRGs at radii that are not yet affected by mechanical heating from the radio source. This would be in agreement with studies of the neutral gas in HzRGs by van Ojik et al. (1997b), who find that strong H I absorption is predominantly associated with small (kpc) radio sources. It will be particularly interesting to investigate whether the CO(1-0) gas, i.e., the part of the observable molecular gas that is least affected by excitation and heating, shows a similar trend with radio source size, or whether on average HzRGs are fainter in CO(1-0) than their radio-quiet high- counterparts.
Besides MRC 0152-209, we recently published a tentative CO(1-0) detection with ATCA/CABB in the HzRG MRC 0943-242 (Emonts et al., 2011). This tentative CO(1-0) detection is found in the outer part of the Ly halo that surrounds MRC 0943-242 (i.e. beyond the 15 kpc radius of the radio source). Regarding the other two known HzRGs with CO(1-0) detections (Sect. 4.2), TN J0924-2201 also contains a compact radio source (Klamer et al., 2005), while for 4C 60.07 the radio source is extended, but the CO(1-0) most likely represents tidal debris from a galaxy-galaxy interaction (; Ivison et al., 2008).
In a forthcoming paper, we will present result of our ongoing systematic CO(1-0) survey of a larger sample of HzRG with ATCA/CABB. This will allow further investigation into possible connections between radio-AGN activity and the cold molecular gas properties of HzRGs.
5 Conclusions
We have presented a robust detection of CO(1-0) in the high- radio galaxy MRC 0152-209 (), tracing a molecular gas mass of M (/0.8) M⊙. MRC 0152-209 is an IR-bright radio galaxy that contains a large reservoir of cold molecular gas that has not (yet) been depleted by star formation or radio source feedback.
CO(1-0) is the most robust tracer of molecular gas (including the wide-spread, low-density and sub-thermally excited component) in high- galaxies. The search for CO(1-0) in HzRGs at observing frequencies below 50 GHz with the ATCA and EVLA will be a crucial complement to surveys of the higher CO transitions with ALMA.
References
- Alloin et al. (2000) Alloin D., Barvainis R., Guilloteau S., 2000, ApJL, 528, L81
- Aravena et al. (2010) Aravena M., et al., 2010, ApJ, 718, 177
- Bavouzet et al. (2008) Bavouzet N., Dole H., Le Floc’h E., Caputi K. I., Lagache G., Kochanek C. S., 2008, AA, 479, 83
- Briggs (1995) Briggs D. S., 1995, PhD thesis, New Mexico Institute of Mining and Technology
- Brown & Vanden Bout (1991) Brown R. L., Vanden Bout P. A., 1991, AJ, 102, 1956
- Carilli et al. (1997) Carilli C. L., Röttgering H. J. A., van Ojik R., Miley G. K., van Breugel W. J. M., 1997, ApJS, 109, 1
- Carilli et al. (2010) Carilli C. L., et al., 2010, ApJ, 714, 1407
- Dannerbauer et al. (2009) Dannerbauer H., Daddi E., Riechers D. A., Walter F., Carilli C. L., Dickinson M., Elbaz D., Morrison G. E., 2009, ApJL, 698, L178
- De Breuck et al. (2000) De Breuck C., Röttgering H., Miley G., van Breugel W., Best P., 2000, AA, 362, 519
- De Breuck et al. (2003a) De Breuck C., et al., 2003a, AA, 401, 911
- De Breuck et al. (2003b) De Breuck C., Neri R., Omont A., 2003b, New Astronomy Review, 47, 285
- De Breuck et al. (2005) De Breuck C., Downes D., Neri R., van Breugel W., Reuland M., Omont A., Ivison R., 2005, AA, 430, L1
- De Breuck et al. (2010) De Breuck C., et al., 2010, ApJ, 725, 36
- Downes & Solomon (1998) Downes D., Solomon P. M., 1998, ApJ, 507, 615
- Emonts et al. (2011) Emonts B. H. C., et al., 2011, MNRAS, in press. (arXiv/1103.5806)
- Evans et al. (1996) Evans A. S., Sanders D. B., Mazzarella J. M., Solomon P. M., Downes D., Kramer C., Radford S. J. E., 1996, ApJ, 457, 658
- Evans et al. (2005) Evans A. S., Mazzarella J. M., Surace J. A., Frayer D. T., Iwasawa K., Sanders D. B., 2005, ApJS, 159, 197
- Glover & Mac Low (2011) Glover S. C. O., Mac Low M.-M, 2011, MNRAS, 412, 337
- Greve et al. (2004) Greve T. R., Ivison R. J., Papadopoulos P. P., 2004, AA, 419, 99
- Greve et al. (2005) Greve T. R., et al., 2005, MNRAS, 359, 1165
- Humphrey et al. (2006) Humphrey A., Villar-Martín M., Fosbury R., Vernet J., di Serego Alighieri S., 2006, MNRAS, 369, 1103
- Ivison et al. (2008) Ivison R. J., et al., 2008, MNRAS, 390, 1117
- Ivison et al. (2011) Ivison R. J., Papadopoulos P. P., Smail I., Greve T. R., Thomson A. P., Xilouris E. M., Chapman S. C., 2011, MNRAS in press. (arXiv/1009.0749)
- Kennicutt (1998) Kennicutt Jr. R. C., 1998, ApJ, 498, 541
- Klamer et al. (2005) Klamer I. J., Ekers R. D., Sadler E. M., Weiss A., Hunstead R. W., De Breuck C., 2005, ApJL, 621, L1
- McCarthy et al. (1990) McCarthy P. J., Kapahi V. K., van Breugel W., Subrahmanya C. R., 1990, AJ, 100, 1014
- McCarthy et al. (1991) McCarthy P. J., van Breughel W., Kapahi V. K., Subrahmanya C. R., 1991, AJ, 102, 522
- Mihos & Hernquist (1994) Mihos J. C., Hernquist L., 1994, ApJL, 431, L9
- Miley & De Breuck (2008) Miley G., De Breuck C., 2008, AARv, 15, 67
- Nesvadba et al. (2009) Nesvadba N. P. H., et al., 2009, MNRAS, 395, L16
- Ocaña Flaquer et al. (2010) Ocaña Flaquer B., Leon S., Combes F., Lim J., 2010, AA, 518, A9+
- Papadopoulos et al. (2000) Papadopoulos P. P., Röttgering H. J. A., van der Werf P. P., Guilloteau S., Omont A., van Breugel W. J. M., Tilanus R. P. J., 2000, ApJ, 528, 626
- Papadopoulos et al. (2001) Papadopoulos P., Ivison R., Carilli C., Lewis G., 2001, Nature, 409, 58
- Pentericci et al. (2000) Pentericci L., Van Reeven W., Carilli C. L., Röttgering H. J. A., Miley G. K., 2000, AAS, 145, 121
- Pentericci et al. (2001) Pentericci L., McCarthy P. J., Röttgering H. J. A., Miley G. K., van Breugel W. J. M., Fosbury R., 2001, ApJS, 135, 63
- Schmidt (1959) Schmidt M., 1959, ApJ, 129, 243
- Scoville et al. (1997) Scoville N. Z., Yun M. S., Windhorst R. A., Keel W. C., Armus L., 1997, ApJL, 485, L21+
- Seymour et al. (2007) Seymour N., et al., 2007, ApJS, 171, 353
- Solomon & Barrett (1991) Solomon P. M., Barrett J. W., 1991, in IAU Symposium, Vol. 146, Dynamics of Galaxies and Their Molecular Cloud Distributions, F. Combes & F. Casoli, ed., pp. 235–+
- Solomon et al. (1997) Solomon P. M., Downes D., Radford S. J. E., Barrett J. W., 1997, ApJ, 478, 144
- Solomon & Vanden Bout (2005) Solomon P. M., Vanden Bout P. A., 2005, ARAA, 43, 677
- Stark et al. (2008) Stark D. P., Swinbank A. M., Ellis R. S., Dye S., Smail I. R., Richard J., 2008, Nature, 455, 775
- Stern et al. (2005) Stern D., et al., 2005, ApJ, 631, 163
- Swinbank et al. (2006) Swinbank A. M., Chapman S. C., Smail I., Lindner C., Borys C., Blain A. W., Ivison R. J., Lewis G. F., 2006, MNRAS, 371, 465
- Tacconi et al. (2008) Tacconi L. J., et al., 2008, ApJ, 680, 246
- van Ojik et al. (1997a) van Ojik R., et al., 1997a, AA, 321, 389
- van Ojik et al. (1997b) van Ojik R., Roettgering H. J. A., Miley G. K., Hunstead R. W., 1997b, AA, 317, 358
- Venemans et al. (2007) Venemans B. P., et al., 2007, AA, 461, 823
- Wilson et al. (2011) Wilson W. E., et al., 2011, MNRAS (submitted)
- Wright (2006) Wright E. L., 2006, PASP, 118, 1711