Measuring helium abundance difference in giants of NGC 2808 ††thanks: Based on observations collected at ESO VLT, Chile, under programme 384.D-0283.
Abstract
Context. Multiple populations have been detected in several globular clusters (GC) that do not display a spread in metallicity. Unusual features of their observed colour-magnitude diagrams (CMD) can be interpreted in terms of differences in the Helium content of the stars belonging to the sub-populations.
Aims. Even if evidence gathered so far is compelling, differences in He abundance have never been directly observed. We attempt to measure these differences in two giant stars of NGC 2808 with very similar astrophysical parameters but different Na and O abundances, hence that presumably belong to different sub-populations, by directly comparing their He I 10830 Å lines.
Methods. The He 10830 Å line forms in the upper chromosphere. Our detailed models derive the chromospheric structure using the Ca II and H chromospheric lines, and simulate the corresponding He I 10830 line profiles as a function of the helium abundance. We show that, at a given value of He abundance, the He I 10830 equivalent width cannot significantly change without a corresponding much larger change in the Ca II chromospheric lines. We have used the VLT-CRIRES to obtain high-resolution spectra in the 10830 Å region, and the VLT-UVES to obtain spectra of the Ca II and H lines of our target stars.
Results. The two target stars have very similar Ca II and H chromospheric lines, but different appearances in the He region. One line, blueshifted by 17 km s-1 with respect to the He 10830 rest wavelength, is detected in the spectrum of the Na-rich star, whereas the Na-poor star spectrum is consistent with a non-detection. From a detailed chromospheric modeling, we show that the difference in the spectra is consistent and most closely explained by an He abundance difference between the two stars of 0.17. Our optical observations bracket the infrared ones over a range of about 50 days and we do not observe any substantial variability in the Ca II and H lines.
Conclusions. We provide direct evidence of a significant He line strength difference in giant stars of NGC 2808 belonging to different sub-populations, which had been previously detected by other photometric and spectroscopic means.
Key Words.:
Globular clusters: individual: NGC2808 – Stars: late-type – Stars: atmospheres1 Introduction
Light element (CNO cycle elements, Mg, Na) variations and anti-correlations in globular cluster (GC) red giant branch (RGB) stars have been known to exist for nearly 20 years (see e.g. Carretta et al. 2010 for a review) and for a long time were thought to be caused by mixing phenomena during the RGB phase. The detection of an abundance spread and element correlations in main sequence stars demonstrated that they are the result of pollution from previous generations of stars that contaminated the original cluster gas with CNO (and Na-Mg) cycled material (Gratton et al. 2001).
A vigorous discussion is ongoing about the nature of the stars producing these chemical anomalies, the most quoted candidates being either high mass stars (Decressin et al. 2007) or intermediate mass AGB’s (D’ Antona and Caloi 2008). Two conclusions common to all scenarios are that a large amount of He was produced and that the polluted stars must be He enriched.
The discovery of multiple main sequences in several GCs, which can be accounted for by a large (sometimes huge) difference in He abundance among the different populations, is fully consistent with this scenario. In Cen, where multiple main sequences were firstly observed, the blue main-sequence stars must have a higher He abundance to explain their higher metallicity (Piotto et al. 2005). A perhaps more remarkable result is that multiple main sequences are also observed in NGC 2808 and in other GCs without any significant heavy element abundance spread (Piotto et al. 2007). According to stellar evolution prescriptions, large differences in He abundance are needed to account for these multiple populations. In NGC2808, for example, a detailed photometric and spectroscopic study of RGB bump stars requires He abundance differences spanning a range of from 0.11 to 0.19 among the three sub-populations identified in this cluster (Bragaglia et al. 2010). A similar difference, 0.15, is proposed by D’Antona and Caloi (2008) to account for its horizontal branch (HB) morphology. From the detailed analysis of several GCs by Gratton et al. (2010), He is most likely to be the third parameter, along with metallicity and age, affecting the HB morphology.
2 He abundance variations as diagnostics of multiple populations in GCs
2.1 The He 10830 line: observations
The evidence that He is enhanced in the ’polluted’ second-generation stars, is strong but so far only circumstantial.
The main obstacle to a direct spectroscopic confirmation is that He is hardly observable in cool stars, because no photospheric He lines are present in their atmospheres. Helium lines are observable in hot HB stars of GCs, where however their appearance is dominated by other effects, such as diffusion, that prevent reliable estimate of abundances (e.g. Mohler et al. 2007). The only He lines observable in cool stars are the 10830 Å (and in some cases the fainter 5876 Å, cf. Danks and Lambert 1985) chromospheric lines.
The 10830 Å line (hereafter He10830) has a chromospheric component that forms in the upper chromosphere of a low-gravity cool star farther out than either the H absorption core or the Ca ii and Mg ii emission cores. The line profile can provide insight into the dynamics of the upper atmosphere, where a wind begins to accelerate, hence it has been used with to study mass loss and chromospheric activity in several field metal-poor red giants and in a few RGB stars in the GC M13 (Dupree et al. 1992; Smith et al. 2004; Dupree et al. 2009). In these studies the line was shown to be detectable in stars fainter than M mag and hotter than 4500 K. Dupree et al. (2011) observed the He10830 line in twelve Cen giant stars belonging to different sub-populations, and found variations in the equivalent width as a function of the Al and Na abundances, and perhaps also of metallicity. They could not, however, quantify these differences in terms of He abundance between the different stars.
Earlier observations of the He10830 line in field stars include the large surveys of Zirin (1982) and O’Brien and Lambert (1986). The latter work is particularly interesting because the authors study in detail giants of different spectral types and the time variability of the line over several timescales.
2.2 The He10830 line: simulations
The He10830 line is actually a triplet spanning the range 9231.8565 - 9230.792 cm-1 (vacuum wavenumbers), the strongest member of the multiplet occurring at 9230.792 cm-1. It forms in non-LTE conditions, in the upper chromosphere above 104 K; therefore, it is difficult to use this line to determine the stellar He abundance in cool stars, hence it has never been previously used for this purpose. However, we show that relative He abundances can be estimated with the help of adequate chromosphere models.
We modelled the He10830 line in our target stars based on our previous work in NGC 2808 giants (Cacciari et al. 2004), using the Ca ii and H lines to model the chromospheres (Mauas et al. 2006). From these studies, it was clear that RGB stars in NGC 2808 have structured chromospheres, with plasma as hot as several thousands K and, at least for the most luminous objects, sufficiently fast velocity fields to produce mass loss along the RGB. We therefore expect the He10830 line to be blue-shifted by several tens of km s-1 because of the outward velocity field, and to be broadened because of the high temperature.
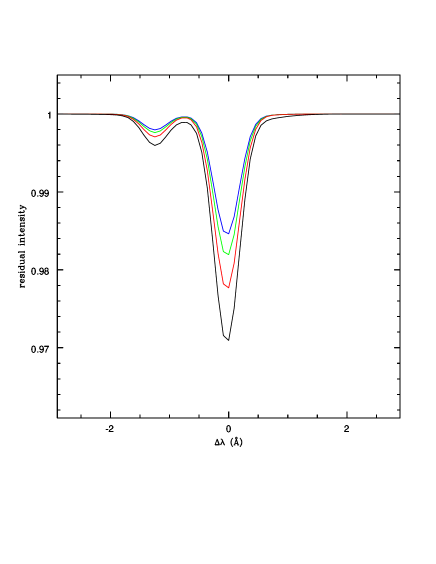
The purpose of these simulations is to investigate how strongly the He10830 line reacts to variations in the He abundance and to variations in the chromospheric structure, to evaluate the extent to which the line can be used to distinguish between these two effects. Figure 1 shows the He10830 line profiles obtained with our model of NGC 2808 bright giants (star 48889, Mauas et al. 2006) when varying the content of He in the atmosphere. The black line assumes a He abundance Y=0.3, and the other lines are computed by decreasing Y progressively in steps of 10.
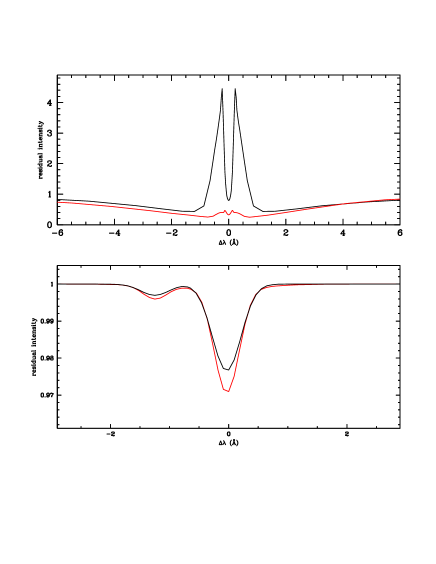
We also simulate the change in the chromospheric structure needed to produce the same effect on the He line profile as a 10% lower Y (see Figure 2). The He 10830 line forms in higher layers than the Ca ii K line. However, since it is dominated by radiation, its source function is decoupled from the Planck function in the region where the line is formed, and it depends on the conditions at inner layers. As we already pointed out in Mauas et al. (2006), “the computed profiles are unaffected by the structure of the regions where the temperature is higher than 10000 K”. Therefore, to mimic the lower He abundance profile the chromosphere has to be heated at layers where K. This, however, produces a huge variation on the profiles of the other chromospheric lines, e.g. the K line that is dominated by collisions, and its core reflects the temperature increase much more strongly. This variation would be readily observable, as is clearly shown in the upper panel of Fig. 2, where the Ca ii K line cores obtained with the two chromospheric models are compared.
This does not imply that we are able to derive the He abundance from the observations of the He 10830 line and its modelling using the Ca II and H lines. However, for two similar metal-poor cool giants, with not only the same main physical parameters, but also a similar chromospheric structure, as for our twin target stars, it is possible to distinguish between changes in the He lines caused by different He abundances or by different chromospheres, because chromospheric changes large enough to produce a visible difference in the He line profile would also produce huge differences in the other chromospheric lines. We discuss this point further in Section 4.
3 Observations and analysis
We selected from the list of Carretta et al. (2004) two RGB stars in the cluster NGC 2808, with very similar stellar parameters but very different Na and O abundances (see Table 1). The Na-rich O-poor star has been polluted by processed gas from a previous generation of stars and is expected to be representative of the He-enhanced population. The other star, with standard O and Na values, is taken to be representative of the unpolluted He-normal (primordial) population.
The observations were carried out in service mode at the ESO VLT. The UVES spectrograph (Dekker et al. 2000) was used to observe the stars in the Ca ii H and K lines and in H at R 40000. The IR high resolution spectrograph CRIRES (Käufl et al. 2004) was used for the He lines, with a similar resolution.
Complete information about the target stars and the observations is contained in Table 1. The temperature values are those based on B-V because no V-K colour is available for star 46422. The two stars have the same parameter values in the spectroscopic analysis of Carretta et al. (2004), but the spectroscopic temperatures are 100 K higher than the values based on the B-V colours.
Our stars are slightly brighter than MV = –1.5 mag and cooler than 4600 K, which represent the He10830 line detection thresholds found by Smith et al. (2004) and Dupree et al. (2009), so it was not quite clear whether the He line would be detectable in the normal abundance star. On the other hand, these stars are bright enough to permit a spectrum of the appropriate signal-to-noise ratio (S/N) to be obtained in a reasonably short integration time.
The spectra were processed starting from the output of the ESO pipelines. The UVES spectra taken in two separate runs (early November and December) are very similar for each star, therefore the average spectrum was used. We also observed a pair of fainter and hotter stars of NGC 2808, but the S/N of the extracted CRIRES spectra was not high enough to permit a reliable analysis; improvements will require the modifications of the pipeline extraction software.
The expected depth of the He line from our models is fairly small, therefore, even if the S/N in the continuum of the stars is around 100 for a 0.044 cm-1 pixel, for the two brightest stars a special care was taken and the output spectra of the CRIRES pipeline (Jung & Bristow 2008 ) were further treated; all spectra were deglitched and normalized to unity for the continuum using a low order polynomial.
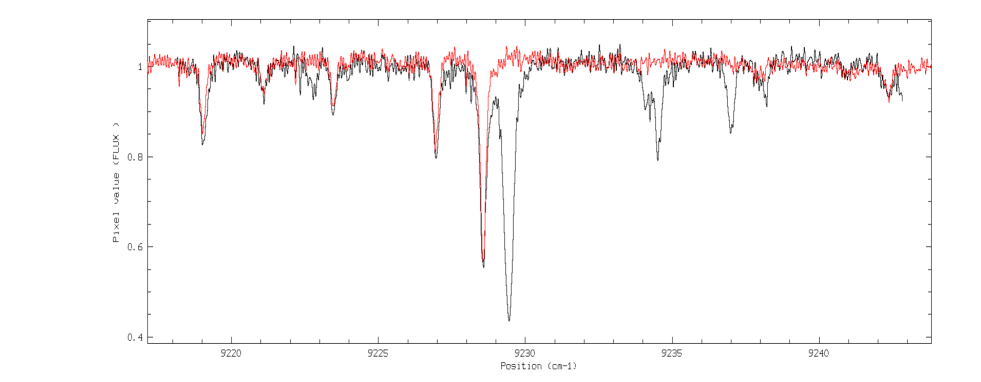
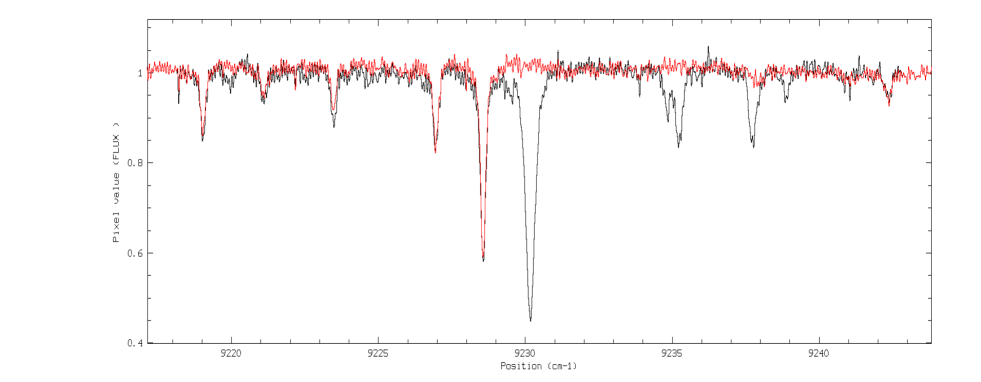
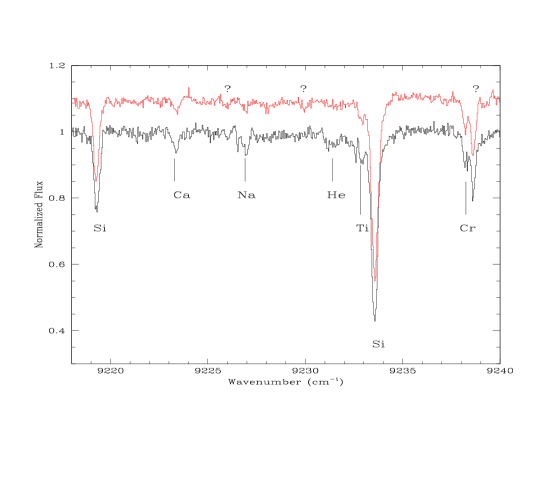
The region around the He10830 lines contains two telluric lines, a strong one at 9229.284 cm-1, and a weaker one (about 1/3 of the equivalent width) at 9227.689 cm -1 (Breckinridge and Hall 1973). The presence of these telluric lines can endanger a correct detection or measurement of the He10830 lines. We therefore observed a rapidly rotating hot star for telluric correction (HD 79041, B6V, ), at an airmass similar to the one of the cluster targets (1.5 for HD 79041, 1.7 for 48889 and 1.53 for 46422). The spectrum of the standard star was first normalized and scaled by the ratio of the airmasses, to properly reproduce the depth of the telluric lines. The program star spectra were divided by the scaled spectra of the standard star. Figures 3 and 4 show in black the spectra of the program stars and in red the spectra of the standard star before the division. In these figures, wavelength is expressed in cm-1, no velocity adjustment has been applied and blue is to the right. The reader can note in Figures 3 and 4 that the telluric lines are redshifted by 0.5 cm s-1 with respect to their nominal wavenumber because of the imperfect wavelength calibration.
When taking into account the radial velocity of the stars (cfr. Table 1), the He10830 lines are expected to be blueward of 9227.25 cm-1 for star 48889 and of 9227.92 cm-1 for star 46422.
The last step consisted of correcting the program star spectra for radial velocity by matching the McMath Solar FTS spectra using the Solar FTS atlases from Wallace et al. (1993) centred on the HeI line. A small adjustment to the wavelength scale was also required to best match the solar atlas. The finally reduced spectra at rest-frame wavenumber are shown in Figure 5. The spectra of the two NGC 2808 stars, show the same features, with the exception of two lines: at 9227 cm-1, where a Na doublet is present in star 48889 and is much smaller in star 46422, thus confirming the much higher Na abundance of star 48889; and at 9231.32 cm-1, where a rather broad line is clearly present in the spectrum of star 48889 but is missing in the spectrum of star 46422.
This feature has a different shape from the other lines: it is at least 17 km s-1 broad, and is blue-shifted by 17 km s-1 with respect to the rest wavelength of the strongest He10830 component (9230.792 cm-1). This is approximately what is expected, in a few field stars the He lines have blue shifts larger than 60 Km s-1 (Dupree et al. 2009), but most field giants have spectra strikingly similar to our spectrum of star 48889. Several spectra presented in O’Brien and Lambert (1986) also have He lines that are similar in depth and width to the one observed in star 48889. The wavenumber of the nearby Si (9233.58) and Na (9226.94) lines are in excellent agreement with their vacuum measurements.
Since the expected (and the observed) He line is quite small (a few of the continuum only), it is necessary to further develop some considerations about the significance of its detection. The S/N in the continuum for these spectra is S/N100 for 0.044 cm s-1 pixel for both stars. For such a S/N, the error associated with the equivalent width of the He line is about 4 mcm-1, or seven times smaller than the measured equivalent width (Cayrel 1988; see also discussion in Bonifacio et al. 2002). Apart from the contamination by the telluric line, there is, therefore no reason to question the reality and the detection of the He line. This is also confirmed by equivalent widths as small as a few mcm-1 being clearly observed and measured in the spectra (cf. Figures 3-5 and Table 2). The only doubt that can therefore be reasonably cast concerns the blending of the telluric 9227.799 line with the He feature. However, as is clear from Figure 3, the telluric and the He line are partially detached; in addition, we performed several tests changing the intensity of the telluric line, which did not substantially modify the equivalent width of the He line. We also note that the telluric lines have a width of 0.22 cm s-1, while the He line is at least 0.52 cm s-1 wide.
To avoid biases in our analysis, we asked a colleague to measure the equivalent width of the lines in the spectra and use an automatic spectral analysis program, DAOSPEC (Stetson and Pancino 2008). Among other features, DAOSPEC defines its own continuum. A list of line identifications, measured wavenumbers, and equivalent widths for this region is given in Table 2. The equivalent widths are an average of the manual and the DAOSPEC measurements. The largest difference between these measurements was about 6 mcm-1, but for the strong Si line, for which the difference is up to 20 mcm-1. DAOSPEC also estimates as well the errors in the equivalent widths, which are typically 1.5-2 mcm-1, perfectly compatible with the measured differences.
There is good agreement between the equivalent widths of the lines of the two stars, but most lines appear slightly stronger in the spectrum of star 48889. This likely indicates that 48889 is slightly cooler than 46422. The line at 9231.3 is absent in the spectrum of star 46422. We also note that all the other lines have line widths not larger than 12 Km s-1 (0.4 cm-1), while the 9231.3 feature is substantially wider. Close to the 9231.3 line towards the blue there is a line at 9232.88 cm-1 that is stronger in star 48889. This line could in principle be identified with a Si line at 9233.10 cm-1, but the frequency of the transition agrees very well with a Ti line at 9232.83 cm-1. This line is sometimes seen in absorption in the spectra of cool M stars (O’Brien and Lambert 1986). O’Brien and Lambert (1986) also mention an unidentified line at 10831.3 Å (or 9229.975 cm-1) in the spectra of stars later than spectral class M, with an equivalent width of 16 mÅ in Her. This line is visible in star 46422 with an equivalent width of 9 mcm-1, and we can set an upper limit of 6 mcm-1 for star 48889; our targets are hotter and fainter than Her and in addition have a rather low metallicity, which would naturally decrease the strength of most lines.
Finally, we consider the possibility that the 9131.3 feature is the blend of two so far unidentified lines. In principle, it can be reproduced with two lines, one at 9131.15 and one at 9131.6 cm-1, each with an equivalent width of about 15 mcm-1. We are not aware of known or reported lines at these wavenumbers; possible nearby candidates are two Si lines (9131.81, 9131.32). However, we note that the difference between the two stars for the two lines would be very large, whereas a few Si lines we checked in the UVES spectra (6125.021, 6142.483 Å) agree to within 2 mÅ in their equivalent widths. In addition, if the observed feature were the product of the blend of the two Si lines, one may also expect companion lines at 9130.42 and at 9233.10 cm-1, which are not observed ( as discussed above; note that the bluer would be partially blended with the strong 9233.56 line).
The combination of the large equivalent width of the line, the missing companion Si lines, that no lines have been reported at this wavenumber in the literature (even for more metal rich and/or cooler stars) and that the observed feature qualitatively agrees with what is expected a priori, let us conclude that the 9131.3 line is due to He, although we cannot exclude a priori that it is a blend of two unknown lines.
4 He abundance difference
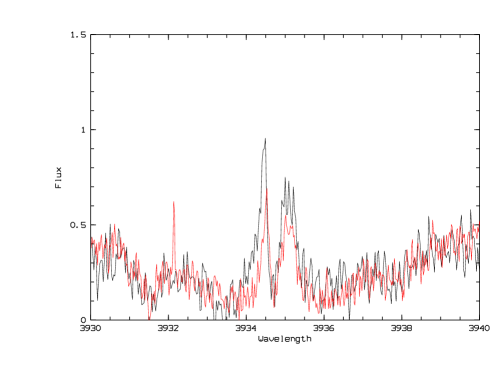
We estimated the difference in He abundance using our chromospheric models. The Ca ii K line core profiles in Figure 6 show that the star 48889 was slightly more active than star 46422, but the difference is not so dramatic as to require the use of a completely different model. This difference is compatible with a low level of chromospheric variability.
The basic models are those for star 48889 developed in Mauas et al. (2006), which have only been modified in the upper chromosphere and made slightly hotter to take into account the higher chromospheric activity level of this star in 2010 with respect to 2004. However, this update does not involve a substantial change from the previous model. No velocity fields are considered for these simulations. Maintaining the same T versus (vs.) log(m) distribution, we self-consistently recomputed the non-LTE radiative transfer and the statistical and hydrostatic equilibrium equations, assuming different values of the He abundance. Using the program Pandora (Avrett & Loeser 1984), in each case we computed non-LTE populations for 10 levels of H, 9 of C i(see Mauas, Avrett & Loeser 1990), 15 of Fe i, 8 of Si i (see Cincunegui & Mauas 2001), 8 of Ca i and Na i, 6 of Al i (see Mauas, Fernández Borda & Luoni 2002), and 7 of Mg i (see Mauas, Avrett & Loeser 1988). In addition, we computed 6 levels of He ii and Mg ii, and 5 of Ca ii. For every species under consideration, we included all the bound-free transitions and the most important bound-bound transitions.The Ly-, Ca ii H and K, and Mg ii and lines were all computed with a full partial-redistribution treatment (for a discussion, see Falchi & Mauas 1998). For He i, we used the 29-level atomic model used by Mauas et al. (2005) and Andretta et al. (2008).
It is well known that a strong coronal radiation can ionize He, and enhance the strength of the line via recombination to its higher levels (for a discussion of this mechanism in the Sun, see Mauas et al. 2005). However, these stars are well beyond the so-called coronal ’dividing line’ (Linsky and Haisch 1979, Maggio et al. 1990), and are therefore by far too cool and too luminous to possess a corona. The only coronal activity detected in metal poor stars is in short-period binary systems (Pasquini et al. 1991), which is not the case for our sample stars. Furthermore, O’Brien and Lambert (1986) found that this effect is not important for giant stars.
The resulting spectra were broadened by a Gaussian of 17 Km s-1 FWHM.
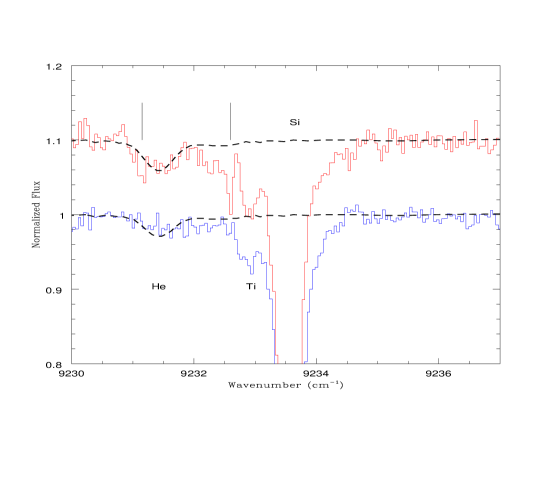
Figure 7 shows the results of the modeling: star 46422 spectrum is compatible with a non detection. The figure shows the model with Y0.22, that has an equivalent width close to the upper limit in Table 2. We consider this value a valid upper limit and the model a good representation of the observed spectrum. An extra absorption in this area seems to be present, so at face value a model with no He line would not be fully compatible with the spectrum. However, given the uncertainties in the He line width and the critical placement of the continuum, a claim of He detection for this star would be an overinterpretation of the data.
For star 48889, an abundance of Y0.39 is needed to reproduce the observed spectrum. We have tried different values of Y, and the model line profile would still be compatible with the observed one for a He abundance as high as Y0.5 in this star. When considering all the uncertainties involved, as discussed in the previous section and the uncertainty in the placement of the continuum, we infer that our Y=0.39 model is a lower limit for this star. Since we aim to derive relative He abundances rather than absolute values that are affected by much larger uncertainties, our models show that a difference of at least Y=0.17 is needed to reproduce the observed spectra.
Such a large difference in He abundance would increase the opacity, therefore modifying the spectra of these He-rich stars. This problem was studied by Bohm Vitense (1979), who pointed out that the effect is an increase in the gravity of the stars, as quantitatively addressed by Pancino et al. (2011). A helium abundance increase by Y=0.10 (from 0.25 to 0.35) in subgiant stars leads to a higher metallicity by [Fe/H]=0.08 dex, based on a simplified treatment of the atmosphere where the increased helium abundance is approximated by an artificial increase in the gravity. A more refined atmospheric modelling finds a smaller metallicity increase, i.e. [Fe/H] 0.02-0.03 dex (Pancino, private communication). If we apply the Gray (2008) approximation to our star, a helium increase of Y=0.17 would correspond to a =0.06, that in turn leads to increase the metallicity of about 0.01 and 0.03 dex for FeI and FeII, respectively (Carretta, private communication). This difference is much smaller than the typical error in the metallicity determination of 0.10-0.15 dex estimated by Carretta et al. (2004), who derive essentially the same values of [Fe/H] within the errors for the two stars (see Table 1).
As we pointed out in Section 2.2, it is not possible to modify the He profiles by changing only the upper layers of the atmosphere. Modifying the atmosphere above around 9000 K does not change the He profiles, because the source function of the lines is completely determined by the conditions at lower heights. This was mentioned in Mauas et al. (2006), where we pointed out that, although the center of H is formed at around 12000 K (see Fig. 2 of Mauas et al. 2006), the computed profiles are unaffected by the structure of the regions where the temperature is higher than 104 K. The profile of the He 10830, which as in the case of H is dominated by radiation, is also unaffected by changes high in the atmosphere. On the other hand, the chromospheres of these stars are, of course, far from being semi-static and homogeneous, as our models assume. We do not have a realistic way to evaluate the inhomogeneities of the chromosphere of these stars in any meaningful way. However, to the best of our present knowledge, we believe that a He abundance difference is the simplest and most plausible explanation of the observational evidence.
| Star name | Mv | [Fe/H] | [Na/Fe] | [O/FE] | RV | Obs. UVES | Obs. CRIRES | ||
|---|---|---|---|---|---|---|---|---|---|
| km s-1 | int. time = 1200 sec | int. time = 1800 sec | |||||||
| 48889 | 3843 | 0.52 | -2.25 | -1.22 0.12 | +0.64 | -0.07 | 115.1 | 06/11/09 & 26/12/09 | 26/11/09 |
| 46422 | 3843 | 0.42 | -2.21 | -1.08 | +0.12 | +0.23 | 93.5 | 06/11/09 & 02/12/09 | 26/11/09 |
| Wavenumber (Meas.) | Wavenumber (Exp.) | Element | Width (48889) | Width (46422) | Eq. Width (48889) | Eq. Width (46422) |
|---|---|---|---|---|---|---|
| cm-1 | cm-1 | cm-1 | cm-1 | mcm-1 | mcm-1 | |
| 9219.27 | 9219.29 | Si I | 0.33 | 0.35 | 89 | 85 |
| 9223.34 | 9223.44 | Ca I | 0.37 | 0.42 | 23 | 17 |
| 9225.99 | ? | ? | 0.2 | 0.40 | 8 | 9 |
| 9226.94 | 9226.90 | Na I | 0.35 | 0.41 | 28 | 12 |
| 9229.97 | ? | ? | / | 0.24 | 6 | 9 |
| 9231.30 | 9230.792 | He I | / | 30 | 11 | |
| 9232.88 | 9232.83 | Ti I | 0.38 | 0.43 | 36 | 27 |
| 9233.58 | 9233.56 | Si I | 0.40 | 0.41 | 252 | 240 |
| 9238.25: | 9238.17 | Cr I | 0.31 | 0.29 | 36: | 30 |
| 9238.60: | ? | ? | 0.30 | 0.30 | 62 | 54 |
5 Summary and conclusions
We have studied two RGB stars in the GC NGC 2808, that have very similar astrophysical parameters but very different Na and O abundances. These stars are assumed to represent the initial sub-population with primordial Na, O, and He abundances, and a subsequent subpopulation formed out of processed material from the previous population, which is hence Na and He enriched and O depleted. Whereas Na and O abundances are available for these and other stars in NGC 2808, the He abundance has never been determined before. Since helium differences are supposed to be responsible for peculiar observed features of the CMD such as the multiple main sequences and the HB morphology, the empirical detection of a He difference would provide the essential and final confirmation of this scenario.
Helium is barely detectable in cool stars, the only observable line being the He10830 chromospheric line. This line forms in non-LTE conditions and should not be used to derive absolute He abundances, although with the help of a suitable chromospheric model, reliable quantitative information about relative abundances can be obtained under appropriate assumptions. Our study relies on detailed model chromospheres based on high-resolution VLT-UVES spectra of the Ca ii K and H lines for the two program stars. These models produce the corresponding He10830 line profiles for comparison with the observed ones, obtained from VLT-CRIRES high-resolution spectra.
The two program stars have distinctly different features in the spectral region blueward of the He line rest frequency. In particular an absorption line, broader than the other recognized lines, in the spectrum of star 48889, which is a sodium-rich, oxygen-poor star) is absent in the spectrum of star 46422 (which has normal O and Na abundances). We interpret this feature as a blue-shifted He line and use our models to derive the He abundance differences. The He abundance difference estimated from the models is no less than Y = 0.17, in excellent agreement with theoretical predictions based on stellar evolution considerations to account for the observed peculiarities of the CMD. Our results and conclusions are based on the assumption that the two observed stars are so similar, including in terms of their chromospheres, that the same model can be applied to both of them. This assumption relies on there being a strong similarity between their photometric and spectroscopic characteristics. We believe that an abundance difference between both stars is the most natural explanation of the difference in the observed profiles
As a final remark, we also assume that there is no variability between the sets of the infrared and the bracketing optical measurements, hence the chromospheric characteristics that can be modelled by the Ca ii and H lines apply also to the He10830 line. However, variability on different timescales in the He10830 line was observed in several field giants, e.g. by Lambert and O’Brien (1986), as pointed out by the referee. Although it cannot in principle be excluded that a significant chromospheric variation may have occurred in star 48889 at the time of the He10830 observation, which was not monitored by simultaneous optical observations, this variation should not have affected the Ca ii and H spectra that bracket the He10830 spectrum by just -20 and +30 days. This seems rather unlikely to us, and we feel confident that the enhanced He10830 line in star 48889 is indicative of higher helium abundance rather than of variability. However, future observations should take this possibility into account. The detection of He in GC giant stars still has a very short history, and clearly it will be important to measure the extent to which and on which timescales He10830 variability occurs in these objects.
Acknowledgements.
The authors gratefully acknowledge the use of NSO/Kitt Peak FTS data, produced by NSF/NOAO. We thank E. Pancino and E. Carretta for useful comments on metallicity determination in He-enhanced atmospheres. The comments and suggestions of an anonymous referee contributed to improve the quality of the paper. Rodolfo Smiljanic kindly performed the independent measurements of the equivalent widths and suggested that the 9231.3 line might be a blend.References
- Andretta et al., (2008) Andretta, V., Mauas, P. et al. 2008, ApJ, 681, 650
- Avrett et al., (1984) Avrett E.H., & Loeser R. 1984, in Methods in Radiative Transfer, ed. W. Kalkofen, Cambridge, Univ. Press, p. 341
- Bohm Vitense (1979) Bohm-Vitense, E. 1979, ApJ, 234, 521
- Bonifacio et al., (2002) Bonifacio, P. Pasquini, L. et al. 2002, A&A, 390, 91
- Bragaglia et al., (2010) Bragaglia, A., Carretta, E., Gratton, R.G. et al. 2010, A&A, 519, A60
- Breck et al., (1973) Breckinridge, J.B., Hall, D. 1973, Solar Physics 28, 15
- Cacciari et al., (2004) Cacciari, C., Bragaglia, A., Rossetti, E. et al. 2004, A&A, 413, 343
- Carretta et al., (2004) Carretta, E., Bragaglia, A. & Cacciari, C. 2004, ApJ, 610, L25
- Carretta et al., (2010) Carretta, E., Bragaglia, A., Gratton, R.G. et al. 2010, ApJ, 721, L21
- Cayrel (1985) Cayrel, R. 1985, in “Calibration of fundamental stellar quantities”, p.137 Dordrecht
- Cinquegui et al., (2001) Cincunegui, C., Mauas, P.J.D. 2001, ApJ, 552, 877
- Danks et al., (1985) Danks, T., Lambert, D. 1985, A&A, 148, 293
- D’Antona et al., (2008) D’ Antona, F. & Caloi, V. 2008, MNRAS, 390, 693
- Decressin et al., (2007) Decressin, T., Charbonnel, C. et al. 2007, A&A, 464, 102
- Dekker et al., (2000) Dekker, H., D’Odorico, S. et al. 2000, Proc. SPIE, 4008, 534
- Dupree et al., (1992) Dupree, A., Sasselov, D.D. & Lester, J.B. 1992, ApJ, 387, L85
- Dupree et al., (2009) Dupree, A.K., Smith, G.H. Straeder, J. 2009, AJ, 138, 1485
- Dupree et al., (2011) Dupree, A.K., Straeder, J. & Smith, G.H. 2011, arXiv:1012.4802
- Falchi et al., (1998) Falchi, A., Mauas, P.J. 1998, A&A, 336, 281
- Gratton et al., (2001) Gratton, R.G., et al. 2001, A&A, 369, 87
- Gratton et al., (2010) Gratton, R.G., Carretta, E., Bragaglia, A. et al. 2010, A&A, 517, A81
- Gray (2008) Gray, D.F. 2008, The Observation and Analysis of Stellar Photospheres, (Cambridge: Cambridge University Press)
- Jung et al., (2008) Jung, Y. & Bristow, P. 2008, Proceedings of The 2007 ESO Instrument Calibration Workshop , p. 225
- Käufl et al., (2004) Käufl, H. U. et al. 2004, Proc. SPIE 5492, 1218
- Linsky et al., (1979) Linsky, J.L., Haisch, B.M. 1979, ApJ, 229, L27
- Maggio et al., (1998) Maggio, A., Vaiana, G.S., Haisch, B.M. et al. 1990, ApJ, 348, 253
- Mauas et al., (1988) Mauas, P.J.; Avrett, E.H.; Loeser, R. 1988, ApJ, 330, 1008
- Mauas et al., (1990) Mauas, P.J.; Avrett, E.H.; Loeser, R. 1990, ApJ, 357, 279
- Mauas et al., (2005) Mauas, P.J.D., Andretta, V. et al. 2005, ApJ, 619, 604
- Mauas et al., (2006) Mauas, P.J.D., Cacciari, C., Pasquini, L. 2006, A&A, 454, 609
- Mauas et al., (2002) Mauas, P.J; Fernández Borda, R.; Luoni, M.L. 2002, ApJS, 142, 285
- Moehler et al., (2007) Moehler, S., Dreizler, S., Lanz, T. et al. 2007, A&A, 475, L5
- O’Brien et al., (1986) O’Brien, G.T., Lambert, D.L. 1986, ApJS, 62, 899
- Pancino et al., (2011) Pancino, E., Mucciarelli, A. et al. 2011, A&A, 527, 18
- Pasquini et al., (1991) Pasquini, L., Fleming, T., Spite, F., Spite, M. 1991, A&A, 249, L23
- Piotto et al., (2005) Piotto, G., et al. 2005, ApJ, 621, 777
- Piotto et al., (2007) Piotto, G., Bedin, L., Anderson, J. et al. 2007, ApJ, 661, L53
- Smith et al., (2004) Smith, G.H, Dupree , A.K & Straeder, J. 2004, PASP, 116, 819
- Stetson et al., (2008) Stetson, P.B., Pancino, E. 2008, PASP 120, 1332
- Wallace et al., (1993) Wallace, L., Hinkle, K, & and Livingston, W. 1993, An Atlas of the Photospheric Spectrum from 8900 to 13600 cm-1 (7350 to 11230Å), N.S.O. Technical Report #93-001
- Zirin (1982) Zirin, H. 1982, ApJ, 665, 669