Four-contact impedance spectroscopy of conductive liquid samples
Abstract
We present an improved approach to the impedance spectroscopy of conductive liquid samples using four-electrode measurements. Our method enables impedance measurements of conductive liquids down to the sub-Hertz frequencies, avoiding the electrode polarization effects that usually cripple standard impedance analysers. We have successfully tested our apparatus with aqueous solutions of potassium chloride and gelatin. The first substance has shown flat spectra from 100 kHz down to sub-Hz range, while the results on gelatin clearly show the existence of two distinct low frequency conductive relaxations.
I introduction
Impedance spectroscopy is an experimental technique which enables insight into a wide range of physical phenomena encompassing several length and time scales specific to different systems.BDS Here we discuss the low frequency range, for which several types of commercial impedance analysers are available, typically covering ranges from several Hz to several MHz using a self-balancing bridge method. Their basic experimental setup is based on two electrodes that are used both as current and sensing contacts thus enabling a simple geometry and easy sample placement and preparation. Such a setup is then readily modelled with a parallel plate capacitor filled with a conductive dielectric.
Measuring the low frequency impedance response of conductive (and especially ionic) materials is typically plagued by many problems, the most important being electrode polarization.ludijapaneri ; bates ; sanabria ; italijani ; mazzeo ; HollingsworthSaville This effect makes the measurement of ionic solution conductivity in a two-electrode cell practically impossible at frequencies below a few kHz, and several techniques have been developed to amend this problem. They include signal analysis for removal the electrode polarization signal from a two-electrode spectrum,oduzimanje_pozadine ; bates ; italijani ; HollingsworthSaville variation of the interelectrode distance promjena_udaljenosti ; HollingsworthSaville and four contact configurations.ludijapaneri ; schwan ; komparator_bernengo ; MayersSaville ; mazzeo However, the only reliable method for obtaining spectra in the Hertz frequency range seems to be a four-contact measurement, first proposed by Schwan et al.schwan It is known that electrode polarization occurs mainly on the electrodes that pass current trough the sample; by using different electrodes for voltage sensing, electrode polarization effects can be avoided (Fig. 1). Although it is possible to extract true bulk low-frequency spectra using model equivalent circuits for the electrode polarization, this is tenuous and often leads to unsatisfactory and/or questionable results.macdonald Usually, the impedance relaxation is orders of magnitude smaller than the electrode polarization in the Hz frequency range, making four-contact measurements necessary to obtain credible results due to the limited sensitivity of the experimental setup. No amount of signal analysis can reproduce the quality of a clean spectrum without electrode effects.
There have been several newer designs of four-contact impedance cells (although very few recently), but while yielding good spectra at low frequencies, they all suffer from large cell volumes, complicated electronics, impractical sample exchange systems and clumsy temperature control.

In this paper we describe a novel planar four-contact cell design which avoids most of these problems, making accurate measurements with very small volumes and standard electronic instrumentation possible. Using a modern current source, lock-in amplifier and high impedance buffers, our cell is capable of measuring a very wide range of conductivities in the low frequency range, bringing new physics – in materials as diverse as gels, biopolymer solutions and liquid crystals – within reach.
II Apparatus design
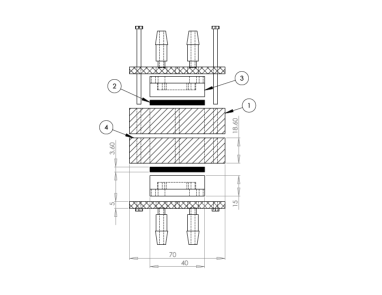
Our impedance cell consists of two parts: the circuit board used for impedance measurements and a temperature regulation system based on two Peltier elements. The layout of the temperature regulation is shown in Fig. 2, the essential parts being the two Peltier elements, two aluminium heat exchanger blocks, and a polyacetal housing. A dedicated heat exchange system was constructed using a radiator for computer water cooling with a mounted fan and a pump connected to the aluminium blocks with silicone tubing. The heat exchange liquid (a 1:1 mixture of water and ethylene glycol, with added anticorrosives) circulates through S–shaped channels inside the aluminium blocks at a flow rate of about 5 L/min, yielding enough heat transfer for the Peltier elements to provide a full 50∘C difference between hot and cold sides at maximum rated current. Aluminium blocks were connected to a common ground to provide shielding for the cell. The temperature was measured with a platinum thermometer mounted directly on the impedance printed circuit board (PCB), about 2 mm from the sample itself. A 6.5–digit Keithley multimeter was used to measure the resistance of the PT-1000 platinum resistor, providing relative temperature sensitivity of at least 1 mK. The temperature was regulated using a variable current source to power the Peltier elements driven from a PC using a PID controller written in LabView; temperature stability was typically better than K, with minimum and maximum working temperatures of C and C, respectively. The low thermal inertia of the system and fast current adjusting times enable temperature quenches with rates up to K/min, making possible the investigation of nonequilibrium materials. The precision of our temperature regulation and the versatility of the system makes it ideal for detailed and precise temperature-dependent measurements, which are essential for the study of various transition phenomena.
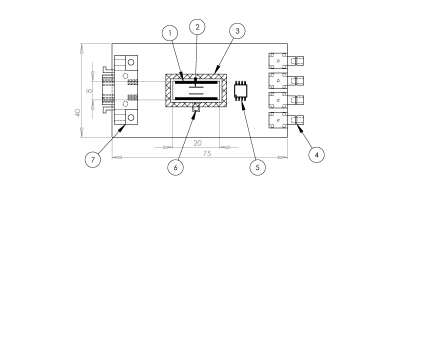
The heart of our apparatus is the dedicated printed circuit board (PCB) for impedance measuring, depicted in Fig. 3. The current and voltage electrodes are in a planar configuration which ensures high geometry precision while making measurements with small sample volumes possible. The volume of our sample compartment was only 55 L, more than an order of magnitude smaller, compared to configurations in previous works. Such a small volume guarantees a homogeneous temperature distribution inside the sample and makes reliable quenching experiments possible. Due to the planar geometry, sample placement and cleaning is greatly simplified, liquid samples simply being put on the electrodes with a micropipette. For water solutions, the sample compartment is efficiently cleaned by rinsing with 96% pure alcohol and deionized water. The circuit board itself was made from a glass–epoxy composite material to minimize water absorption and covered with a high resistance lacquer coating wherever possible. Both current (1 in Fig. 3) and voltage electrodes (2 in Fig. 3) are gold plated to avoid electrolysis and degradation. The board is in direct contact with the lower Peltier element to ensure good heat transfer, and the thickness of the board (1 mm) is as small as possible in order to minimize heat resistance between sample (and thermometer) and Peltier element. To ensure geometry repeatability and to eliminate artefacts at low frequencies, channels were machined into the board to hold the sample in place, and a second piece of the board material was glued to the upper Peltier element, serving as a lid for the sample compartment. To make the cell airtight and eliminate evaporation problems an additional polycarbonate spacer (3 in Fig. 3) was machined and glued to the board.
A crucial detail in making the four-contact cell immune to electrode polarization is ensuring that no current flows through the voltage electrodes. Typical lock-in amplifier inputs however have impedances up to 100 M, making the use of high impedance buffers a necessity. Our buffer was a two-channel JFET operational amplifier (Fig. 1), AD8642, in a surface mount package, positioned as close to the voltage electrodes as possible (4 in Fig. 3) and provided with guard rings for the input pins to eliminate current leakage. The buffer input impedance of the order of a T completely eliminates electrode effects allowing, in addition, the measurements of very high sample resistances. Although at elevated working temperatures the input bias current of the buffer increases, over our temperature range it is smaller than pA,ad8642 giving a negligible electrode polarization even at 70∘C. The buffer amplifier does not perform voltage subtraction (each voltage electrode had its own independent buffer channel); this was done with the lock-in differential input due to a very high specified CMRR. A SR830 digital lock-in amplifier from Stanford Instruments was used to measure voltages at the voltage electrodes, while the current was supplied with a Keithley 6221 AC current source. Such a setup eliminated the need for additional current measuring circuitry and increased cell simplicity, while also providing straightforward and precise sample impedance determination. With this instrumentation we were able to measure impedance through six decades in frequency ( Hz to kHz, the limits being due to prohibitively long filtering times at the lower end).
III Assessment and discussion
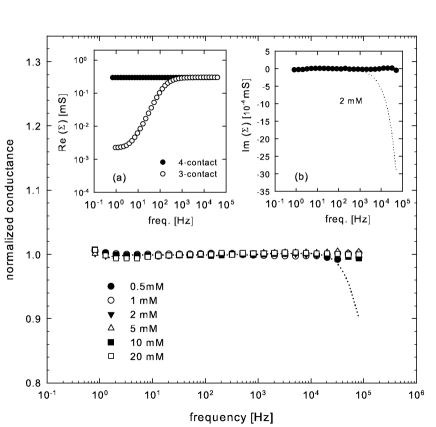
Before any test measurements were made we identified the characteristic of our setup without the sample chamber (raw data shown as a dotted line in Fig. 4) as is common procedure in impedance spectroscopy. The raw spectrum is flat up to kHz, but for higher frequencies deviations are observed. Careful analysis revealed that they are a consequence of deficiencies in the synchronization signal between instruments (Keithley 6221 current source and SR830 lock-in) at higher frequencies, and we found that this is highly reproducible for this particular choice of instruments. Accordingly, all subsequent measurements results were adjusted to account for these instrument–induced deviations.
The cell was tested and calibrated using standard potassium chloride water solutions in a wide conductivity range. On the calibration graphs for the conductivity (Fig. 4) it can be clearly seen that there are almost no spurious effects in the spectra; their flatness is typically better than 1% over five decades in frequency. This is in stark contrast to two-electrode measurements, and for comparison we include a spectrum obtained by measuring the voltage on one voltage electrode (‘three-electrode’ configuration, Fig. 4 insert (a)) which is similar to a two-contact spectrum (in a real two-contact measurement the electrode polarization effects would be larger for another factor of two). The imaginary part of the conductance was much more difficult to measure accurately due to the fact that it is, in this case, orders of magnitude smaller than its real counterpart. This problem might be reduced by using a lock-in amplifier with an incorporated compensation. A typical imaginary part spectrum is shown in insert (b) of Fig. 4, including the raw data without any setup compensation (dotted line).
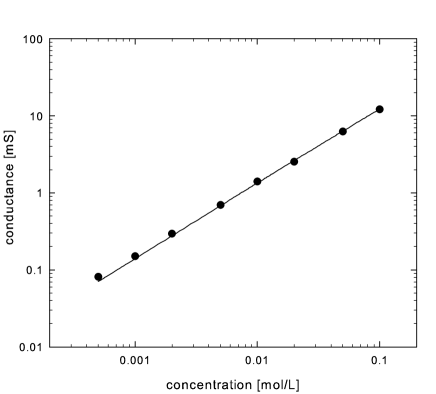
The plot of potassium chloride solution conductivity against solution concentration (Fig. 5) proves that the cell constant does not depend on the sample resistance, justifying the validity of our planar layout. The cell constant was calculated to be mm using conductivity values from the literatureCRC and is in good agreement with the true cell layout, main source of error being the sample volume uncertainty. To minimize possible electrolytic and nonlinear effects at low frequencies we were careful to always keep the voltages across the sample smaller than 10 mV, with corresponding currents in the A range. Linearity was confirmed by checking the second and third harmonic signal levels (which were always below the noise level) and the uniform conductivity at low frequencies so we can conclude that electrolytic effects were negligible.
Although providing a simple measurement arrangement, the main drawback of our cell is the aforementioned problem with reduced sensitivity in the imaginary part of the conductivity. A second issue is the sample geometry; if the sample is not fairly symmetrically placed on the electrodes, artefacts will appear in the spectra. We tried to minimize this by making the sample compartment roughly quadratic and providing edges to keep a liquid drop in place with surface tension. This works out fine for water solutions, but low surface tension samples tend to spill and ruin the geometry. This problem was amended by adding a quadratic polycarbonate liquid holder inside the sample compartment, with a net volume of 73 L. Low surface tension liquids could then be made to fill the polycarbonate compartment completely. However, for aqueous samples, which are generally more problematic due to electrode polarization (and thus more sensitive to geometry) better results were obtained by using channel edges to hold the liquid in place instead of the polycarbonate walls.
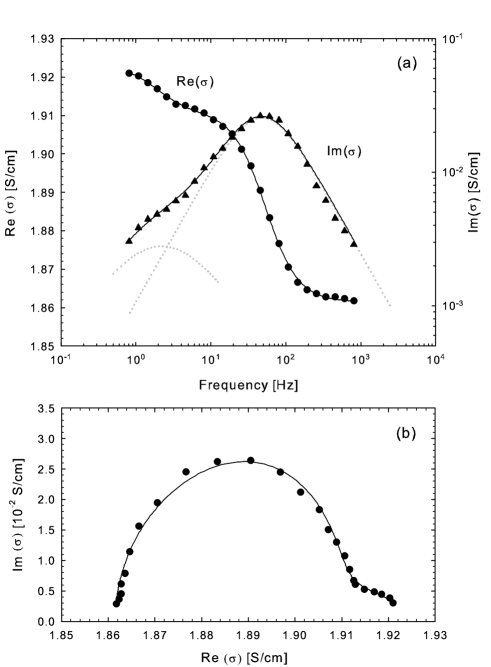
To illustrate the possibilities for application of such a cell, we perform a measurement of the conductivity spectrum of an aqueous solution of pig skin gelatin (Sigma-Aldrich, type A, Bloom 300). The gelatin solution was prepared by dissolving in deionized water and stirring at 60∘C for 2 hours. Fig. 6 shows the conductivity spectrum of a % gelatin solution in water at 13∘C. In this experiment two low-frequency conductivity relaxation processes are revealed for the first time, and they can be clearly resolved in both the real and imaginary parts. The experimental data was fitted to a superposition of two Cole-Colecolecole relaxations in the conductivity spectrum yielding an accurate fit.
The shape of the curves (the real part of the conductivity decreases near the relaxation frequency, while we would expect it to increase in a dielectric process) and comparison of our data with other techniques (light scatteringanomalous_diffusion and diffusion NMRdiffusionNMR ) suggests that we are able to detect the translational diffusion of the charged gelatin chains; the chain contribution to the conductivity is turned off at the relaxation frequency because the field is varying too quickly for them to follow it. We believe that the faster relaxation process corresponds to chain segment fluctuations while the slower process is due to whole chain reptation, in agreement with conclusions from light scattering experiments.111Detailed account to be published elsewhere. We emphasize that a direct measurement of the charged chain diffusion is a result of our measurement method which avoids problems due to the polarization effects; the height of the relaxation is in this case only about 1% of the asymptotic conductivity of the sample and would thus be unattainable using a standard two-contact cell and signal analysis methods (e.g. fitting a superposition of an electrode polarization model and two Cole-Cole relaxations).
IV Conclusion
In conclusion, we have presented a small volume four-contact impedance spectroscopy cell for use primarily with ionic water solutions. The low frequency range ( Hz) opens up possibilities not accessible to standard two-contact impedance spectroscopy, including the observation of large scale motions of polyelectrolytes (as we have demonstrated with a gelatin-water solution) useful for a wide range of biologically and industrially interesting systems. Besides protein and polypeptide solutions, notable possible applications are DNA, hyaluronic acid and similar biological polyelectrolytes, charged polymers like xanthan, protein aggregations and even larger structures like emulsions or amphiphylic systems. Due to the simplicity and small size, we believe that our cell represent a convenient device/tool for investigating such systems with low frequency impedance spectroscopy.
Acknowledgements.
We are pleased to acknowledge the assistance of prof. dr. sc. Miroslav Požek, dr. sc. Tomislav Vuletić, dr. sc. Nataša Šijaković-Vujičić and prof. dr. sc. Amir Hamzić. This work was partially funded by the Croatian MZOS Projects 119-1191458-1023 and 119-1191458-1022, and UKF project number 55.References
- (1) Broadband Dielectric Spectroscopy, edited by F. Kremer and A. Schönhals (Springer, 2002).
- (2) R. Hayakawa, H. Kanda, M. Sakamoto, and Y. Wada, Jpn. J. Appl. Phys. 14, 2039 (1975).
- (3) J. B. Bates, Y. T. Chu, and W. T. Stribling, Phys. Rev. Lett. 60, 627 (1988).
- (4) H. Sanabria and J. H. Miller, Phys. Rev. E 74, 051505 (2006).
- (5) F. Pizzitutti and F. Bruni, Rev. Sci. Istrum. 72, 2502 (2001).
- (6) B. A. Mazzeo and A. J. Flewitt, J. Appl. Phys. 102, 104106 (2007).
- (7) A. D. Hollingsworth and D. A. Saville, J. Colloid Interface Sci. 257, 65 (2003).
- (8) S. Tomić, S. Dolanski-Babić, T. Vuletić, S. Krča, D. Ivanković, L. Griparić, and R. Podgornik, Phys. Rev. E 75, 021905 (2007).
- (9) C. Prodan, F. Mayo, J. R. Claycomb, and J. H. Miller, J. Appl. Phys. 95, 3754 (2004).
- (10) H. P. Schwan and C. D. Ferris, Rev. Sci. Instrum. 39, 481 (1968).
- (11) J. C. Bernengo and M. Hanss, Rev. Sci. Instrum. 47, 505 (1976).
- (12) D. F. Myers and D. A. Saville, J. Colloid Interface Sci. 131, 448 (1989).
- (13) J. R. Macdonald, Electrochim. Acta 35, 1483 (1990).
- (14) Analog Devices, Low Power, Rail-to-Rail Output, Precision JFET Amplifiers, AD8642 datasheet, Rev. C (2010).
- (15) CRC Handbook of Chemistry and Physics, 84th Edition, edited by D. R. Lide (CRC Press, 2004).
- (16) K. S. Cole and R. H. Cole, J. Chem. Phys. 9, 341 (1941).
- (17) S. Z. Ren, W. Shi, W. B. Zhand, and C. M. Sorensen, Phys. Rev. A 45, 2416 (1992).
- (18) T. Brand, S. Richter, and S. Berger, J. Phys. Chem. B 110, 15853 (2006).
- (19) Detailed account to be published elsewhere.