Photometric determination of the mass accretion rates of pre-main
sequence stars. II.
NGC 346 in the Small Magellanic
Cloud **affiliationmark:
Abstract
We have studied the properties of the stellar populations in the field of the NGC 346 cluster in the Small Magellanic Cloud, using a novel self-consistent method that allows us to reliably identify pre-main sequence (PMS) objects actively undergoing mass accretion, regardless of their age. The method does not require spectroscopy and combines broad-band and photometry with narrow-band imaging to identify all stars with excess H emission and derive the accretion luminosity and mass accretion rate for all of them. The application of this method to existing HST/ACS photometry of the NGC 346 field has allowed us to identify and study 680 bona-fide PMS stars with masses from M⊙ to M⊙ and ages in the range from Myr to Myr. Previous investigations of this region, based on the same data, had identified young ( Myr old) candidate PMS stars on the basis of their broad-band colours. In this study we show that there are at least two, almost equally numerous, young populations with distinct ages of respectively and Myr. We provide for all of them accurate physical parameters.
We take advantage of the unprecedented size of our PMS sample and of its spread in mass and age to study the evolution of the mass accretion rate as a function of stellar parameters. We find that, regardless of stellar mass, the mass accretion rate decreases with roughly the square root of the age, or about three times slower than predicted by current models of viscous disc evolution, and that more massive stars have systematically higher mass accretion rate in proportion to their mass. A multivariate linear regression fit reveals that , where is the age of the star, its mass and a quantity that is higher at lower metallicity. This result is consistent with measurements of the mass accretion rate in the 30 Dor region and in the Milky Way and suggests that longer duration for mass accretion could be related to lower metallicity. The high mass accretion rates that we find suggest that a considerable amount of mass is accreted during the PMS phase, of order M⊙ or possibly of the final mass for stars with mass M⊙ if their discs are eroded by 20 Myr, i.e. before they reach the main sequence. Therefore, PMS evolutionary models that do not account for this effect will systematically underestimate the true age when compared with the observations.
Subject headings:
accretion, accretion disks – stars: formation – stars: pre-main-sequence – Magellanic Clouds1. Introduction
NGC 346 is presently the region of most intense star formation in the entire Small Magellanic Cloud (SMC). It contains over 30 O type stars (Massey, Parker & Garmany 1989; Evans et al. 2006) that ionise the N 66 nebula, the largest HII region in the SMC (Henize 1956). The presence of these very young ( Myr) massive stars in NGC 346 has long been established with ground-based spectroscopy (e.g. Walborn 1978; Walborn & Blades 1986; Niemela et al. 1986; Massey et al. 1989), but more recently also very young stars of low mass have been detected. Observations with the Hubble Space Telescope and Spitzer Space Telescope have revealed respectively a multitude of pre-main sequence (PMS) star candidates down to the subsolar mass (Nota et al. 2006; Sabbi et al. 2007; Gouliermis et al. 2007; Hennekemper et al. 2008) and a large number of candidate young stellar objects (YSO) with masses as low as M⊙ (Bolatto et al. 2007; Simon et al. 2007).
What makes NGC 346 and the surrounding regions particularly interesting is that they allow us to study the properties of star formation in a nearby galaxy with a metallicity similar to those in place in the high redshift universe at . The distance modulus for the SMC is corresponding to kpc (Hilditch et al. 2005; Keller & Wood 2006), whereas the currently accepted values for its metallicity range from to Z⊙ (see Russell & Dopita 1992; Rolleston et al. 1999; Lee et al. 2005; Perez–Montero & Diaz 2005). Moreover, besides this recent burst, previous star formation episodes have been detected in this area. Heap et al. (2006) and Mokiem et al. (2006) reported the presence of massive stars with an age of Myr, while Massey et al. (1989) discovered five red supergiants and two B type supergiants that form a spatially distinct subgroup located about SW of the centre of NGC 346 and that have an estimated age of Myr. More recently, Sabbi et al. (2007) detected a small star cluster, located about or pc NE of the centre whose colour–magnitude diagram (CMD) is compatible with an age of Myr. Finally, older populations are also present: Sabbi et al. (2007) find evidence for star formation in this region dating as far back as Gyr with a moderate enhancement Myr ago. In addition, an intermediate-age cluster, BS 90, is also present in the field, with an age of Gyr.
It is not easy to establish whether there is any relationship between the very old generations in this field and the more recent star formation episodes. However, it is interesting to investigate whether the Myr old massive stars of Massey et al. (1989) and the Myr old small cluster of Sabbi et al. (2007), although spatially unrelated to one another, could be the precursors of the 30 young massive O type stars and of the recently detected PMS stars and YSO in this region. It is conceivable that a large number of these Myr old objects are actually present in NGC 346, many more than those known so far, but that they could belong to a more diffuse population spread throughout the region because of appreciable velocity dispersion motions and, therefore, might not be easy to identify. If the members of such a Myr old population could be detected, including those of low mass, their spatial distribution and physical properties would allow us to understand whether and how they may have triggered the most recent bursts, as theories of sequential star formation suggest (e.g. Elmegreen & Lada 1977).
The task of detecting a Myr old population in a region heavily contaminated by older field stars and younger objects might appear daunting. Hennekemper et al. (2008) attempted to study the presence of an age spread in the PMS population of NGC 346 through the analysis of the CMD. They showed that the observations are in principle compatible with an upper limit of Myr to the age, but they concluded that differential reddening and unresolved binaries could be at the origin of the observed colour spread.
Actually, if these objects have not yet completed their pre-main sequence (PMS) phase, it should be possible to detect them through the distinctive excess emission features in their spectra that originate from the accretion process, particularly in the UV continuum and in recombination lines such as H, Pa and Br (e.g. Calvet et al. 2000). Although in nearby star forming regions the fraction of PMS stars with discs appears to decline quite rapidly during the first 10 Myr (e.g. Haisch, Lada & Lada 2001; Fedele et al. 2010), there is evidence that sustained mass accretion is present also in objects older than this age, particularly above 1 M⊙ . This is the case for instance of Tr 37 where Sicilia–Aguilar et al. (2006) find G-type dwarfs still accreting at ages in excess of 10 Myr. In the more distant ( kpc) and massive Galactic star forming region NGC 3603 Beccari et al. (2010) recently found a conspicuous number of PMS stars older than 10 Myr still undergoing mass accretion. In even more distant and dense stellar fields, where spectroscopy of individual stars is limited to the brightest members, Romaniello (1998), Panagia et al. (2000) and Romaniello, Robberto & Panagia (2004) have shown that objects undergoing active mass accretion can be efficiently detected with accurate multi-colour photometry and have identified in the regions around SN 1987A about 500 PMS stars with H equivalent width in excess of 8 Å and with an age of Myr. More recently, De Marchi, Panagia & Romaniello (2010, hereafter Paper I) showed that through a suitable combination of broad- and narrow-band photometry it is also possible to derive the mass accretion rate of these objects, with an accuracy comparable to that allowed by spectroscopy.
In this work, we build on the method developed in Paper I to securely identify bona-fide PMS objects in dense stellar fields and apply it to the high-quality HST photometry of the NGC 346 region (Sabbi et al. 2007). Our goal is to measure the physical properties of these objects and study how they depend on age, in order to understand how star formation has proceeded in this area over the past Myr. The paper is organised as follows: in Section 2 we briefly describe the observations and address how we correct for differential reddening, whereas Section 3 is devoted to the identification of PMS stars via their H excess emission and on the determination of their H luminosity. In Section 4 we derive the other important physical parameters for these objects, including age, mass and mass accretion rate, while in Section 5 we study how the latter evolves in time, how it could affect stellar evolution, and we compare the results to those for similar objects in the Milky Way and Large Magellanic Cloud. A summary of the most important conclusions of the paper is offered in Section 6.
2. The observations
The observations used in this work were collected with the Wide Field Channel of the Advanced Camera for Surveys (Ford et al. 2003) on board the Hubble Space Telescope in 2004 July as part of proposal GO–10248 (with Antonella Nota as principal investigator). The data and their reduction were extensively described in Sabbi et al. (2007), to which we refer the reader for details. In summary, the observations of interest here cover an area of on a side centered on the cluster NGC 346 in the Small Magellanic Cloud (SMC), at RA, DEC= (J2000), itself immersed in N 66, the largest and brightest HII region in the SMC.
The data comprise both deep and short exposures in the broad bands F555W (hereafter ) and F814W (hereafter ), as well as observations in the 80 Å wide band F658N (hereafter H), which were not described in Sabbi et al. (2007). The total combined exposure times in each band are, respectively, 4 148 s, 4 124 s and 1 542 s. The data reduction in the and bands was carried out by Sabbi et al. (2007) using a combination of PSF fitting and aperture photometry and their final catalogue, in the central of interest here, includes about 53 550 stars reliably detected (at the level) in and . As regards the H band, we have adopted the same combination of PSF fitting and aperture photometry to search for and measure all objects with a signal in the central pixel exceeding the local background level by at least 3 times the standard deviation of the latter (i.e. detection). Of all the stars detected in the and bands, about 19 800 satisfy this condition also in the H band.
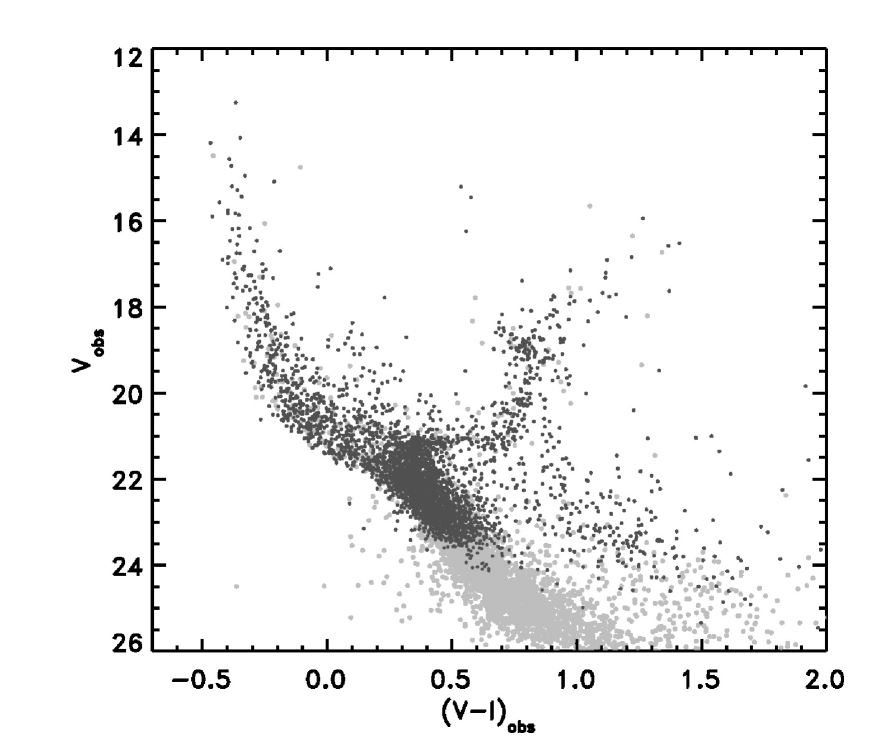
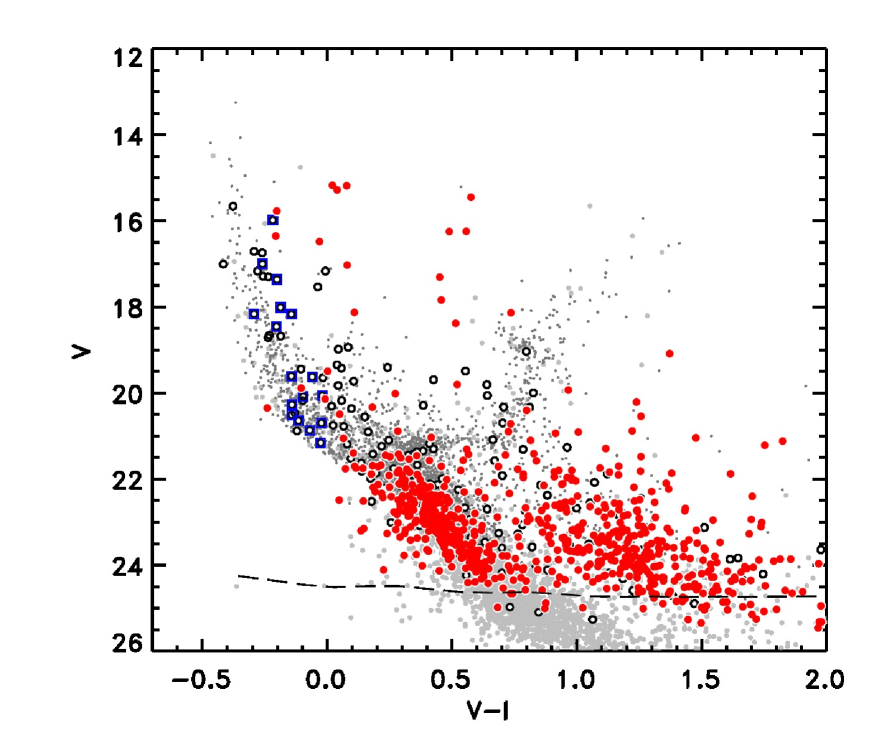
We show in Figure 1 the resulting colour–magnitude diagram (CMD) of all the stars in the selected field as light grey dots and with darker symbols stars whose mean error in the three bands does not exceed mag, where
| (1) |
and , and are the photometric uncertainties in each individual band. A total of stars satisfy this condition, with the most stringent constraint being set by the uncertainty in the H band.
The CMD, as already discussed by Nota et al. (2006), Gouliermis et al. (2006; 2007) and Sabbi et al. (2007), reveals the presence in this field of both young and old populations. The former includes the massive stars on the pronounced upper main sequence (MS) and for the candidate PMS objects to the right of and brighter than the lower MS, while the latter accounts for the lower MS and for the sub-giant and red giant branches (SGB, RGB). In general, however, it is not possible to classify an object as being young or old just on the basis of its position on the CMD, not only because there are regions such as the lower MS that are common to both populations, but also because there is evidence for variable reddening in the field, as Sabbi et al. (2007) already pointed out and as one can see from the conspicuous broadening of the upper MS in Figure 1.
Differential reddening makes it particularly difficult to understand the true nature of the large group of objects below the SGB and redder than the MS. While their colours and magnitudes, as originally pointed out by Nota et al. (2006), are compatible with those of young PMS stars, depending on the amount of reddening and on the specific extinction law for this field, some of them may in reality be reddened MS or SGB stars. Furthermore, even if all these objects were PMS stars, without accounting for differential reddening one could not properly assign to them a mass and age through the comparison with PMS evolutionary tracks (see e.g. Hennekemper et al. 2008). It is therefore important to address the issue of differential reddening and to correct the photometry accordingly, to the extent possible. We do so in the following section.
2.1. Reddening correction
Sabbi et al. (2007) concluded that the young population in this field, corresponding to the upper MS, is compatible with an age of Myr. Therefore, one can determine the reddening towards each of those stars if one assumes that they are all MS objects and one looks at their colour and magnitude displacement with respect to a theoretical isochrone for an age of 4 Myr, a metallicity of and a distance modulus of (see Introduction). Hennekemper et al. (2008) followed a similar approach to derive an extinction map for this region, albeit with a set of isochrones for a higher metallicity (). We note here that although the metallicity that we adopt, , is at the lower end of the currently accepted values for the SMC (see Introduction), it appears better suited to describe the properties of young PMS stars, as we will show in Section 4.
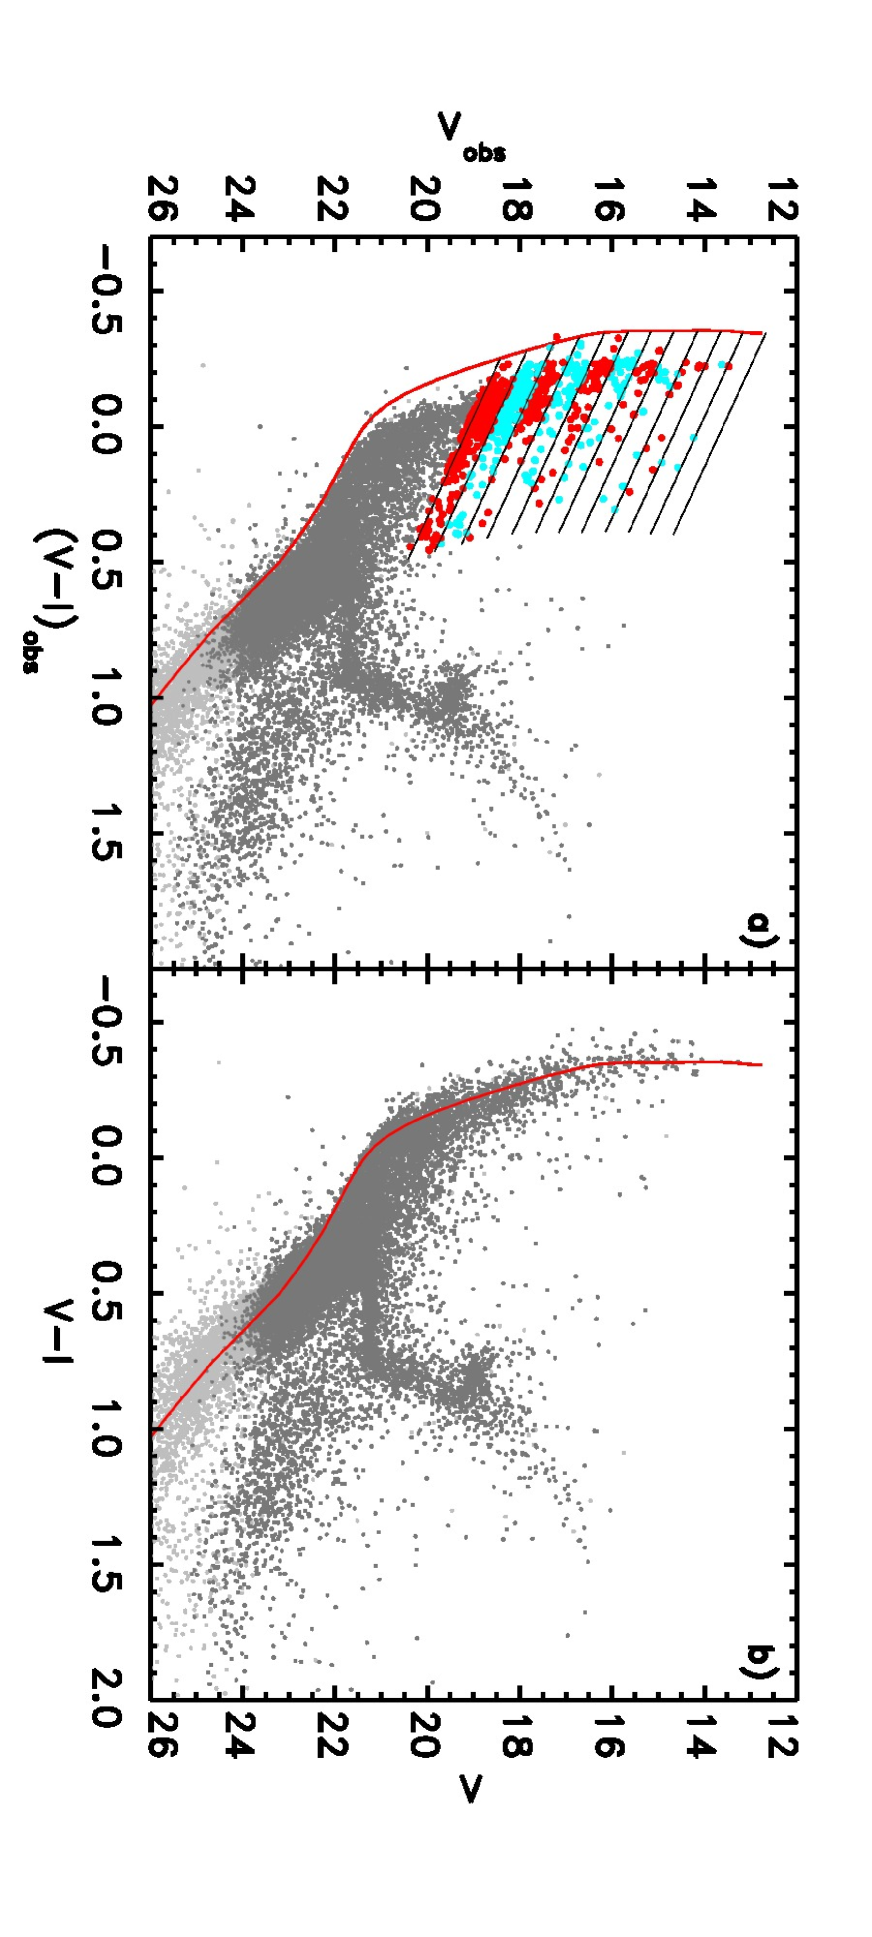
As for the extinction law in this field, we decided to use the one derived by Scuderi et al. (1996) for the field of SN 1987A in the Large Magellanic Cloud, rather than the Galactic law as adopted by Hennekemper et al. (2008), in light of the more similar metallicity. The total extinction values for the specific HST filters used here were derived by averaging over the entire bandpass the dust attenuation (), as explained in Romaniello et al. (2002). The solid lines cutting through the upper MS in Figure 2a correspond to the reddening vectors drawn from a 4 Myr old isochrone for (Marigo et al. 2008), in steps of mag for stars brighter than . The length of the lines corresponds to . A total of about 600 stars selected in this way and bluer than are marked with thicker symbols in Figure 2a. The corresponding reddening distribution ranges from to (respectively 17 % and 83 % limits corresponding to values of and ), with a median value of or , indicating that a considerable spread in reddening is present in this field.
We have used the reddening values towards each of the selected upper MS stars to derive a reddening correction for all other objects in their vicinities. The analysis of the H image indicates that the typical scale of the brightness fluctuations is of order radius. We have therefore assumed that stars projected within this region have similar extinction, even though we have no information on the depth of their distribution nor on the uniformity of the absorbing material. In order to validate the procedure, we first applied the reddening correction to the upper MS stars themselves, using for each object the average of the extinction values of at most 20 other upper MS stars within of their location. We took the straight average without weighting them for the distance from the object, since we have no information on the distribution of the stars along the line of sight. We found that the average and standard deviation of the reddening distribution derived with the nearest neighbours are in excellent agreement with those measured directly, namely . This has convinced us that the average reddening value measured in a small area surrounding each star can be used to correct for extinction. Objects with no reference upper MS stars within were assigned the average reddening value of all reference stars ().
The upper MS corrected in this way appears considerably tighter in the CMD than the raw data (see Figure 2b) and this convinced us that the method, albeit statistical in nature, can be applied to the entire data set. We also experimented with a different number of neighbours, namely 5, 10, 20 and 50. We found that, by using the 20 nearest upper MS stars, the red clump (RC) feature in the red giant branch of old ( Gyr) in the CMD at appeared the tightest. Since our goal is to correct for reddening all candidate PMS stars, which are typically red, this choice seemed the most appropriate. The de-reddened CMD obtained in this way is shown in Figure 2b.
3. Identifying the pre-main sequence stars
One of the characteristic signatures of the accretion process on to PMS stars is the presence of excess emission in H (see e.g. Calvet et al. 2000). Recently, we showed in Paper I that PMS stars undergoing active accretion can be reliably identified, and their H luminosity measured, by using a combination of broad-band () and narrow-band (H) photometry, with no need for spectroscopy. This way of identifying PMS stars is more accurate and reliable than the simple classification based on the position of the objects in the Hertzsprung–Russell diagram, i.e. stars placed well above the main sequence (e.g. Gilmozzi et al. 1994; Hunter et al. 1995; see in particular Nota et al. 2006 and Gouliermis et al. 2007 for the specific case of NGC 346). The true advantages of the method presented in Paper I are that: (i) it allows us to discriminate between bona-fide PMS stars and interlopers that occupy the same region of the CMD; (ii) it provides a secure detection of relatively old PMS stars, already close to their MS, whose colours and magnitudes would otherwise be indistinguishable from those of MS stars; (iii) by measuring the luminosity of these PMS stars we can obtain their mass accretion rates from and the stellar parameters (mass and radius); (iv) finally, this approach is more practical, efficient and economical than slitless spectroscopy for studying PMS stars in dense star forming regions, although it cannot provide constraints for magnetospheric accretion models that require information on the profile of the H emission line (e.g. Muzerolle et al. 2001).
As explained in detail in Paper I, the method hinges on the simple consideration that, at any time, the largest majority of stars of a given effective temperature in a stellar population will have no excess H emission. Therefore, for stars of that effective temperature, the median value of any colour index involving H (e.g. ) effectively defines a spectral reference template with respect to which the H colour excess should be sought.
In Figure 3 we show with small dots the colour as a function of for all 18 764 stars that have a combined photometric uncertainty mag (see Equation 1). The value of is dominated by the uncertainty on the H magnitude, while the median value of the uncertainty in the other two bands is and , respectively.
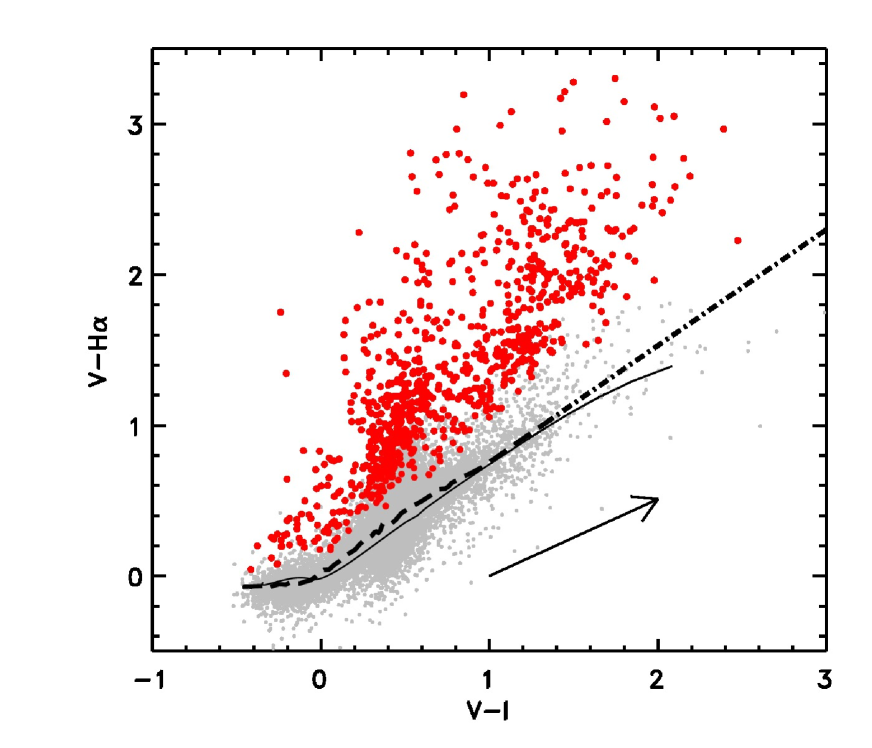
The thick dashed line in Figure 3 represents the median colour obtained as the running median with a box-car size of 100 points. The thin solid line shows the colours in these filters for the model atmospheres of Bessell et al. (1998). As discussed in Paper I, the mag discrepancy between models and observations around is most likely due to the coarse spectral sampling of the H line in the models. Where the density of observed points decreases considerably, at , we reduced the box-car size to 10 points and the result is shown by the thick dot-dashed line (which is extrapolated for ). A total of 891 objects have a index exceeding that of the reference template (i.e. the photospheric colour) at the same colour by more than four times the uncertainty on their values.
The arrow in the figure corresponds to the reddening vector for or for the specific bands used in this study, derived from the extinction law of Scuderi et al. (1996). The fact that the arrow is almost parallel to the reference template implies that even relatively large uncertainties in the reddening correction would not significantly affect the selection of stars with H excess. On the other hand, it is possible that for some objects surrounded by non homogeneous nebular emission the H excess that we measure is spurious. We explain in Section 3.1 how we have removed these objects from our list.
3.1. Nebular contamination
The effects of nebular contamination on the detection of stars with H excess emission are addressed in detail in Paper I (and in Beccari et al. 2010), to which we refer the reader. We show there that gas emission acts like a “pedestal,” or an additional source of background. As such, it does not affect our photometry because it increases the measured flux in the same way both inside the central aperture and inside the background annulus used for the determination of the sky level. Therefore the gas emission is automatically removed in the sky subtraction procedure. If the diffuse emission is strong compared to the intensity of the objects, the uncertainty on the flux of the star will be larger, but this is fully taken into account in our photometry.
A possible complication, not discussed in Paper I, arises when the nebular emission is not homogeneous across the field. For example, when a filamentary structure in the nebular gas overlaps with a star, the magnitude of the star can be affected in different ways. If the filament is wider than the diameter of the annulus that we use to measure the local background, this only results in a higher photometric uncertainty, because we fall in the case explained above for diffuse emission. The situation is more complex when the filament only partly covers the background annulus (which in our case extends from 3 to 5 pixel radius around the object) and/or the central star (for which an aperture of 2 pixel radius is used), since in those cases the signal from the star and/or the background could be incorrectly determined.
We, therefore, inspected the H image around the location of all stars with an apparent H excess. In order to enhance the contrast between neighbouring pixels in the image, we applied an unsharp-masking filter (e.g. Malin 1977) to the H frame, with a smoothing radius of 10 pixel meant to subtract the low-frequency signal, i.e. structures in the image with a characteristic scale larger than the size of our background annulus. Unsharp masking makes structures and filaments in the nebular gas easier to see than in the direct image. In this way we compared the structures and filaments with the positions of the stars with Halpha excess emission (see Beccari et al. 2010 for an application of this method to the case of NGC 3603). We adopted a very conservative approach and excluded from our PMS candidate list all stars whose photometric background annulus is partially covered by a gas filament. In total, about 70 stars were excluded in this way, or less than 10 % of the original population (an additional 30 stars were excluded because they are closer than 10 pixels to the image edges in the Halpha frame, although their magnitudes are well defined in the other bands).
A total of 791 objects are left after this conservative selection and they are indicated with large dots in Figure 3 (shown in red in the on-line version) and, in light of their excess at the level, they are excellent PMS candidates. As we shall see later, most of them are indeed bona-fide PMS stars.
3.2. H luminosity
Following the detailed procedure outlined in Paper I, we can derive the H emission line luminosity for these stars from the colour corresponding to the excess emission, namely:
| (2) |
where the superscript obs refers to the observations and ref to the reference template. is then obtained from , from the photometric zero point and absolute sensitivity of the instrumental set-up and from the distance to the sources. The assumed distance modulus is (see Introduction), whereas the photometric properties of the instrument are as listed in the ACS Instrument Handbook (Maybhate et al. 2010). The derived median luminosity of the 791 objects with H excess at the level is erg/s or L⊙. This value is similar to that of a group of 189 stars with H excess emission in the field of SN 1987A that were studied in Paper I with the same method applied to HST Wide Field Planetary Camera 2 data. The uncertainty on is typically % and is completely dominated by the statistical uncertainty on the H photometry (10 %), while the distance accounts for 5 % (Hilditch et al. 2005; Keller & Wood 2006) and the absolute sensitivity of the instrumental setup for another 3 %.
Owing to the rather wide passband of the F658N filter, includes a small contribution from the [NII] emission features at Å and Å. Even though such a contribution is small (see Paper I, where the effect is explained in detail), it is a good practice to correct for it as it is a systematic effect. The adopted average correction factor to the intensity for the ACS F658N filter, based on the spectra of classical T Tauri stars is .
3.3. H equivalent width
Besides the luminosity of the H emission line, also its equivalent width can be derived from our photometry. To this aim, as shown in Paper I, we used the model atmospheres of Bessell et al. (1998) to derive the magnitude corresponding to the sole continuum in the H band from the and magnitudes. The corresponding relationships, properly validated by comparison with spectro-photometric measurements, are listed in the Appendix of Paper I and allow us to derive from the H magnitude via the equation:
| (3) |
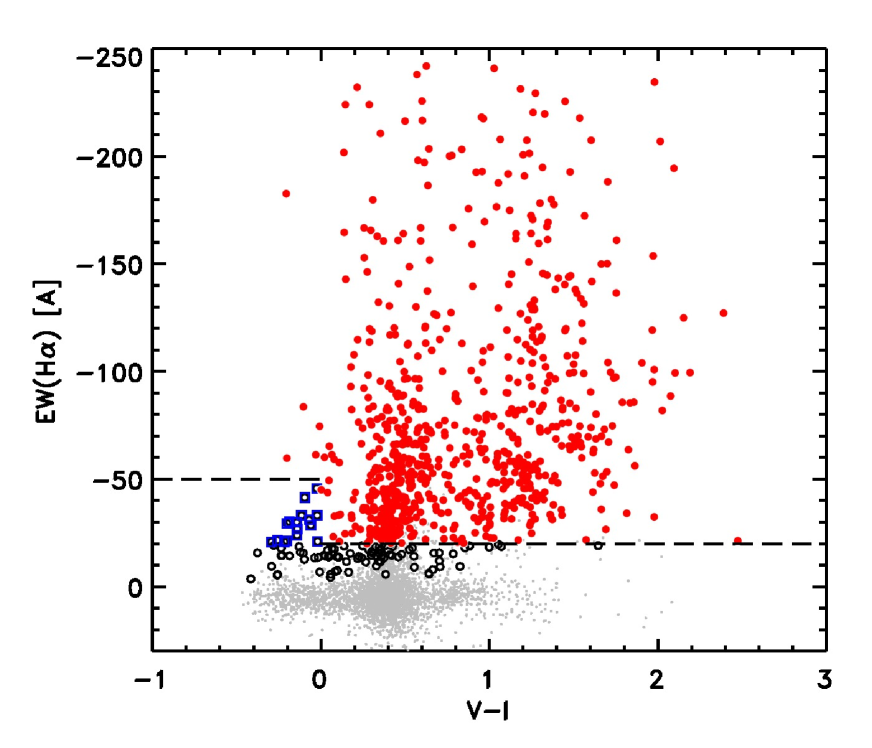
where is the rectangular width of the filter (similar in definition to the equivalent width of a line), which depends on the characteristics of the filter and corresponds to Å for the F658N filter used here. The equivalent widths obtained in this way are shown in Figure 4 as a function of the colour. The 791 stars with a H excess are indicated with thicker symbols (circles and squares). We take as bona-fide PMS stars all those with Å, indicated as thick dots (in red in the online version), corresponding to a total of 694 stars. Note that, as customary, negative values of the equivalent width indicate emission lines. Since at temperatures K or colours the sample could be contaminated by Be stars that are evolving off the MS, there we set a more stringent condition on the equivalent width, namely Å. This limit is suggested by a survey of the H equivalent width of about 100 Be stars in the Galaxy (Coté & Waters 1987) in which only one star is found with Å and the largest majority have values in the range from Å to Å. In fact, as we discuss in Section 4, all the objects with K and an H excess above are most likely PMS objects with masses around 3 M⊙ .
Although we do not have spectroscopic observations of our stars to directly confirm our photometrically inferred equivalent widths, similar studies in the literature have demonstrated the success of this approach. White & Ghez (2001) carried out a detailed study of 44 T Tauri stars in binary systems in Taurus–Auriga, using both photometry and spectroscopy with the HST. Their analysis shows that photometric and spectroscopic measurements of the equivalent width of the H emission line in these objects are in good agreement with one another. More recently, Barentsen et al. (2011) carried out a H survey of T Tauri stars in IC 1396, a region with considerable nebular emission. Their photometric determination of for 109 objects in common with the spectroscopic survey of Sicilia–Aguilar et al. (2005) also shows an excellent agreement, particularly for stars with Å, which are the objects of interest in our study.
4. Physical parameters of the pre-main sequence stars
When the bona-fide PMS objects identified in the previous section are placed on the CMD (see Figure 5), they clearly reveal two distinct groups made up of a similar number of objects. One is located above (i.e. brighter and redder than) the MS and thus is indicative of a population of young PMS objects. This population was originally noticed by Nota et al. (2006) and later studied by Gouliermis et al. (2007) and Sabbi et al. (2007), although these earlier works could only identify candidate young ( Myr) PMS stars since no information was available to verify and characterise the PMS nature of each individual object. This is the reason why the works above could not identify the second group of bona-fide PMS objects, which overlap in the CMD with older MS stars in the field of the SMC. Hennekemper et al. (2008) detected some of these objects using a preliminary version of the colour transformations between , and that we developed for Paper I to search for stars with excess in this field, but they did not realise what was the nature of these objects. As we show here below, these objects are older PMS stars with an age in excess of Myr, of the same type as those that we discovered in the field around SN 1987A in the LMC (see Paper I).
The physical parameters of the bona-fide PMS stars that we have identified are obtained as explained in the following.
4.1. Masses and ages
The radius comes from the luminosity and effective temperature of the stars, which in turn follow from the observed colour and magnitude (), properly corrected for interstellar extinction as explained in Section 2.1. The stellar mass and age were derived by comparing the location of each star in the Hertzsprung–Russell (H–R) diagram of Figure 6 with the PMS evolutionary tracks and corresponding isochrones, via interpolation over a finer grid than the one shown in the figure. We followed the interpolation procedure developed by Romaniello (1998), which does not make assumptions on the properties of the population, such as the functional form of the IMF. On the basis of the measurement errors, and taking into account its position in the H–R diagram, this procedure provides the probability distribution for each individual star to have a given value of the mass and age (the method is conceptually identical to the one presented recently by Da Rio et al. 2010).
As for the theoretical models, we adopted those of the Pisa group (Degl’Innocenti et al. 2008; Tognelli et al. 2011), for metallicity or about . These new PMS tracks were specifically computed for the mass range from M⊙ to 5 M⊙ with an updated version of the FRANEC evolutionary code (see Chieffi & Straniero 1989 and Degl’Innocenti et al. 2008 for details and Cignoni et al. 2009 for an application).
As mentioned in the Introduction, we opted for a lower value of the metallicity, namely in place of the more customarily adopted , because the corresponding tracks provide a better match to the observations, particularly where they reach the MS. As previously mentioned, is still compatible with the metallicity range found in the literature for the SMC and is in any case better suited to NGC 346 than the value adopted in previous studies of its PMS population that made use of the evolutionary tracks of Siess et al. (2000) for .
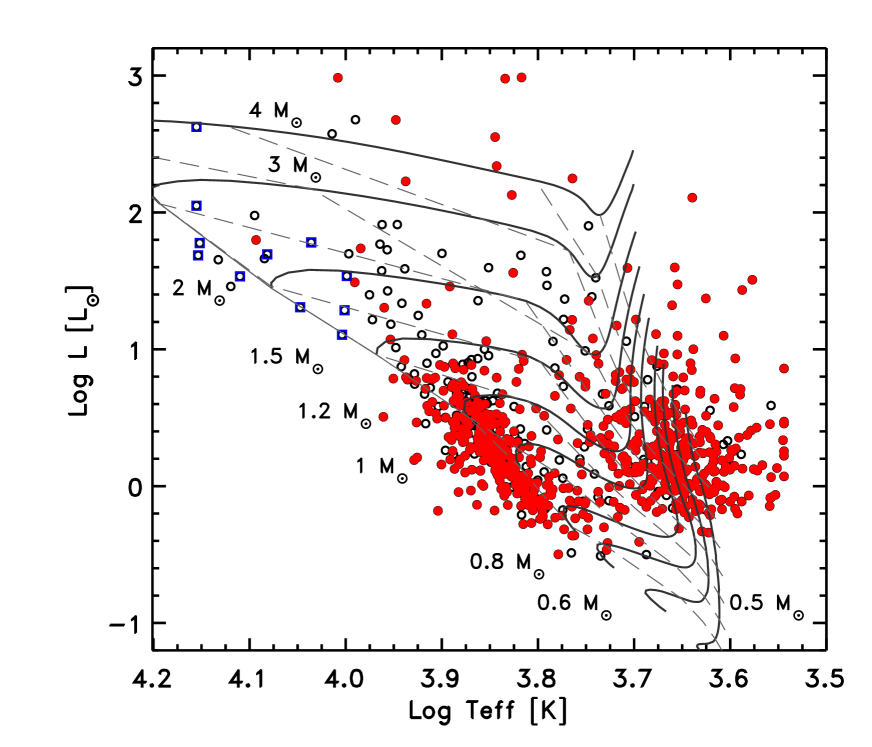
Figure 6 reveals that the masses of the bona-fine PMS stars span over a decade, from M⊙ for the coolest objects to M⊙ for the hottest ones. As mentioned above, some of the objects with K and Å could be Be stars and we have marked all objects of this type with squares to distinguish them from the rest. Figure 6 also provides a more quantitative characterisation of the age difference between the two populations of PMS stars that we identified earlier in the CMD (Figure 5). The isochrones in the figure, corresponding from right to left to ages of , , , 1, 2, 4, 8, 16 and 32 Myr, show that the young population has a median age of Myr, whereas the older bona-fide PMS stars span a wider age range from Myr to 30 Myr, with a broad peak around 20 Myr.


We derived a reliable measure of the mass and age for all stars indicated as thick dots in Figure 6, except for the coolest objects that would have required a more uncertain extrapolation beyond the limits of the theoretical models. Histograms with the mass and age distribution for the 680 stars measured in this way are shown in Figures 7a and 7b, respectively. As Figure 6 already implied, the histogram in Figure 7b shows that there is a remarkable paucity of stars with ages around 4–8 Myr. In particular, the solid line in Figure 7b provides a histogram of the age distribution with constant logarithmic step (a factor of 2) and shows two peaks, at and Myr. The two peaks remain visible also when the number of stars in each bin is rescaled by the size of the bin, as indicated by the dot-dashed line (note that at the extremes of the distribution it becomes more difficult to assign an age to the stars, so the first and last bin are drawn with a dotted line to indicate a larger uncertainty). In a companion paper (De Marchi, Paresce & Sabbi 2011), we discuss the age and spatial distributions of these stars in more detail and show that between 30 and 10 Myr ago a large number of PMS stars formed, similar to that produced by the current burst, which however appears to be much more intense.
4.2. Mass accretion rates
Besides the H luminosity already discussed in the previous section, the other physical parameters of interest in this work are the accretion luminosity and the mass accretion rate , that we derived following the procedure described in Paper I. From an analysis of the literature values of and measurements as recently summarised by Dahm (2008) for PMS stars in the Taurus–Auriga association, that paper concluded that the ratio can be assumed to be constant. The proportionality constant, obtained from an elementary fit to the data in the compilation of Dahm (2008), is:
| (4) |
where the large uncertainty on the proportionality factor arises because the two quantities were determined from non-simultaneous observations. Considering that the intensity of the H line from PMS sequence stars is known to vary by about 20 % on a time scale of a few hours and by as much as a factor of 2 – 3 in a few days (e.g. Fernandez et al. 1995; Smith et al. 1999; Alencar et al. 2001), the large spread can be understood. However, as we will show in Section 5, the small dispersion of the mass accretion rate with stellar age suggests an uncertainty smaller than .
The mass accretion rate is related to via the free-fall equation, that links the luminosity released in the impact of the accretion flow with the rate of mass accretion , according to the relationship:
| (5) |
where is the gravitational constant, and the mass and photospheric radius of the star as derived above and the inner radius of the accretion disc. The value of is rather uncertain and depends on how exactly the accretion disc is coupled with the magnetic field of the star. Following Gullbring et al. (1998), we adopt for all PMS objects. By substituting Equation 4 in Equation 5, the mass accretion rate , in units of M⊙ yr-1, can be directly expressed as a function of :
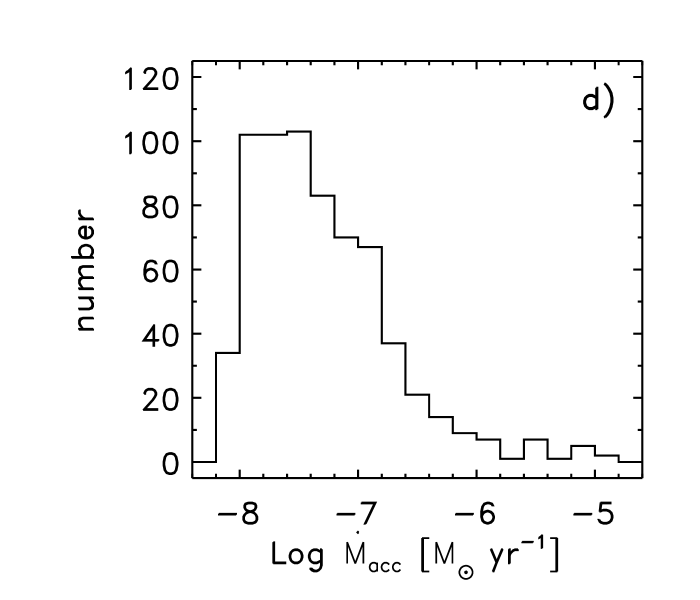
The histograms showing the distribution of and as derived with Equation 4.2 for the 680 bona-fide PMS stars with well defined masses are shown in Figures 7c and 7d, respectively. The median values of and are, respectively, erg/s (or L⊙) and M⊙ yr-1. The latter value is about 50 % higher than the median mass accretion rate of a population of 133 PMS stars that we detected in the field of SN 1987A (see Paper I) and this is fully consistent with the much younger average age of the PMS stars in NGC 346.
Paper I provides an extensive discussion of the statistical and systematic uncertainties involved in determining with this method and we refer the reader to that work for more details. The typical combined statistical uncertainty on for the NGC 346 field is 13 %. It is largely dominated by the uncertainty on of 10 % which in turn is mostly due to random errors in the photometry (we note that this uncertainty is lower than for the study of the field around SN 1987A in Paper I because of the higher quality of the ACS photometry). As for systematic effects, those on , and reddening add up to 15 %, but it is the rather uncertain relationship linking to the accretion luminosity that plays a dominant role. We stress here that our method adopts the calibration provided by Dahm (2008), which is based on a spectroscopic study of Galactic PMS stars. If the uncertainty on the relationship between and is as large as Dahm’s (2008) work suggests (but see Section 5), it could possibly cause a systematic effect of up to a factor of 3 on the value of that we obtain.
This is the unfortunate consequence of our incomplete understanding of the physics of the accretion process. Improving this situation would require direct measurements of the bolometric accretion luminosity and simultaneous measurements of the hot continuum excess emission and of the emission line fluxes in H or other lines (e.g. Pa and Br). It is also true, however, that these systematic effects plague in the same way all determinations of that make use of emission lines diagnostics. This includes detailed studies of the profile and intensity of the H line (e.g. Muzerolle et al. 1998), since they rely on the same measurements for their calibration. Therefore, it is possible and meaningful to compare the values of that we obtain here to one another and to those derived with other methods, as we do in the following section.
5. Evolution of the mass accretion rate
In this section we investigate how varies with stellar parameters such as stellar mass and age. It is important to underline that this analysis is based only on stars that, at the time of the observations, were undergoing active mass accretion as revealed by H excess emission above our detection threshold. Actually, PMS objects are known to display large variations in their H emission over hours or days (e.g. Fernandez et al. 1995; Smith et al. 1999; Alencar et al. 2001), with only about one third of them at any given time being active H emitters with Å in the field around SN 1987A (Panagia et al. 2000).
In fact, a similar requirement of a high accretion activity is common to all studies in which PMS stars are identified based on single-epoch observations, including those conducted spectroscopically on T Tauri objects in the Milky Way (e.g. Sicilia–Aguilar et al. 2006). This implies that the accretion rates measured for the detected objects will, in fact, represent the highest values possible for that class of objects, while many more stars may well be accreting at more modest rates. As a result, the true average accretion rate appropriate for a given class of objects will be just a fraction of the values measured for the members of that class that can be detected. On the other hand, since all studies made with different techniques suffer from the same kind of selection on the accretion efficiency, a direct comparison between their results is still possible and meaningful.
5.1. A qualitative analysis
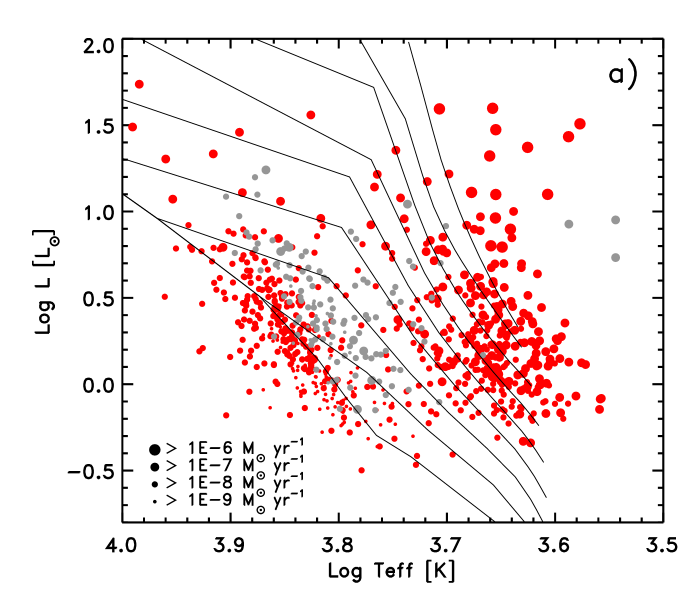
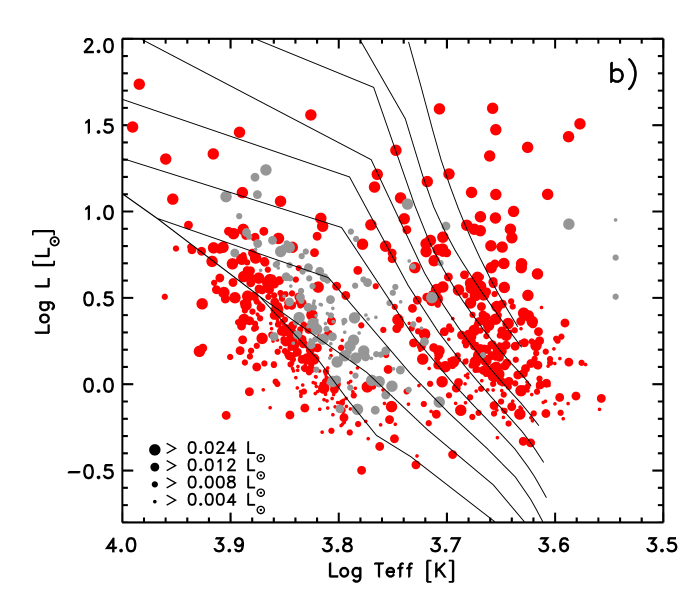
Let’s start with a qualitative analysis of the H–R diagram of the bona-fide PMS stars shown in Figure 8a, where the size of the symbols is set to be proportional to according to the legend. Besides the 680 bona-fide PMS stars in NGC 346 (darker dots, red in the online version) we have included in the figure for comparison also the 133 bona-fide PMS stars in the field of SN 1987A discussed in Paper I (lighter dots, gray in the online version). The theoretical PMS isochrones are the same as shown in Figure 6 and correspond to a metallicity and to ages from Myr to 32 Myr increasing from the right with a constant logarithmic step of a factor of 2. While not directly applicable to the PMS stars in the SN 1987A field, due to the different metallicity, these isochrones serve nonetheless the purpose to illustrate the effects of increasing PMS age.
It is noteworthy that the mass accretion rate varies by over three orders of magnitude across the H–R diagram in a very regular way: younger stars, which are farther away from the MS, have typically higher mass accretion rates, as expected from the theory of stellar evolution. Also the stellar mass appears to affect the value of , in the sense that less massive stars tend to have smaller accretion rates. It is also quite remarkable that even PMS stars very close to the location of the zero-age MS (ZAMS), which for the masses of interest here can be considered equivalent to the 32 Myr PMS isochrone, are still undergoing substantial mass accretion.
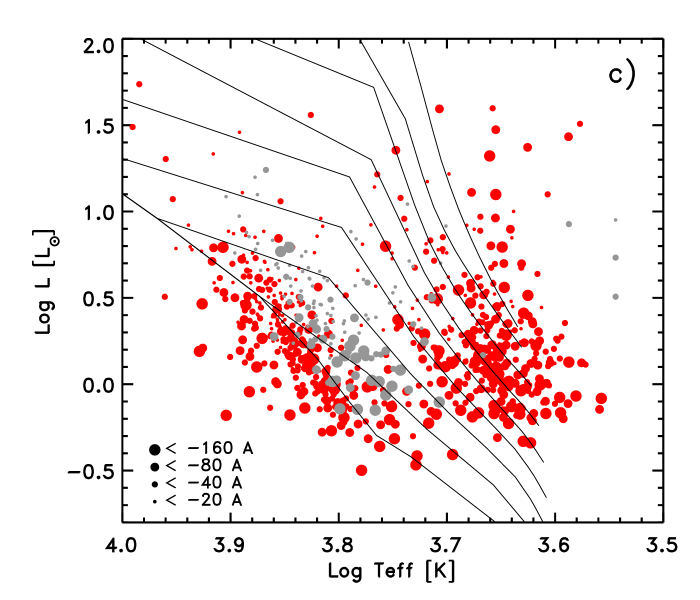
To verify that this is not a spurious effect due to errors in our derivation of , we show in Figure 8b the same H–R diagram but with the size of the symbols proportional to the measured H luminosity. There one sees that can be rather large for objects at or near the ZAMS, suggesting that the accretion process remains relatively active when the star approaches the MS. More precisely, this demonstrates that, even if decreases as a PMS star approaches the MS, its shrinking radius allows the star to extract more potential energy per unit rate of mass accretion (i.e. for a given rate in g cm-1), thereby making the object easier to detect in H. Finally, Figure 8c shows that the values of PMS objects near or at the MS are typically much larger than those caused by chromospheric activity for stars in this mass range (see e.g. Ulmschneider 1979; Pasquini et al. 2000), confirming that they are bona-fide young objects.
5.2. A quantitative analysis
For a more quantitative analysis of the evolution of the mass accretion rate, we turn to Figure 9 where the variation of is shown as a function of stellar age. All 680 bona-fide PMS stars in NGC 346 are indicated as diamonds, with a symbol size proportional to their mass. Besides being very homogeneous, this sample is about five times larger than all measurements today available for Galactic PMS objects taken together (e.g. Sicilia–Aguilar et al. 2006). Furthermore, it spans over a decade in mass and two orders of magnitudes in age while including objects from the same star forming region with very accurate and uniform measurements. All this makes the sample particularly well suited for a quantitative analysis of the dependence of the mass accretion rate on stellar parameters.
The dashed line in Figure 9 represents the best fit to the evolution of the mass accretion rate in NGC 346, with a slope and intercept (at 1 Myr). The fit appears considerably less steep than the prediction of Hartmann et al. (1998; see also Muzerolle et al. 2000), based on models of viscous disc evolution and represented here by the solid line, which however seems to adequately reproduce the trend of decreasing with stellar age for low-mass Galactic T-Tauri stars as compiled by Sicilia–Aguilar et al. (2006) and also shown in the figure. The different slopes of the observed and model relationships translate into predicted values that are about two order of magnitudes smaller than what we actually observe for an age of 10 Myr.
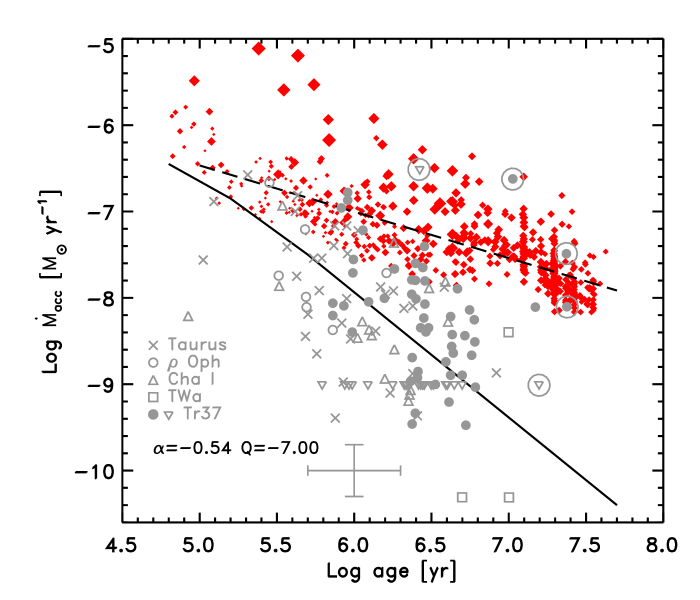
This discrepancy had already been noticed in the field of SN 1987A studied in Paper I, although it is pointed out there that the value measured at 10 Myr is in excellent agreement with that of the most massive PMS stars (with spectral type G) in the Trumpler 37 sample of Sicilia–Aguilar et al. (2006) shown as large circles in the figure. Even though the age of the G-type stars in Trumpler 37 is very uncertain (Sicilia–Aguilar et al. 2006) and could be much younger (J. Muzerolle, priv. comm.; see also Hartmann 2003), we cannot exclude that the slower decline of with time that we observe in NGC 346 and around SN 1987A could be due to the typically higher mass of our objects compared with that of the Galactic T Tauri stars that were the subject of recent studies. A dependence of on the stellar mass is indeed expected and could be as steep as according to Muzerolle et al. (2003; 2005), Natta et al. (2004; 2006) and Calvet et al. (2004), although the uncertainties are large (see also Clarke & Pringle 2006 for a different interpretation).
Owing to the large size and wide mass range of the objects in our sample, we can investigate the mass dependence of in a very robust way. As a first step, we divide out sample in four mass groups, namely M⊙ , M⊙ , M⊙ and M⊙ , and plot for each one separately the temporal evolution of in the four panels of Figure 10. The slope and intercept (at 1 Myr) of the best linear fit to the data, according to the relationship , are given in each panel together with their uncertainty. It appears that the slopes of the four mass groups are in very good agreement with one another, within the uncertainty of the fits, but remain significantly different from the trend predicted by Hartmann et al. (1998) and Muzerolle et al. (2000) for viscous disc evolution (solid lines).
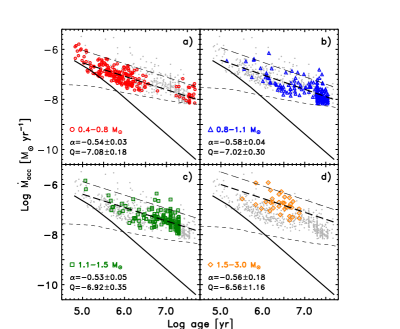
In principle, the shallower slopes of our fits could be affected by our very strict criteria for selecting bona-fide PMS stars. Requiring that the H excess be at the level or higher and that Å will set a lower limit to the H luminosity that we can accept as significant and, therefore, to the smallest value that we can detect at a given mass or age. If this lower limit is too high, we could be ignoring too many objects with low mass accretion rate, particularly at older ages, and therefore skew the measurement of the slope towards low values. On the other hand, it appears that our detection limits (shown by the thin short-dashed lines for the average mass of each group) do not significantly affect the determination of the slope, except possibly for the least massive stars at ages Myr. For this group, however, the slope is determined by the much more numerous young stars.
More importantly, the upper envelopes of the distribution of all four mass groups appear to be fully consistent with the slope of the best fit. This is shown graphically by the thin long-dashed lines that represent the best-fitting line shifted vertically by dex. While our conservative limits on the H excess emission may prevent us from detecting objects with low , no selection effects are to be expected for stars with high H luminosity. Since the distribution of these objects is consistent with the slope of the best fit, the latter must be correct. Therefore, within the uncertainties quoted in Figure 10, we can conclude that all four mass groups are compatible with the same slope (formally ).
An interesting feature of Figure 10 is that the spread of the data values around the best fitting lines is small, typically dex (rms). This proves quite convincingly that the true uncertainty in the relationship between and given by Equation 4 cannot be as large as the dex value suggested by our elementary fit to the data in the compilation of Dahm (2008), but it has to be intrinsically smaller than the dex factor that we observe in our own NGC 346 data. We conservatively assume dex (or a factor of in linear units).
Having established that the data in all four panels of Figure 10 are consistent with the same slope , we can use the intercept at 1 Myr to study how varies with the stellar mass . It appears that the value of in the four panels of Figure 10 decreases with increasing mass approximately as . The formal uncertainty on may seem too large to reach this conclusion, but the scatter is due to the grouping of stars of different mass in the same bin. It is, therefore, more appropriate to perform a multivariate fit to the three variables simultaneously (, age and mass). We opt for a linear multivariate least-square fit of the type:
| (7) |
where is in years, the mass in solar units and is a constant. The formal best fit gives , and . However, since the set of parameters , and would give almost equally small residuals, we will take them hereafter as a good as well as convenient representation of the dependence of on stellar mass and age in NGC 346.
5.3. Comparison with other star forming regions
From this analysis it appears that the NGC 346 data are not consistent with a steep dependence of on the stellar mass of the type reported by Muzerolle et al. (2003) and Calvet et al. (2004) in nearby star forming regions. However, the gentler decline of with mass that we find here is fully compatible with that obtained in a study of about 900 PMS stars recently identified in the regions around 30 Dor (Spezzi et al., in preparation, Paper III) as well as with the preliminary results of a ground-based study of about 500 PMS objects in the Orion Nebula Cluster (Da Rio et al., in preparation). In all these cases, values of and in Equation 7 give a good fit to the data.
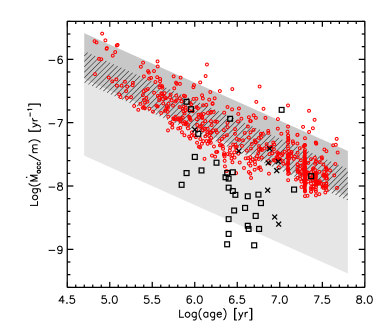
This suggests that we could use the same functional form and parameter values to fit the observed evolution of for Galactic PMS stars and compare the result to the data in the Magellanic Clouds. We do so in Figure 11, where we show the run of the specific mass accretion rate, defined as , as a function of time for the PMS objects in NGC 346 (circles) and for Galactic stars in Taurus (crosses; from Calvet et al. 2000) and Trumpler 37 (squares; from Sicilia-Aguilar et al. 2006). The hatched band represents the best fit to the NGC 346 data, the dark-shaded band is the fit to the PMS stars in the 30 Dor region as derived in Paper III, whereas the light-shaded band refers to Galactic stars (including also the Orion Nebula Cluster; Panagia et al. in preparation). The hatched and solid bands correspond to the scatter (i.e. the range from 17 to 83 percentile) and indicate that the SMC and LMC data are compatible with one another, but that the difference with Galactic PMS stars is significant.
The logarithmic value of the specific mass accretion rate at 1 Myr, calculated using the best fitting line as given in Equation 7, can serve as a measure of this difference. takes on the values of , and respectively for NGC 346, the 30 Dor region and the Galaxy. As already pointed out in Paper I, the higher values of PMS stars in the LMC compared to Galactic objects of the same age could result from the lower metallicity of the clouds. The radiation pressure of the forming star is expected to be less strong on lower-metallicity disc material and this will delay the dissipation of the disc, thereby keeping the accretion process active for a longer time. This scenario is compatible with the PMS stars in the Galaxy having a smaller value of the specific mass accretion rate than those in the Magellanic Clouds.
A possibility would be that the shallower photometric depth of the LMC data may cause the detection threshold for PMS stars to be higher (see Paper III for more details) and thus could skew the median value of . We will address this possibility in detail through the analysis of recently obtained HST observations of the same region (De Marchi et al., in preparation). Alternatively, it is also possible that below a certain metallicity threshold the radiation pressure on the disc material no longer changes. Investigating this possibility requires the analysis of larger and homogeneous data set of measurements in low-metallicity environments.
5.4. Mass growth during the PMS phase
Finally, we would like to highlight an interesting corollary result stemming from the large mass accretion rate values that we find for the objects in NGC 346. Using the rates as expressed by Equation 7 we can estimate the total mass accreted by a star over the time span from birth to the ZAMS. Already in 1993 Palla & Stahler (1993) showed that the timescale to reach the ZAMS is a strong function of the stellar mass. Fitting the more modern evolutionary calculations (Degl’Innocenti et al 2008; Tognelli et al 2011) for metallicities Z⊙ and stellar masses in the range up to 4 M⊙ , to within 8 % accuracy we can express that time in years as:
| (8) |
Equation 7 provides an analytical expression for the average mass accretion rate of the detected stars. On the other hand, there must be an appreciable fraction of PMS objects that, at any given time, are not detectable as strong H emitters. Therefore, in order to properly estimate the amount of accreted mass over the PMS phase we have to make allowance for the appropriate duty cycle. While doing this would require a detailed knowledge of the time evolution of the H emission for a large sample of PMS stars in this region, for the sake of simplicity we will assume that the evolution consists in a series of two-level transitions that recur in time. In this simplified model the high state value corresponds to the average value measured for the detected PMS stars and the low state of the H undetected stars is zero. Thus, the true mass accretion rate of any star of mass at the time will simply be the average value measured for the detected PMS stars multiplied by an efficiency factor that in principle is a function of the stellar mass, the time and the metallicity of the region.
An approximate value of this function is given by the ratio of the number of PMS stars with detected H emission and the total number of candidate PMS stars as defined by their location in the H–R diagram. In a companion paper, De Marchi, Panagia & Sabbi (2011) show that for NGC 346 such a ratio is essentially constant over time up to PMS ages of 8 Myr at a level of . Note that similar values have been found in the field of SN 1987A for PMS stars with median age of 14 Myr (; Panagia et al 2000). Therefore, adopting a constant value of for PMS stars in NGC 346 allows us to integrate the accretion rate over time from 0 up to in order to estimate the total amount of mass (in M⊙ units) accreted by these objects during their PMS phase. From Equations 7 and 8 we can express it in units of M⊙ as follows:
showing that the amount of accreted mass is virtually insensitive to the stellar mass. In the range M⊙ M⊙ as studied here, Equation 5.4 implies M⊙ .
Taken at face value, such a high figure would imply that a considerable amount of mass is accreted during the PMS phase, at least in low-metallicity environments such as the Magellanic Clouds. If this is the case, the PMS evolution of moderate-mass stars, say M⊙ , should be reconsidered and recalculated taking into account the high values. One of the effects of Equation 9 is that the appropriate for a star that reaches the MS with a given mass will be longer than the value estimated by evolutionary models that assume after the first few yr (e.g. Baraffe et al. 2009). Since the star had an appreciably lower mass for a very long time (several Myr) at the early epochs, it was necessarily evolving more slowly.
Extrapolating these findings to lower masses than those that we have reached here (i.e. M⊙ ) would carry the implication that no star could form with a mass below a suitable minimum value. For NGC 346 this would correspond to a lower cut-off of the initial mass function at M⊙ . In the Milky Way, where is about five times lower but the metallicity is about 8 times higher so that the PMS evolutionary times are a factor of about longer, the cut-off would occur at M⊙ .
On the other hand, it is also possible that for low-mass stars circumstellar discs are eroded in a finite time that is appreciably shorter than their . For example, if for stars below 1 M⊙ we were to limit the integrals in Equation 9 between 0 and the smaller of and 20 Myr, the accreted mass would decrease proportionally to the mass, i.e.
| (10) |
In practice this would still require some refinements to models of stellar evolution in the PMS phase, but the increase in mass would never be higher than 20 % of the final ZAMS mass. Note that the choice of 20 Myr as the upper limit for the integration stems from the fact that near the MS we still find 1 M⊙ stars that have strong H excess, thus indicating the presence of considerable accretion. Deeper observations of NGC 346 reaching well below 1 M⊙ on the MS can easily show whether the discs of lower-mass objects are indeed eroded before they reach the ZAMS. It would be sufficient to verify whether strong H excess emission is still shown by stars smaller than 1 M⊙ near the MS, or, alternatively, whether for objects of these lower masses strong H emission is only seen at younger ages, when they are still well above the MS. If at these masses the discs are indeed eroded before reaching the ZAMS, H emission should systematically taper off for objects older than a cut-off age. In any case, these new results can have important implications for some of the assumptions and boundary conditions used in theories of star formation and early evolution.
6. Summary and conclusions
We have studied the properties of the stellar populations in the field of the NGC 346 cluster in the SMC as observed with the ACS camera on board the Hubble Space Telescope (Sabbi et al. 2007). To this aim, we have employed a novel, self-consistent method that allows us to reliably identify PMS stars undergoing active mass accretion, regardless of their age. The method, fully described in Paper I, does not require spectroscopy and combines broad-band and photometry with narrow-band imaging to identify all stars with excess H emission and allows us to derive the accretion luminosity and mass accretion rate for all of them. The main results of this work can be summarised as follows.
-
1.
From the photometry of Sabbi et al. (2007), we have selected all objects in a region of around the centre of NGC 346 that have a combined mean error in the three bands (, and H) of less than mag, as defined in Equation 1. A total of 18 764 stars satisfy this condition.
-
2.
The CMD reveals the presence of both young and old populations, but the conspicuous broadening of the upper MS proves that there is also variable extinction. We have determined the reddening towards each of these stars from their colour and magnitude displacements with respect to a 4 Myr isochrone for metallicity and a distance modulus of . We found that extinction is in the range or (respectively 17 % and 83 % limits), with a median value of or . We have then used the reddening values towards each of the selected stars to derive a reddening correction for all objects in their vicinity.
-
3.
Following the method developed in Paper I, we have identified 791 PMS candidates as being objects with H excess above the level with respect to the reference provided by normal stars. Their average H luminosity is erg s-1 or L⊙. We have also determined the equivalent width of the H emission line of these objects and have classified as bona-fide PMS stars all those with Å (or Å for stars with K). These conditions guarantee that our sample is free from contamination due to the chromospheric activity of older objects or to the rotational winds of Be stars. A total of 694 objects satisfy these conditions.
-
4.
By comparing the locations of these objects in the H–R diagram with the PMS evolutionary models of the Pisa group for metallicity , we have been able to derive an accurate value of the mass and age of 680 bona-fide PMS stars (note that previous determinations of these parameters for candidate PMS stars in NGC 346 that made use of evolutionary models for are necessarily less accurate). The masses of these objects range from M⊙ to M⊙ , with an average value of M⊙ . Their ages show a clear bimodal distribution with two peaks at Myr and Myr and very few objects around Myr, revealing the presence of two distinct but equally populous generations of stars. We address in a companion paper (De Marchi, Panagia & Sabbi 2011) the properties of and the relationships between the two generations.
-
5.
From the H luminosity and the other physical parameters that we have measured, we have derived the mass accretion rate of all bona-fide PMS stars. The median value of is M⊙ yr-1. This value is about 50 % higher than that measured in Paper I for a population of 133 PMS stars in the field of SN 1987A, owing to the much younger median age of PMS objects in NGC 346.
-
6.
Thanks to the unprecedented size of our PMS sample and of its spread in mass and age, we have been able to study the evolution of the mass accretion rate as a function of stellar parameters. Regardless of the mass of the star, our analysis shows that the mass accretion rate decreases with roughly the square root of the age, or about three times slower than predicted by current models of viscous disc evolution, and that more massive stars have systematically higher mass accretion rate in proportion to their mass. A multivariate linear regression fit reveals that , where is the age of the star, its mass and a quantity that is higher at lower metallicity.
-
7.
The large mass accretion rates that we find imply that a considerable amount of mass is accreted during the PMS phase, at least in low-metallicity environments such as the Magellanic Clouds. At face value, the observed rates integrated over the entire PMS phase would give a total accreted mass of M⊙ , with negligible dependence of the final mass on the ZAMS, thereby possibly suggesting a lower cut-off mass in the stellar mass function of NGC 346. If, however, the circumstellar discs are eroded on a time scale shorter than the PMS lifetime, the total accreted mass will be of course smaller but not negligible. In any case, the PMS evolution of moderate-mass stars ( M⊙ ) should be reconsidered and recalculated taking into account the high values, since for a given MS mass the evolutionary time needed to reach the ZAMS will be longer than what is currently estimated by models that assume after the first few yr.
References
- (1) Alencar, S., Basri, G., Hartmann, L., Calvet, N. 2005, A&A, 440, 595
- (2) Baraffe, I., Chabrier, G., Gallardo, J. 2009, ApJ, 702, L27
- (3) Barentsen, G., et al. 2011, MNRAS, in press (arXiv:1103.1646)
- (4) Bessell, M., Castelli, F., Plez, B. 1998, A&A, 333, 231
- (5) Bolatto, A. D., et al. 2007, ApJ, 655, 212
- (6) Calvet, N., Hartmann, L., Strom, E. 2000, in “Protostars and Planets”, eds V. Mannings, A. Boss, S. Russell (Tucson: University of Arizona Press), 377
- (7) Calvet, N., Muzerolle, J., Briceño, C., Hernandez, J., Hartmann, L., Saucedo, J. L., Gordon, K. D. 2004, AJ, 128, 1294
- (8) Chieffi, A., Straniero, O. 1989, ApJS, 71, 47
- (9) Cignoni, M., et al. 2009, AJ, 137, 3668
- (10) Clarke, C., Pringle, J. 2006, MNRAS, 370, L10
- (11) Cote, J., Waters, L. B. F. M. 1987, A&A, 176, 93
- (12) Dahm, S. 2008, AJ, 136, 521
- (13) Da Rio, N., Gouliermis, D. A., Gennaro, M. 2010, ApJ, 723, 166
- (14) Degl’Innocenti, S., Prada Moroni, P. G., Marconi, M., Ruoppo, A. 2008, Ap&SS, 316, 25
- (15) De Marchi, G., Panagia, N., Romaniello, M. 2010, ApJ, 715, 1
- (16) De Marchi, G., Panagia, N., Sabbi, E. 2011, ApJ, submitted
- (17) Elmegreen, B., Lada, C. 1977, ApJ, 214, 725
- (18) Evans, C., Lennon, D., Smartt, S., Trundle, C. 2006, A&A, 456, 623
- (19) Fedele, D., van den Ancker, M., Henning, T., Jayawardhana, R., Oliveira, J. 2010, A&A, 510, A72
- (20) Fernandez, M., Ortiz, E., Eiroa, C., Miranda, L. 1995, A&AS, 114, 439
- (21) Ford, H. et al. 2003, SPIE, 4854, 81
- (22) Gilmozzi, R., Kinney, E., Ewald, S., Panagia, N., Romaniello, M. 1994, ApJ, 435, L43
- (23) Gouliermis, D., Dolphin, A., Brandner, W., Henning, T. 2006, ApJS, 166, 549
- (24) Gouliermis, D., Henning, T., Brandner, W., Dolphin, A. E., Rosa, M., Brandl, B. 2007, ApJ, 665, L27
- (25) Gullbring, E., Hartmann, L., Briceño, C., Calvet, N. 1998, ApJ, 492, 323
- (26) Haisch, K., Lada, E., Lada, C. 2001, ApJ, 553, L153
- (27) Hartmann, L. 2003, ApJ, 585, 398
- (28) Hartmann, L., Calvet, P., Gullbring, E., D’Alessio, P. 1998, ApJ, 495, 385
- (29) Heap, S., Lanz, T., Hubeny, I. 2006, ApJ, 638, 409
- (30) Henize, K. 1956, ApJS, 2, 315
- (31) Hennekemper, E., Gouliermis, D., Henning, T., Brandner, W., Dolphin, A. 2008, ApJ, 672, 914
- (32) Hilditch, R., Howarth, I., Harries, T. 2005, MNRAS, 357, 304
- (33) Hunter, D., Shaya, E., Holtzman, J., Light, R., O’Neil, E., Lynds, R. 1995, ApJ, 448, 179
- (34) Keller, S., Wood, P. 2006, ApJ, 642, 834
- (35) Lee, J.-K., et al. 2005, A&A, 429, 1025
- (36) Marigo, P., Girardi, L., Bressan, A., Groenewegen, M., Silva, L., Granato, G. 2008, A&A, 482, 883
- (37) Malin, D. 1977, AAS Photo Bull., 16, 10
- (38) Massey, P., Parker, J. W., Garmany, C. D. 1989, AJ, 98, 1305
- (39) Maybhate, A., et al. 2010, “ACS Instrument Handbook,” Ver. 9, (Baltimore: STScI)
- (40) Mokiem, M., et al. 2006, A&A, 456, 1131
- (41) Muzerolle, J., Hartmann, L., Calvet, N., 1998, AJ, 116, 455
- (42) Muzerolle, J., Calvet, N., Briceño, C., Hartmann, L., Hillenbrand, L. 2000, ApJ, 535, L47
- (43) Muzerolle, J., Calvet, N., Hartmann, L. 2001, ApJ, 550, 944
- (44) Muzerolle, J., Hillenbrand, L., Calvet, N., Briceño, C., Hartmann, L., 2003, ApJ, 592,266
- (45) Muzerolle, J., Luhman, K., Briceño, C., Hartmann, L., Calvet, N. 2005, ApJ, 625, 906
- (46) Niemela, V., Marraco, H., Cabanne, M. 1986, PASP, 98, 1133
- (47) Natta, A., et al. 2004, A&A, 424, 603
- (48) Natta, A., Testi, L., Randich, S. 2006, A&A, 452, 245
- (49) Nota, A., et al. 2006, ApJ, 640, L29
- (50) Palla, F., Stahler, S. 1993, ApJ, 418, 414
- (51) Panagia, N., Romaniello, M., Scuderi, S., Kirshner, R. 2000, ApJ, 539, 197
- (52) Pasquini, L., de Medeiros, J., Girardi, L. 2000, A&A, 361, 1011
- (53) Pérez-Montero, E., Díaz, A. 2005, MNRAS, 361, 1063
- (54) Rolleston, W., et al. 1999, A&A, 348, 728
- (55) Romaniello, M. 1998, PhD thesis, Scuola Normale Superiore, Pisa, Italy
- (56) Romaniello, M., Panagia, N., Scuderi, S., Kirshner, R. 2002, AJ, 123, 915
- (57) Romaniello, M., Robberto, M., Panagia, N. 2004, ApJ, 608, 220
- (58) Russell, S., Dopita, M. 1992, ApJ, 384, 508
- (59) Sabbi, E., et al. 2007, AJ, 133, 44
- (60) Scuderi, S., Panagia, N., Gilmozzi, R., Challis, P., Kirshner, R. 1996, ApJ, 465, 956
- (61) Sicilia–Aguilar, A., Hartmann, L., Hernandez, J., Briceño, C., Calvet, N. 2005, AJ, 130, 188
- (62) Sicilia–Aguilar, A., Hartmann, L., Furesz, G., Henning, T., Dullemond, C., Brandner, W. 2006, AJ, 132, 2135
- (63) Siess, L., Dufour, E., Forestini, M. 2000, A&A, 358, 593
- (64) Simon, J., et al. 2007, ApJ, 669, 327
- (65) Sirianni, M., et al. 2005, PASP, 117, 1049
- (66) Smith, K., Lewis, G., Bonnell, I., Bunclark, P., Emerson, J. 1999, MNRAS, 304, 367
- (67) Tognelli, E., Prada Moroni, P., Degl’Innocenti, S. 2011, A&A, submitted
- (68) Ulmschneider, P. 1979, Space Sci. Rev., 24, 71
- (69) Walborn, N. 1978, ApJ, 224, L133
- (70) Walborn, N., Blades, J. 1986, ApJ, 304, L17
- (71) White, R., Ghez, A. 2001, ApJ, 556, 265