The Carbon Monoxide Abundance in Comet 103P/Hartley
during the EPOXI Flyby
Abstract
We report the detection of several emission bands in the CO Fourth Positive Group from comet 103P/Hartley during ultraviolet spectroscopic observations from the Hubble Space Telescope (HST) on 2010 November 4 near the time of closest approach by NASA’s EPOXI spacecraft. The derived CO/ ratio is 0.15–0.45%, which places 103P among the most CO–depleted comets. Apparently this highly volatile species, whose abundance varies by a factor of 50 among the comets observed to date, does not play a major role in producing the strong and temporally variable activity in 103P/Hartley. The CO emissions varied by 30% between our two sets of observations, apparently in phase with the temporal variability measured for several gases and dust by other observers. The low absolute abundance of CO in 103P suggests several possibilities: the nucleus formed in a region of the solar nebula that was depleted in CO or too warm to retain much CO ice, repeated passages through the inner solar system have substantially depleted the comet’s primordial CO reservoir, or any CO still in the nucleus is buried below the regions that contribute significantly to the coma.
1 INTRODUCTION
Comet 103P/Hartley (hereafter “103P”) was discovered in 1984 and is a Jupiter family comet (JFC) with an orbital period of 6.4 yr. A succession of encounters with Jupiter in 1875 reduced the comet’s perihelion distance (from 2.9 AU to 1 AU) and aphelion distance (from 8 AU to 6 AU) (Carusi et al., 1985). Thus, 103P appears to be a relative newcomer to the inner solar system and is one of the few comets to become an Earth crosser in the recent past.
During its 2010 apparition, 103P was only 0.12 AU from the Earth on October 21 and was generally well placed for remote observations for several months near the time of its perihelion on October 28 when the Sun–comet distance was 1.08 AU. In addition, the EPOXI spacecraft passed within 700 km of the nucleus of 103P on 2010 November 4 (A’Hearn et al., 2011). For these reasons, we proposed a systematic ultraviolet (UV) spectroscopic investigation of 103P with the Hubble Space Telescope (HST). Our team was allocated a total of 15 orbits of HST time to observe 103P during the fall of 2010, which we divided into three 5–orbit observing runs: on September 25, on November 4, and on November 28. Here we report on our detection of carbon monoxide (CO) gas in the coma of 103P near the time of the EPOXI flyby on November 4.
2 OBSERVATIONS AND DATA REDUCTION
We used two different HST instruments: the Cosmic Origins Spectrograph (COS) and the Space Telescope Imaging Spectrograph (STIS) Different gratings were selected to target different species (Table 1). A 25 diameter aperture, which projected to 285 km at the comet on November 4, was used for all COS observations, and a (23 km 5920 km) slit was used for the STIS observation.
The HST observations of comet 103P/Hartley were very challenging owing to the comet’s relatively uncertain ephemeris and its fast apparent motion, 280″ hr-1 relative to the background star field. A pointing offset maneuver of 77 was uplinked and executed prior to each orbit on 2010 November 4 to correct for the improvement in the comet’s ephemeris between the times when the observations were planned and when they executed, several weeks later. HST’s pointing control system was programmed to follow the comet’s apparent motion. During each orbit an onboard target acquisition procedure located the comet’s center of brightness, presumed to be centered on the nucleus, and then commanded the telescope to center the nucleus in the selected aperture. Analysis of the acquisition images showed that the autonomous process worked as designed and centered the nucleus in the aperture to an accuracy of 005 for all observations.
No cometary molecular or atomic emissions were detected in the STIS spectra, which will not be discussed further here. For the COS data, we used extracted spectra from the “x1dsum” files produced by the COS calibration pipeline processing system (“CALCOS”). We also examined the flat-fielded spectral images (the “flt” files) to search for potential artifacts associated with the spectral extractions. Further details on COS, its operations, its performance, and its data products can be found in the COS Instrument Handbook111http://www.stsci.edu/hst/cos/documents/handbooks/current/cos_ihb.pdf and in the COS Data Handbook222http://www.stsci.edu/hst/cos/documents/handbooks/current/COS_longdhb.pdf.
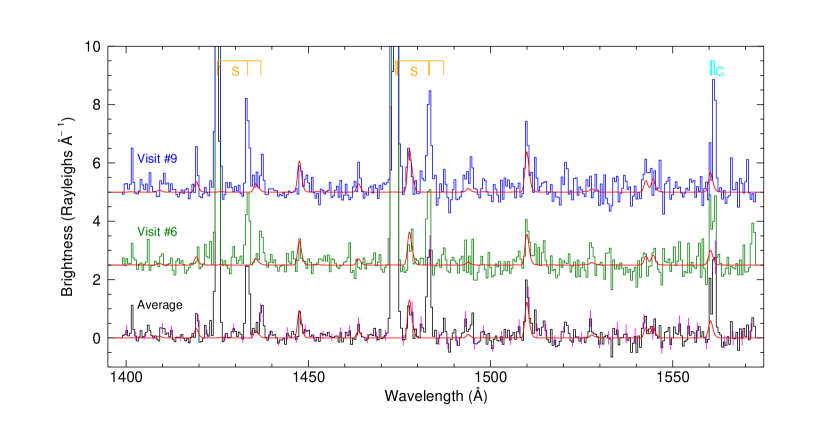
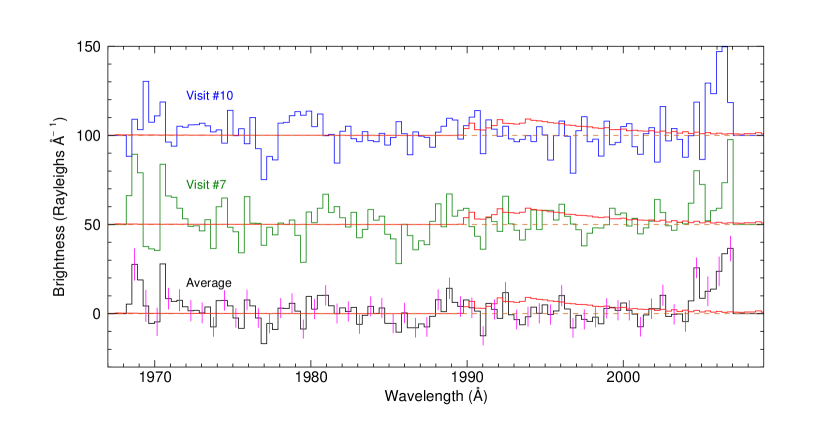
A spectrum of 103P taken with the COS/FUV configuration is displayed in Figure 1 and shows the detection of CO emission in the Fourth Positive Group (4PG; – ) near 1500 Å. This is the first measurement of CO in 103P and is the main result presented in this paper. A spectrum of 103P taken with the COS/NUV configuration is displayed in Figure 2 and was used to search for CO emission in the dipole-forbidden Cameron system (– ) near 1900 Å , which is a tracer for in the comet.
3 ANALYSIS AND DISCUSSION
Given the importance of for 103P (A’Hearn et al., 2011), we first briefly discuss our result. Although the HST measurements cannot detect directly, forbidden (prompt) emission in the CO Cameron system is produced during the photodissociative excitation of in the coma and can be used infer the rate of sublimation from the nucleus (Weaver et al., 1994). From our upper limit on emission in the (1,0) band (Figure 2), we place a 5 upper limit on the production rate of molecules s-1 (assuming an outflow velocity of 0.78 km s-1), which implies / 20% (the production rate is discussed below). This upper limit is well above the / abundance ratio of 7% determined from HST observations of CO Cameron emission in 1991 (Weaver et al., 1994) and 8% determined from direct measurements of emission at infrared wavelengths in 1998 by the Infrared Space Observatory (Colangeli et al., 1999). The EPOXI team directly observed infrared emission from both and during the 2010 apparition (A’Hearn et al., 2011). For observations 55 hr prior to closest approach (CA) of the EPOXI spacecraft to the nucleus, they derive a / ratio of 20% near a time of “maximum” activity. From observations 2 days after CA, the EPOXI data showed that the / ratio increased by a factor of 2 as the activity level changed from a minimum to a maximum, implying that / 10% near times of minimum activity. This latter value is only marginally larger than the / ratios measured during the remote (non-EPOXI) observations of 103P during the 1991 and 1998 apparitions. Thus, it is not clear whether the / ratio in 103P has significantly changed during the past two decades.
UV fluorescence of sunlight in the CO 4PG system was discovered during a sounding rocket observation of comet C/1975 V1-A (West) in 1976 (Feldman & Brune, 1976) and has been used to measure the CO abundance in approximately a dozen comets since then (cf., Bockelée-Morvan et al., 2004). We had previously searched unsuccessfully for CO 4PG emission from 103P during HST observations in September 1991 (using the Faint Object Spectrograph) and in January 1998 (using STIS). The more constrained upper limit from these measurements was 1% (3) for the CO/ abundance in 1991 (Weaver et al., 1994). With the higher sensitivity of COS, we were able to detect several bands of the CO 4PG system from 103P on November 4 (Figure 1), even though the production rate was 5 times lower in 2010 compared to 1991. Table 2 lists the detected CO 4PG bands with their wavelengths and integrated brightnesses. The CO production rate appears to have increased by 30% between visits 6 and 9, which were separated in time by 14.5 hr. The atomic emissions from C and S showed a similar change, suggesting there was a global increase in cometary activity for visit 9 compared to visit 6.
Strong temporal variability correlated with the rotation of the nucleus was measured from multiple ground and space observatories. The rotational period of 103P was estimated to be 16.64 hr based on observations taken during 2009 (Meech et al., 2009). However, the rotational period increased to 18–19 hr and the rotation became complex (i.e., not about a single axis) near the time of the EPOXI flyby (A’Hearn et al., 2011; Drahus et al., 2011; Meech et al., 2011). We used the extensive ground- and EPOXI-based monitoring of 103P to assess the comet’s level of activity during the HST observations (Figure 3). The temporal changes recorded during the HST observations seem to be consistent with the observed periodic variation in other species, which is apparently associated with the small end of the nucleus rotating in and out of sunlight (A’Hearn et al., 2011).
We employed a radiative transfer model for cometary CO 4PG emission (Lupu et al., 2007) to convert the observed aperture-averaged brightness to a CO column density. The model assumes the CO emission is produced by the fluorescence of CO molecules stimulated by sunlight (i.e., solar fluorescence). We used a solar ultraviolet spectrum appropriate for the current level of solar activity, and performed line-by-line calculations, assuming a rotational temperature of 75 K and accounting for solar spectral features. Our best model match to the observed average 103P spectrum yields a CO column density of molecules cm-2.
We used a standard radial outflow model (cf., Bockelée-Morvan et al., 2004) to convert the column density to a gas production rate at the nucleus, assuming spherically symmetric outflow with constant speed. For the high spatial resolution observations discussed here (1″ projects to 114 km at the comet), the finite lifetime of the CO molecule ( s) can be ignored, and the gas production rate can be calculated from , where is the gas production rate (molecules s-1), is the gas outflow velocity (cm s-1), is the diameter of the circular aperture (in cm at the comet; cm for the COS aperture on November 4), and is the aperture-averaged gas column density (see above). We adopt cm s-1, which is an appropriate value for this moderately active comet (cf., Bockelée-Morvan et al., 2004). Thus, the average CO production rate from our observation on November 4 is molecules s-1; the value during visit 6 was 15% smaller () and the value during visit 9 was 15% larger ().
The statistical uncertainty in , based on the measured signal-to-noise ratio in the average spectrum, is 20% (1). However, there are several sources of systematic error. The absolute calibration uncertainty is 15%. Based on previous results on similarly active comets, the estimated uncertainty in the outflow velocity is 25%. Another source of error is the mismatch between our fluorescence model and the observed CO band intensities. For example, the model predicts that the (2,0) band is slightly brighter than the (1,0) band whereas the observations indicate the opposite. However, this discrepancy can be attributed to a detector artifact, which has 3 larger dark current than the surrounding region, near the location of the (1,0) band. There are other discrepancies, of varying magnitudes (Figure 1, Table 2), between the measured and predicted CO band intensities. Taking all of these issues into account, we conclude that the true value of could be up to 50% different from our adopted value.
The relative abundance of CO in 103P is the ratio /Q, where Q is the water production rate. Although Q was not measured during our HST observations, an excellent record was obtained during ground-based infrared (IR) observations on November 4 (Dello Russo et al., 2011). Q (molecules s-1) increased by a factor of from the first IR observation (, 10:49–11:30 UT) to the last one (, 15:20–15:54 UT), but Q appeared to be leveling off during the final 2.5 hr of the IR observations (, 14:50–15:17 UT). Our first CO observation was 5.5 hr before the first IR observation, and our second CO observation was 4.0 hr after the last IR observation. By comparing when the HST and IR measurements were made relative to the periodic changes in the comet’s overall level of activity (Figure 3), we find that HST visit 6 was near the minimum activity level, and visit 9 was near the average activity level. The IR measurements were made during the rising portion of the activity phase curve, starting near the average level and ending at approximately the maximum. Assuming a peak-to-valley activity ratio of 2 for (A’Hearn et al., 2011), we therefore conclude that Q was during visit 6 and during visit 9, yielding CO abundances of 0.31% and 0.29%, respectively. Given the large uncertainties discussed above, we estimate that the CO abundance was 0.15–0.45%.
The CO abundance in 103P is apparently the lowest ever measured in a comet. Comets display a huge variation in the CO abundance, ranging from 0.4% to 30% (Bockelée-Morvan et al., 2004), but the reason why is unknown. Although the most CO–rich comets are long-period Oort cloud objects, some long period comets have very low CO abundances (0.4% for C/2001 WM1 [LINEAR]). There is not much information available on the CO abundance in Jupiter family comets (JFCs), the dynamical class to which 103P belongs, owing to their low activity levels. Infrared CO emission was detected from JFC 21P/Giacobini-Zinner in October 1999, implying a CO abundance as high as 15% (Mumma et al., 2000). But IR CO emission was not detected from 21P several weeks later, when the comet was brighter, giving a 5 CO abundance upper limit of 3% (Weaver et al., 1999). IR observations of JFC 73P/Schwassmann-Wachmann 3-C gave a CO abundance of % (DiSanti et al., 2007), comparable to the highest values allowed for 103P. A CO abundance of 4–6% was measured from JFC 9P/Tempel, both before and after the outburst associated with the Deep Impact event (Mumma et al., 2005; Feldman et al., 2006). A radio detection of CO emission from JFC 17P/Holmes yielded a CO abundance of 2–4% (Biver et al., 2008), but the observations were made shortly after the spectacular outburst of the nucleus in October 2008 and at a relatively large heliocentric distance, both of which are rather unusual circumstances. Similarly, it is difficult to assess the compositional implications of the detection of radio CO emission from 29P/Schwassmann-Wachmann 1 (Crovisier et al., 2009), whose orbit never brings it within 5.7 AU of the Sun.
We assume here that all the observed CO is coming directly from the nucleus. In some comets, a significant fraction of the CO observed in the coma is from “extended sources” (e.g., , ; cf., Bockelée-Morvan et al. 2004). However, our high spatial resolution HST observations strongly favor the “native” source sublimating directly from the nucleus. We calculate that the photodissociation of and would contribute 10% of the observed CO, assuming their relative abundances are 20% and 1%, respectively.
Similarly, the production rates quoted here assume all the is coming from sublimation at the nucleus. The results from the EPOXI mission suggest that a substantial fraction of the in the coma is produced by the sublimation of icy grains ejected in jets (A’Hearn et al., 2011). Ground-based IR observations show that the spatial profile is more extended than expected for a parent species (Dello Russo et al., 2011), suggesting at least one-third of the observed could be coming from an extended source (Dello Russo, priv. comm.). If the icy grains presumed to be the source of the extended emission have a different CO/ ratio than is present in the bulk nucleus, the CO/ abundance reported here might not reflect the true composition of the nucleus.
4 IMPLICATIONS
CO is predicted to be the dominant C-bearing gas in the outer parts of the solar nebula where comets formed (cf., Fegley & Prinn, 1989). However, CO is extremely volatile with a sublimation temperature of 20 K under solar nebula conditions (Yamamoto et al., 1983). Thus, the CO content of ices incorporated into comets may have been very sensitive to the local conditions where the nucleus formed, or where the coldest part of the nucleus formed assuming there was significant radial mixing of material within the nebula, as suggested by the results from the Stardust mission (Brownlee et al., 2006). The capture of CO might have been enhanced by incorporation into a water ice clathrate (Lunine, 1989; Marboeuf et al., 2010) or by trapping in amorphous water ice (Bar-Nun & Laufer, 2003). But even if they were formed with significant amounts of CO, JFCs can subsequently lose most of their original CO by solar heating during multiple passes through the inner solar system. This may not explain the CO depletion in 103P, which only recently had its perihelion distance substantially reduced. Another possible explanation is that any CO remaining in the nucleus is now buried below the regions that contribute significantly to the coma. In any case, our HST result suggests that CO is probably a minor player in the comet’s current activity and is not responsible for ejecting icy grains into the coma.
References
- A’Hearn et al. (2011) A’Hearn, M. F. et al. 2011, Science, submitted
- Bar-Nun & Laufer (2003) Bar-Nun, A., & Laufer, D. 2003, Icarus, 161, 157
- Biver et al. (2008) Biver, N., et al. 2008, LPI Contributions, 1405, 8146
- Biver et al. (2009) Biver, N., et al. 2009, A&A, 501, 359
- Bockelée-Morvan et al. (2004) Bockelée-Morvan, D., Crovisier, J., Mumma, M. J., & Weaver, H. A. 2004, The composition of cometary volatiles, ed. Festou, M. C., Keller, H. U., & Weaver, H. A. 391
- Brownlee et al. (2006) Brownlee, D., et al. 2006, Science, 314, 1711
- Carusi et al. (1985) Carusi, A., Kresak, L., Perozzi, E., & Valsecchi, G. B. 1985, Long-Term Evolution of Short-Period Comets (Bristol, England and Accord, MA, Adam Hilger, Ltd., 272 p.)
- Colangeli et al. (1999) Colangeli, L., et al. 1999, A&A, 343, L87
- Conway (1981) Conway, R. R. 1981, J. Geophys. Res., 86, 4767
- Crovisier et al. (2009) Crovisier, J., Biver, N., Bockelée-Morvan, D., & Colom, P. 2009, Planet. Space Sci., 57, 1162
- Dello Russo et al. (2011) Dello Russo, N. et al. 2011, ApJ, submitted
- DiSanti et al. (2007) DiSanti, M. A., Anderson, W. M., Villanueva, G. L., Bonev, B. P., Magee-Sauer, K., Gibb, E. L., & Mumma, M. J. 2007, ApJ, 661, L101
- Drahus et al. (2011) Drahus, M. et al. 2011, ApJ, submitted
- Fegley & Prinn (1989) Fegley, B., Jr., & Prinn, R. G. 1989, in The Formation and Evolution of Planetary Systems, ed. H. A. Weaver & L. Danly, 171
- Feldman & Brune (1976) Feldman, P. D., & Brune, W. H. 1976, ApJ, 209, L45
- Feldman et al. (2006) Feldman, P. D., Lupu, R. E., McCandliss, S. R., Weaver, H. A., A’Hearn, M. F., Belton, M. J. S., & Meech, K. J. 2006, ApJ, 647, L61
- Lunine (1989) Lunine, J. I. 1989, in The Formation and Evolution of Planetary Systems, ed. H. A. Weaver & L. Danly, 213
- Lupu et al. (2007) Lupu, R. E., Feldman, P. D., Weaver, H. A., & Tozzi, G. 2007, ApJ, 670, 1473
- Marboeuf et al. (2010) Marboeuf, U., Mousis, O., Petit, J., & Schmitt, B. 2010, ApJ, 708, 812
- Meech et al. (2009) Meech, K. J., et al. 2009, in AAS/Division for Planetary Sciences Meeting Abstracts, Vol. 41, AAS/Division for Planetary Sciences Meeting Abstracts #41, #20.07
- Meech et al. (2011) Meech, K. J. et al. 2011, ApJ, submitted
- Mumma et al. (2000) Mumma, M. J., DiSanti, M. A., Dello Russo, N., Magee-Sauer, K., & Rettig, T. W. 2000, ApJ, 531, L155
- Mumma et al. (2005) Mumma, M. J., et al. 2005, Science, 310, 270
- Weaver et al. (1994) Weaver, H. A., Feldman, P. D., McPhate, J. B., A’Hearn, M. F., Arpigny, C., & Smith, T. E. 1994, ApJ, 422, 374
- Weaver et al. (1999) Weaver, H. A., et al. 1999, Icarus, 142, 482
- Yamamoto et al. (1983) Yamamoto, T., Nakagawa, N., & Fukui, Y. 1983, A&A, 122, 171
| Visit #aaThe Visit # and Rootname refer to the values assigned by the STScI. | Instrument/bbThe Cosmic Origins Spectrograph (COS) was used in either its far ultraviolet (FUV) or near ultraviolet (NUV) configuration.The Space Telescope Imaging Spectrograph (STIS) was used in its CCD configuration. | GratingccThe grating designations refer to the values assigned by the STScI. | Central ddThe central wavelengths () for each grating are listed in angstroms (Å). | Start TimeeeThe Start Times are universal time (UT) values at the Earth; the time of closest approach of the EPOXI spacecraft was 13:59:47 UT. | ExposureffThe exposure time is the total integration time in seconds (s) and was typically divided among several individual exposures. | ObjectiveggThe Objective refers to the specific cometary emissions and molecules being targeted; see the text for further discussion. |
|---|---|---|---|---|---|---|
| Rootname | Configuration | (Å) | (UT HH:MM:SS) | Time (s) | ||
| 6 | COS/FUV | G160M | 1589 | 05:16:26 | 1310 | CO 4PG |
| LBK606 | for CO | |||||
| 7 | COS/NUV | G185M | 1986 | 11:39:38 | 1364 | CO Cameron |
| LBK607 | for | |||||
| 8 | STIS/CCD | G230LB | 2375 | 13:02:02 | 1800 | OH for , |
| LBK608 | CS for , | |||||
| 9 | COS/FUV | G160M | 1589 | 19:43:51 | 1100 | CO 4PG |
| LBK609 | for CO | |||||
| 10 | COS/NUV | G185M | 1986 | 22:59:14 | 866 | CO Cameron |
| LBK610 | for |
Note. — The comet’s geocentric and heliocentric distances were 0.157 AU and 1.064 AU, respectively, the Sun-Comet-Earth angle was 588, and the Sun-Earth-Comet angle was 113°. Only the data from Visit #s 6 and 9 are discussed in detail in this paper.
| BandaaThe CO bands are designated by their upper (v′) and lower (v′′) vibrational levels. | WavelengthbbThe wavelengths are for the band heads; the bands are degraded to the red (i.e., extend asymmetrically to longer wavelengths). | Brightness (Rayleighs)ccThe brightness is the band-integrated, aperture-averaged column brightness, and its 1 error, for the visit 6 (V6), visit 9 (V9), and average spectra displayed in Figure 1 (1 Rayleigh photons cm-2 s-1 sr-1). | ModelddThe model of Lupu et al. (2007) is matched to the observed spectra. | ||
|---|---|---|---|---|---|
| (v′,v′′) | (Å) | V6 | V9 | Average | (Rayleighs) |
| (4,0) | 1419.10 | ||||
| (3,0) | 1447.40 | ||||
| (2,0) | 1477.60 | ||||
| (1,0) | 1509.90 | ||||
| (3,2)(0,0) | 1542.511544.46 | ||||