11email: jonathan.marshall@uam.es 22institutetext: Friedrich-Schiller-Universität Jena, Astrophysikalisches Institut und Universitätssternwarte, 07743, Jena, Germany 33institutetext: Departmento de Astrofísica, Centro de Astrobiología (CAB, CSIC-INTA), ESAC Campus, P.O. Box 78, 28691
Villanueva de la Cañada, Madrid, Spain 44institutetext: Institut d’Astrophysique et de Géophysique, Université de Liège, 17 Allée du Six Août, B-4000 Sart Tilman, Belgium 55institutetext: Jet Propulsion Laboratory, California Institute of Technology, Pasadena, CA 91109, USA 66institutetext: ESA-ESAC Gaia SOC. P.O. Box 78 E-28691 Villanueva de la Cañada, Madrid, Spain 77institutetext: NASA Herschel Science Center, California Institute of Technology, 1200 E. California Blvd., Pasadena, CA 91125, USA 88institutetext: UJF-Grenoble 1 / CNRS-INSU, Institut de Planétologie et d’Astrophysique de Grenoble (IPAG) UMR 5274, Grenoble, F-38041, France 99institutetext: European Space Observatory, Alonso de Cordova 3107, Vitacura, Casilla 19001, Santiago 19, Chile 1010institutetext: UNINOVA-CA3, Campus da Caparica, Quinta da Torre, Monte de Caparica, 2825-149 Caparica, Portugal 1111institutetext: NASA Goddard Space Flight Center, Exoplanets and Stellar Astrophysics, Code 667, Greenbelt, MD 20771.USA 1212institutetext: Christian-Albrechts-Universität zu Kiel, Institut für Theoretische Physik und Astrophysik, Leibnizstr. 15, 24098 Kiel, Germany 1313institutetext: Max-Planck Institut für Astronomie, Königstuhl 17, 69117 Heidelberg, Germany 1414institutetext: John Hopkins University, Dept. of Physics and Astronomy, 3701 San Martin drive, Baltimore, MD 21210, USA 1515institutetext: ESA Astrophysics & Fundamental Physics Missions Division, ESTEC/SRE-SA, Keplerlaan 1, NL-2201 AZ Noordwijk,
The Netherlands 1616institutetext: INSA at ESAC, E-28691 Villanueva de la Cañada, Madrid, Spain 1717institutetext: Onsala Space Observatory, Chalmers University of Technology, Se-439 92 Onsala, Sweden 1818institutetext: LESIA, Observatoire de Paris, 92195 Meudon Principal Cedex, Paris, France 1919institutetext: Department of Physics and Astrophysics, Open University, Walton Hall, Milton Keynes MK7 6AA, UK 2020institutetext: Rutherford Appleton Laboratory, Chilton OX11 0QX, UK
A Herschel††thanks: Herschel is an ESA space observatory with science instruments provided by European-led Principal Investigator consortia and with important participation from NASA. Resolved Far-Infrared Dust Ring around HD 207129
Abstract
Context. Dusty debris discs around main sequence stars are thought to be the result of continuous collisional grinding of planetesimals in the system. The majority of these systems are unresolved and analysis of the dust properties is limited by the lack of information regarding the dust location.
Aims. The Herschel DUNES key program is observing 133 nearby, Sun-like stars ( 20 pc, FGK spectral type) in a volume limited survey to constrain the absolute incidence of cold dust around these stars by detection of far infrared excess emission at flux levels comparable to the Edgeworth-Kuiper belt (EKB).
Methods. We have observed the Sun-like star HD 207129 with Herschel PACS and SPIRE. In all three PACS bands we resolve a ring-like structure consistent with scattered light observations. Using Boötis as a reference point spread function (PSF), we deconvolved the images, clearly resolving the inner gap in the disc at both 70 and 100 m.
Results. We have resolved the dust-producing planetesimal belt of a debris disc at 100 m for the first time. We measure the radial profile and fractional luminosity of the disc, and compare the values to those of discs around stars of similar age and/or spectral type, placing this disc in context of other resolved discs observed by Herschel/DUNES.
Key Words.:
stars: individual: HD 207129, stars: circumstellar matter, infrared: stars1 Introduction
Debris discs are composed of dust grains continuously produced by the collisional grinding of larger unseen planetesimals. This is inferred from the short lifetime of the dust grains compared to the age of the star (Backman & Paresce 1993) and suggest that the star around which they are observed has undergone a planetesimal formation process. In almost all cases, dust production is consistent with steady state attrition of the dust parent bodies (Löhne et al. 2008). The vast majority of debris discs are unresolved and we can only use modelling of the disc spectral energy distribution (SED) to determine the spatial location of the dust and the physical properties of the constituent dust grains. In the absence of independent information constraining the spatial location of the dust, which introduces degeneracies into the fitting of the dust grain properties, e.g. between grain size and radial location, a standard dust composition is assumed. In the few examples of resolved debris discs, structures that imply the presence of a planetary mass body to maintain and sculpt the disc are frequently observed, e.g. warps, asymmetries and blobs (Golimowski et al. 2006; Kalas et al. 2005; Sheret et al. 2004). Planets may also be responsible for the inner cavities seen in resolved discs and inferred from the SEDs of unresolved ones (Wyatt 2008). The resolved disc structure can therefore be used as an indirect probe for exoplanets around such stars in regions of orbital radius/planetary mass parameter space that are otherwise inaccessible to traditional search methods (e.g. radial velocity, transits) and remain a challenge to direct imaging techniques.
HD 207129 (HIP 107649) was identified as having a debris disc by IRAS (Walker & Wolstencroft 1988) and followed up by both ISO and Spitzer (Jourdain de Muizon et al. 1999; Trilling et al. 2008). Extended emission from the disc has been seen in both scattered light (HST) and in thermal infrared emission (Spitzer MIPS70, Krist et al. 2010). The disc excess was also detected at 160 m by both Tanner et al. (2009) and Krist et al. (2010), though with very different values (155 mJy cf 250 mJy), illustrating the need for Herschel PACS observations to constrain the disc SED. Additionally, the system has been identified as a promising candidate for exoplanet searches, due to its proximity (16 pc), age (1–3 Gyr) and the presence of an inner gap in the disc (Jourdain de Muizon et al. 1999; Beichman et al. 2010).
In this paper we present Herschel (Pilbratt et al. 2010) PACS (Poglitsch et al. 2010) and SPIRE (Griffin et al. 2010) observations of HD 207129. The large aperture Herschel telescope provides arcsecond resolution allowing detailed imaging of the debris disc in this system. In addition, greater precision and denser coverage of the disc SED can be obtained. Altogether, this allows better constraints to be placed on the disc’s SED and physical extent compared to previous observations, thereby allowing additional refinement of our models of this solar system analogue.
2 Observations and data reduction
HD 207129 was observed as part of the DUNES (DUst around NEarby Stars; Eiroa et al. 2010, Rodmann et al., in prep.) volume limited survey of nearby ( 20 pc) Sun-like (FGK) stars. PACS scan map observations of the star were taken with both 70/160 and 100/160 channel combinations. Each scan map consisted of 10 legs of 3′ length, with a 4′′ separation between legs, at the medium slew speed (20′′ per second). The target was observed at two position angles (70 and 110∘) in both wavelength combinations. SPIRE small map mode observations were also carried out on a separate Observation Day (OD) covering a region 4′ around HD 207129 at the nominal slew speed (30′′/s). Using five repetitions of the scan map observations reduced the expected noise level to close to that of the expected extragalactic contribution (7–9 mJy at 250–500 m) and increased the coverage of the central region of the map allowing pixel sizes smaller than the standard values to be used in the image reconstruction process (i.e. image scales of 4′′, 6′′ and 8′′ per pixel at 250, 350 and 500 m, limited by the appearance of gaps in the image coverage near the centre of the map), which was useful for looking at extended structure in the source brightness profile. A summary of the observations is presented in Table 1.
2.1 Herschel photometry
PACS data reduction was carried out in HIPE 4.2 (the latest available public release111see: ), starting from the level 0 products using the standard reduction script. The separate scans at the two position angles of each channel pair were mosaiced to produce a final image at each wavelength. Image scales for the final mosaics were 1′′ per pixel for the blue (70/100 m) images and 2′′ per pixel for the red (160 m) image. A high-pass filter was used to remove large scale background emission from the images, with filter widths of 15 and 25′′ in the blue and red channels, respectively. A central region of 30′′ radius in the images was masked from the high pass filter process to prevent the removal of any faint extended structure near to the source. SPIRE data reduction was also carried out in HIPE 4.2, again starting from the level 0 data using the standard script and processing options. The SPIRE maps were created using the naive scan mapper alogrithm. The pixel scales for the SPIRE 250, 350 and 500 m images from which photometry was taken were 6′′, 10′′ and 14′′.
| Instrument | Observation ID | OD | Wavelengths | Duration |
|---|---|---|---|---|
| [m] | [s] | |||
| PACS | 1342193163/64 | 322 | 70/160 | 276.0 |
| PACS | 1342193165/66 | 322 | 100/160 | 2250.0 |
| SPIRE | 1342209300 | 544 | 250/350/500 | 721.0 |
PACS fluxes were measured using aperture photometry carried out using the IDL APER routine. The aperture radius and sky annulus dimensions were 20′′ and 30–40′′, respectively. SPIRE fluxes were measured using an aperture of radius 30′′ (due to the presence of several nearby sub-mm bright background objects), whilst the sky noise values were taken from Nguyen et al. (2010).
| Wavelength | Fobs | Instrument |
| [mJy] | ||
| 9 | 123717 | AKARI/IRC PSC, Ishihara et al. (2010) |
| 18 | 26331 | AKARI/IRC PSC, Ishihara et al. (2010) |
| 24 | 1555.3 | Spitzer/MIPS, Trilling et al. (2008). |
| 32 | 1115.1 | Spitzer/IRS |
| 70 | 27811 | Spitzer/MIPS, Trilling et al. (2008) |
| 160 | 25040 | Spitzer/MIPS, Krist et al. (2010) |
| 160 | 15820 | Spitzer/MIPS, Tanner et al. (2009) |
| 70 | 2841.5 | Herschel/PACS |
| 100 | 3111.1 | Herschel/PACS |
| 160 | 2111.5 | Herschel/PACS |
| 250 | 11318 | Herschel/SPIRE |
| 350 | 44.39 | Herschel/SPIRE |
| 500 | 25.98 | Herschel/SPIRE |
| 870 | 53 | APEX/LABOCA, Nilsson et al. (2010) |
2.2 Stellar parameters
HD 207129 (HIP 107649) is a nearby ( pc, van Leeuwen 2007) star with a reported spectral type of G2V (from the Hipparcos catalogue, Perryman et al. 1997) or G0V (Gray et al. 2006). The bolometric luminosity has been estimated from the absolute magnitude and bolometric correction using measurements by Flower (1996). Our adopted values for the effective temperature, gravity and metallicity are derived from the mean of spectroscopic measurements from Santos et al. (2004), Valenti & Fischer (2005) and Sousa et al. (2008). Our own estimate of the rotational velocity, from high resolution spectra, is sin 1.81 kms-1 (Maldonado et al., in prep.), consistent with estimates of Groot et al. (1996) and Torres et al. (2006). Assuming the stellar inclination is that of the disc (605∘, see Sect. 3.2) and the stellar radius is 1.07 R⊙ (estimated from the bolometric luminosity and effective temperature), the rotational period of the star is 12.6 days. The star is non-active, with measurements of the activity index, , of Henry et al. (1996) and Gray et al. (2006), and a ROSAT X-ray luminosity log .
The stellar mass estimated from the radius and gravity is 1.15 . From Padova evolutionary tracks (Girardi et al. 2002), a mass of 1.0–1.1 and age of 3.2 Gyr are obtained. This age is consistent with the activity index of Henry et al. (1996), using the calibration from Mamajek & Hillenbrand (2008). Conversely, the age derived from the rotational period using the same calibration is 1.6 Gyr, which is consistent with the X-ray luminosity age of 1.8 Gyr using the relationship of Garcés et al. (2010), or the results of Giardino et al. (2008) (their Fig. 8). Other age estimates range from 0.6 (Song et al. 2003) to 6.0 Gyr (Lachaume et al. 1999; Valenti & Fischer 2005; Holmberg et al. 2009). We measure a LiI 6708 equivalent width of 35.53.3 m (Maldonado et al., in prep.); this value, in conjunction with the estimate derived from the rotation period, points to an age greater than 600 Myr, implying the stellar age lies between these extremes. We therefore adopt an age in the range 1.5–3.2 Gyr as appropriate for HD 207129 (see Figs 6 and 9, Maldonado et al. 2010). The stellar parameters and observational properties are summarised in Table 3.
The stellar photosphere contribution to the total flux was computed, using the stellar parameters, from a synthetic stellar atmosphere model interpolated from the PHOENIX/GAIA grid (Brott & Hauschildt 2005). Optical and near infrared photometry including Stromgren , Tycho-2 and from Aumann & Probst (1991) constrain the stellar component of the SED, which has been scaled to the Spitzer IRS spectrum following the method of Bertone et al. (2004).
| Parameter | Value |
|---|---|
| Distance | 160.2 pc |
| Spectral type and luminosity class | G2V, G0V |
| , | 5.57, 0.60 mag |
| Absolute magnitude , Bolometric Correction | 4.55, –0.06 |
| Bolometric luminosity, | 1.258 L⊙ |
| Effective temperature | 5912 K |
| Surface gravity, | 4.44 |
| Radius, | 1.07 |
| Metallicity, | –0.01 |
| Rotational velocity, | 3.71 kms-1 |
| Rotation period, | 12.6 days |
| Activity, | –4.80, –5.02 |
| X-Ray luminosity, | –5.63 |
| Mass, | 1.0–1.15 |
| Age | 1.5–3.2 Gyr |
3 Results
3.1 Disc spectral energy distribution
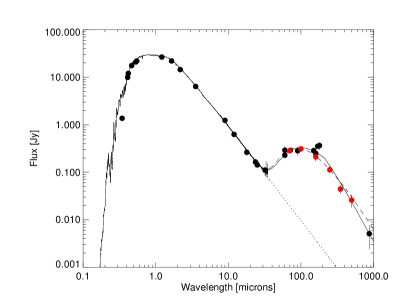
For the purposes of disc SED modelling, the PACS photometry was supplemented by a broad range of infrared and sub-millimetre observations including AKARI IRC all-sky survey 9/18 m (Ishihara et al. 2010), Spitzer IRS spectrum and MIPS 24 and 70 m photometry (Trilling et al. 2008), Spitzer 160 m (Krist et al. 2010), APEX/LABOCA 870 m (Nilsson et al. 2010) fluxes and upper limits from 450/850 m JCMT/SCUBA (Sheret et al. 2004) and 1.2 mm SEST (Schütz et al. 2005) observations. The Herschel photometry and all complementary data are summarised in Table 2 (the upper limits are not quoted in the table because they were not used in the SED fitting process).
The disc SED, with the Herschel fluxes and ancillary photometry can be seen in Fig 1. We have fitted the excess emission from HD 207129 with a standard black body model, modified beyond 210 m by a factor of = 1 (see Eqn 6, Wyatt 2008), from which estimates of the disc fractional luminosity and disc orbital radius were derived. The model was fitted to the infrared (both Herschel and ancillary) photometry through least squares minimisation weighted by the observational uncertainties. The best fit temperature K and fractional luminosity were obtained with a reduced of 1.34. Using the derived stellar parameters and the typical disc temperature, we calculate a dust orbital radius of 34 AU for black body emission, clearly much smaller than the resolved disc which would imply that a disc orbital radius larger than that derived from the black body modelling is required.
3.2 Disc images
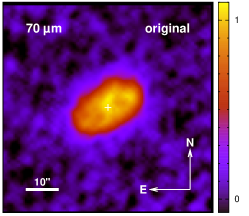
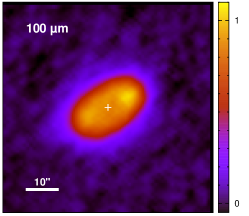
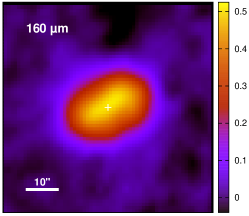
The disc of HD 207129 is clearly resolved in the PACS mosaics at all three wavelengths and is extended in the two shorter SPIRE wavelength maps. The optical position of HD 207129 is (in the epoch of the Herschel images) 21h48m16.05s -47∘18′14.47′′ (using proper motions from the re-reduction of Hipparcos, van Leeuwen 2007). In the PACS 70 m image there is a peak in the disc brightness 2′′ NE from this position, consistent with the optical position within the Herschel pointing uncertainty, with a flux value consistent with the predicted stellar photosphere contribution. If this peak were the star, that would imply that the disc was asymmetric. In the deconvolution presented here, we have assumed that the star is at the centre of the disc, consistent with the symmetric scattered light disc observed in the HST results (Krist et al. 2010), and that the peak observed in the 70 m image is a dust blob.
The disc size and position angle were measured by fitting a rotated ellipse to the source brightness profile contour of 3 times the sky noise value in the PACS images, whilst the disc inclination is measured from the ratio of the semi-minor to semi-major axes. A summary of these properties is in Table 4. The disc extent is the same in both the 70 and 100 m images, though we would naively expect that the apparent disc size would increase due to the larger beam size and greater contribution from colder dust emission. We attribute the similar disc sizes to a combination of the similar beam sizes at the two wavelengths (5.7′′ and 6.7′′ FWHM at 70 and 100 m, respectively) which are both small compared to the extent of the disc. In both the 70 m and 100 m image, there are two peaks in the source brightness profile, with the NW peak 10% brighter than the SE one (at 100 m). This structure is consistent with the underlying disc being a symmetric ring-like structure. Additionally at 70 m, there is a third peak close to the centre of the disc, which is NE ( 2′′) of the disc centre and stellar position, which may be the result of inhomogenities in the disc structure. The disc source brightness profile at 160 m (and in the SPIRE images) is smooth, showing no internal structure.
| Wavelength | ||||||
| 70 m | 100 m | 160 m | ||||
| Semi-major axis [′′] | 14.5 | 9.0 | 14.0 | 9.0 | 17.0 | 8.5 |
| Semi-major axis [AU] | 232 | 144 | 224 | 144 | 272 | 136 |
| Semi-minor axis [′′] | 8.5 | 4.0 | 8.5 | 4.5 | 12.0 | 4.0 |
| Semi-minor axis [AU] | 136 | 64 | 136 | 72 | 192.0 | 64 |
| Position anglea [∘] | 120 | 122 | 120 | |||
| Inclinationb [∘] | 54 | 64 | 53 | 60 | 45 | 62 |
| aThe disc position angles are the same in both original and | ||||||
| deconvolved images. | ||||||
| bThe disc minor axis is not resolved at 160 m in the original images. | ||||||
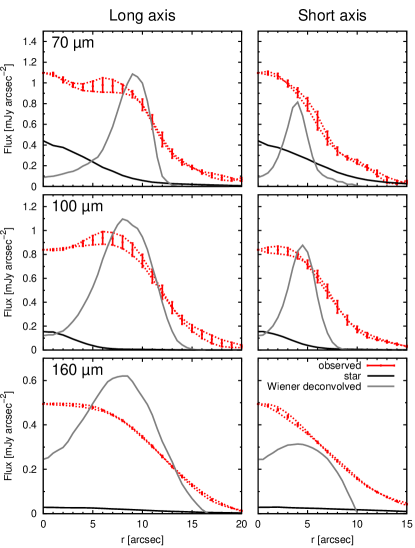
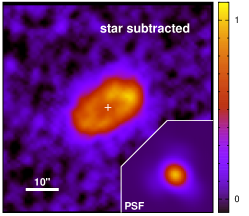
In order to measure the true extent of the disc, the images were deconvolved from the instrument PSF, a technique which has previously proved successful (Liseau et al. 2010). An observation of Boötis was used as the PSF model for the deconvolution, rotated to match the roll angle of the telescope at the time of observing HD 207129.
Deconvolution was a two step process; the stellar photosphere contribution was removed from each image by subtraction of a PSF with a peak scaled to the predicted photospheric flux level in that image and centred on the stellar position determined from measurement of the 70 m isophotes. The optical and isophote derived positions are in good agreement and the small offset between them does not impact upon the findings of this analysis.
After star subtraction, the image was deconvolved using three separate methods (modified Wiener, Richardson-Lucy and van Cittert) to check the suitability of the individual methods and the repeatability of any structure observed in the deconvolved images. It was found that all three methods clearly produced a ring structure in the deconvolved 70 and 100 m images, though with varying noise patterns. Deconvolution of the 160 m image via modified Wiener and van Cittert methods resulted in images with the disc structure as a pair of blobs either side of the stellar position. Using the Richardson-Lucy method the disc structure at 160 m was recovered as a broken ring surrounding the stellar position with a clear central gap. We do not interpret the clumpy blobs in the deconvolved disc images as representing real structure in the debris disc. The result of the image deconvolution using the modified Wiener method can be seen in Fig. 3.
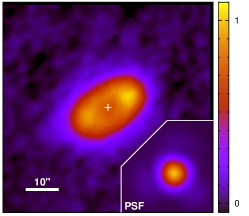
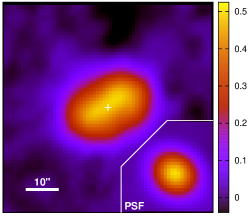
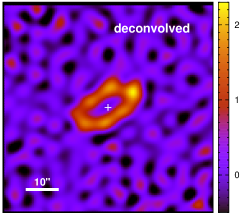
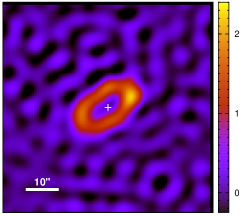
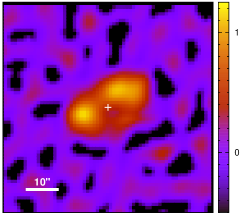
The deconvolved radial extent of the disc was measured from the position of the peak brightness of the observed disc annulus along its major and minor axes. In the deconvolved 100 m image, the measured radial extent was 9′′ 2′′ (14432 AU, see Fig 2), with similar values from the 70 and 160 m images. We measure the position angle of the disc to be 1205∘ through fitting via a least squares minimisation algorithm. From the ratio of the semi-major and semi-minor axes, the inclination to be 545∘ (605∘ in the deconvolved images). These results are consistent with previous HST measurements (Krist et al. 2010). We see no shift in the positional angle of the disc toward longer wavelengths.
3.3 Discussion
We have directly resolved the structure of a ring-like debris disc for the first time in the far infrared. The disc radial extent of 140 AU is comparable to that of Fomalhaut (Kalas et al. 2005) or HD 107146 (Ardila et al. 2004).
The disc radius derived from the standard black body model, modified beyond 210 m by a factor of = 1, was 34 AU. This is a large underestimate of the true extent, in direct conflict with the resolved images. It serves to illustrate the dangers of modelling debris discs using only the SED and/or black body thermal emission models, which neither assume, nor tell you anything about, the dust grain optical properties (Wyatt 2008). Using a disc of dust grains that emit as modified black bodies and 10 m dust grains, with a break shortward of the SED peak, the disc radius derived from the SED matches the observed images but fails to reproduce the sub-millimetre slope. The observed dust optical and thermal emission properties cannot be reconciled via Mie theory, either. A disc composed of small (m) dust grains would, according to Mie theory, reproduce the symmetric scattered light image, though the dust would then be too warm to reproduce the SED (Krist et al. 2010).
We measure a dust fractional luminosity of 8.310-5, around six times greater than Vega (, Habing et al. 2001) and half that of q1 Eri (, Liseau et al. 2008). The value we measure is consistent with the fractional luminosity/age relation from Decin et al. (2003). The disc extent, 140 AU, is larger than other DUNES resolved discs, e.g. q1 Eri (85 AU, Liseau et al. 2010) or Ret (70–120 AU, Eiroa et al. 2010), but the derived black body temperature is also large, 50 K, cf 60 K for the q1 Eri disc which is around an F star and 30–40 K for the Ret disc which has a smaller extent around a star of similar spectral type.
A complete analysis of the disc SED and physical structure, in which both classical power-law particle size distribution models and a self-consistent collisional model are fitted to the available photometric and imaging data will be presented by Löhne et al., 2011 (in prep.).
4 Conclusions
We have presented Herschel PACS and SPIRE observations of HD 207129, the first to directly resolve the ring-like structure of a debris disc in both major and minor axes at far infrared wavelengths. The disc extent (140 32 AU), inclination (51 5∘) and typical (black body) temperature ( 50 K), derived purely from the observations assuming no particular grain model, are similar to previous measurements. Compared to other discs around stars of similar spectral type and age, the disc of HD 207129 is both larger and warmer (for the observed size), though it is not completely atypical in either respect, but situated at the margins of the known range of disc morphologies. A simple analysis based on a black body model has been proved unrealistic. A more detailed self-consistent study is left for future work (Löhne et al, in prep.).
References
- Ardila et al. (2004) Ardila, D. R., Golimowski, D. A., Krist, J. E., et al. 2004, ApJ, 617, L147
- Aumann & Probst (1991) Aumann, H. H. & Probst, R. G. 1991, ApJ, 368, 264
- Backman & Paresce (1993) Backman, D. E. & Paresce, F. 1993, in Protostars and Planets III, ed. E. H. Levy & J. I. Lunine, 1253–1304
- Beichman et al. (2010) Beichman, C. A., Krist, J., Trauger, J. T., et al. 2010, PASP, 122, 162
- Bertone et al. (2004) Bertone, E., Buzzoni, A., Chávez, M., & Rodríguez-Merino, L. H. 2004, AJ, 128, 829
- Brott & Hauschildt (2005) Brott, I. & Hauschildt, P. H. 2005, in ESA Special Publication, Vol. 576, The Three-Dimensional Universe with Gaia, ed. C. Turon, K. S. O’Flaherty, & M. A. C. Perryman, 565
- Decin et al. (2003) Decin, G., Dominik, C., Waters, L. B. F. M., & Waelkens, C. 2003, ApJ, 598, 636
- Eiroa et al. (2010) Eiroa, C., Fedele, D., Maldonado, J., et al. 2010, A&A, 518, L131
- Flower (1996) Flower, P. J. 1996, ApJ, 469, 355
- Garcés et al. (2010) Garcés, A., Ribas, I., & Catalán, S. 2010, in Astronomical Society of the Pacific Conference Series, Vol. 430, Astronomical Society of the Pacific Conference Series, ed. V. Coudé Du Foresto, D. M. Gelino, & I. Ribas, 437–+
- Giardino et al. (2008) Giardino, G., Pillitteri, I., Favata, F., & Micela, G. 2008, A&A, 490, 113
- Girardi et al. (2002) Girardi, L., Bertelli, G., Bressan, A., et al. 2002, A&A, 391, 195
- Golimowski et al. (2006) Golimowski, D. A., Ardila, D. R., Krist, J. E., et al. 2006, AJ, 131, 3109
- Gray et al. (2006) Gray, R. O., Corbally, C. J., Garrison, R. F., et al. 2006, AJ, 132, 161
- Griffin et al. (2010) Griffin, M. J., Abergel, A., Abreu, A., et al. 2010, A&A, 518, L3
- Groot et al. (1996) Groot, P. J., Piters, A. J. M., & van Paradijs, J. 1996, A&AS, 118, 545
- Habing et al. (2001) Habing, H. J., Dominik, C., Jourdain de Muizon, M., et al. 2001, A&A, 365, 545
- Henry et al. (1996) Henry, T. J., Soderblom, D. R., Donahue, R. A., & Baliunas, S. L. 1996, AJ, 111, 439
- Holmberg et al. (2009) Holmberg, J., Nordström, B., & Andersen, J. 2009, A&A, 501, 941
- Ishihara et al. (2010) Ishihara, D., Onaka, T., Kataza, H., et al. 2010, A&A, 514, A1
- Jourdain de Muizon et al. (1999) Jourdain de Muizon, M., Laureijs, R. J., Dominik, C., et al. 1999, A&A, 350, 875
- Kalas et al. (2005) Kalas, P., Graham, J. R., & Clampin, M. 2005, Nature, 435, 1067
- Krist et al. (2010) Krist, J. E., Stapelfeldt, K. R., Bryden, G., et al. 2010, AJ, 140, 1051
- Lachaume et al. (1999) Lachaume, R., Dominik, C., Lanz, T., & Habing, H. J. 1999, A&A, 348, 897
- Liseau et al. (2010) Liseau, R., Eiroa, C., Fedele, D., et al. 2010, A&A, 518, L132
- Liseau et al. (2008) Liseau, R., Risacher, C., Brandeker, A., et al. 2008, A&A, 480, L47
- Löhne et al. (2008) Löhne, T., Krivov, A. V., & Rodmann, J. 2008, ApJ, 673, 1123
- Maldonado et al. (2010) Maldonado, J., Martínez-Arnáiz, R. M., Eiroa, C., Montes, D., & Montesinos, B. 2010, A&A, 521, A12
- Mamajek & Hillenbrand (2008) Mamajek, E. E. & Hillenbrand, L. A. 2008, ApJ, 687, 1264
- Nguyen et al. (2010) Nguyen, H. T., Schulz, B., Levenson, L., et al. 2010, A&A, 518, L5
- Nilsson et al. (2010) Nilsson, R., Liseau, R., Brandeker, A., et al. 2010, A&A, 518, A40
- Perryman et al. (1997) Perryman, M. A. C., Lindegren, L., Kovalevsky, J., et al. 1997, A&A, 323, L49
- Pilbratt et al. (2010) Pilbratt, G. L., Riedinger, J. R., Passvogel, T., et al. 2010, A&A, 518, L1
- Poglitsch et al. (2010) Poglitsch, A., Waelkens, C., Geis, N., et al. 2010, A&A, 518, L2
- Santos et al. (2004) Santos, N. C., Israelian, G., & Mayor, M. 2004, A&A, 415, 1153
- Schütz et al. (2005) Schütz, O., Meeus, G., & Sterzik, M. F. 2005, A&A, 431, 175
- Sheret et al. (2004) Sheret, I., Dent, W. R. F., & Wyatt, M. C. 2004, MNRAS, 348, 1282
- Song et al. (2003) Song, I., Zuckerman, B., & Bessell, M. S. 2003, ApJ, 599, 342
- Sousa et al. (2008) Sousa, S. G., Santos, N. C., Mayor, M., et al. 2008, A&A, 487, 373
- Tanner et al. (2009) Tanner, A., Beichman, C., Bryden, G., Lisse, C., & Lawler, S. 2009, ApJ, 704, 109
- Torres et al. (2006) Torres, C. A. O., Quast, G. R., da Silva, L., et al. 2006, A&A, 460, 695
- Trilling et al. (2008) Trilling, D. E., Bryden, G., Beichman, C. A., et al. 2008, ApJ, 674, 1086
- Valenti & Fischer (2005) Valenti, J. A. & Fischer, D. A. 2005, ApJS, 159, 141
- van Leeuwen (2007) van Leeuwen, F. 2007, A&A, 474, 653
- Walker & Wolstencroft (1988) Walker, H. J. & Wolstencroft, R. D. 1988, PASP, 100, 1509
- Wyatt (2008) Wyatt, M. C. 2008, ARA&A, 46, 339