Two-Fermi-surface superconducting state and a nodal -wave gap in the electron-doped Sm1.85Ce0.15CuO4-δ cuprate superconductor.
Abstract
We report on laser-excited angle-resolved photoemission spectroscopy (ARPES) in the electron-doped cuprate Sm1.85Ce0.15CuO4-δ. The data show the existence of a nodal hole-pocket Fermi-surface both in the normal and superconducting states. We prove that its origin is long-range antiferromagnetism by an analysis of the coherence factors in the main and folded bands. This coexistence of long-range antiferromagnetism and superconductivity implies that electron-doped cuprates are two-Fermi-surface superconductors. The measured superconducting gap in the nodal hole-pocket is compatible with a -wave symmetry.
pacs:
74.25.Jb, 74.72.EkIn cuprates, the ground state at half-filling is an antiferromagnetic (AFM) insulator, and superconductivity appears upon doping Tokura-AFM-SC-Competition-eDoped . In the electron-doped cuprates, the superconducting (SC) and Néel temperatures, as well as the actual carrier density, depend on both the Ce () and O-vacancy () concentrations Kang-Annealing-eDoped . In these materials, transport studies Greene-QCP-PCCO ; Greene-MagnetoTransport-PCCO suggested a coexistence of antiferromagnetism and superconductivity up to dopings , slightly above the optimal doping () On the other hand, inelastic neutron scattering experiments claimed that long-range antiferromagnetism and superconductivity are adjacent, rather than coexisting, phases Motoyama-NeutronsNCCO . These apparently contradictory results might be related to different annealing conditions, as stated above, or sample inhomogeneity.
Previous ARPES experiments in reduced SC samples reported band folding Ikeda-LnCeCuO-PRB ; Matsui-BandFolding-UndNCCO ; Park-UndSCCO , interpreted as either due to an anisotropic AFM gap Matsui-BandFolding-UndNCCO or to short-range-order antiferromagnetism Park-UndSCCO . A Fermi-surface electron-pocket around ( is the in-plane lattice parameter) was observed in underdoped or optimally-doped samples Ikeda-LnCeCuO-PRB ; Park-UndSCCO . Other ARPES Matsui-SCgap and Raman Blumberg-Raman-SCgap experiments in optimally doped samples claimed a continuous ‘non-monotonic -wave’ SC gap, with the gap increasing from zero at to a maximum near the ‘hot-spots’, where the Fermi surface crosses the AFM zone-boundary, and stalling at a nearly constant amplitude in the region between the hot spots and . Recently, Shubnikov-de Haas (SdH) oscillations in SC samples of Nd2-xCexCuO4-δ showed the existence of small Fermi-surface pockets of area % of the Brillouin zone in optimally- and slightly over-doped samples, interpreted as the nodal hole pockets created by long-range AFM ordering Helm-SdH-NCCO . However, the crucial issues of proving directly the coexistence of long-range antiferromagnetism and superconductivity, the existence of a nodal hole-pocket Fermi-surface, and how the SC gap opens over the AFM-folded band structure, remain open.
Laser-excited ARPES is essential to address these questions. First, electron-doped cuprates do not present a unique terminal surface upon cleaving, because of their crystal structure. This calls for a bulk sensitive technique. Second, their nodal Fermi wave-vector is very close to the AFM zone boundary, so that any folded bands are very close in momentum space –besides having weak spectral weight and large linewidths Armitage-SelfEnNCCO . This needs high momentum resolution and low background from inelastically-scattered electrons. Third, the expected SC gap is of the order of a few meV, requiring high energy resolution. Laser-ARPES gathers all these advantages, due to the low photoelectron kinetic energy and the high intrinsic resolution of the laser light Kiss-BulkSensitive-SrVO3 ; Koralek-LaserARPES-Bi2212 .
In this Letter we show, using laser-ARPES, that long-range antiferromagnetism and superconductivity coexist in the electron-doped cuprate Sm1.85Ce0.15CuO4-δ (SCCO). The data reveal, for the first time, a hole-pocket Fermi-surface around . The spectral weights in the ‘main’ and ‘folded’ bands of this hole-pocket coincide with the coherence factors of a system with homogeneous long-range antiferromagnetism. The SC gap observed in the hole pocket is -wave like. Our data imply that electron-doped cuprates are two-Fermi-surface superconductors.
High-quality single crystals of SCCO were grown by a flux method and then annealed under low-oxygen pressure to render them SC Greene-XtalGrowth with a K determined by SQUID magnetometry. Wavelength dispersive X-ray analysis yielded . The high-resolution laser-ARPES experiments were performed with a Gammadata R4000 analyzer and an ultraviolet laser at eV Kiss-LaserARPES . The energy and momentum resolutions were respectively 2 meV and Å-1. The pressure of the chamber was Torr throughout all the measurements. The Laue-oriented crystals were cleaved in situ at K, just before the measurements. The doping was checked by a Fermi-surface fit to the experimental Fermi momenta in the nodal arc using a single-band tight-binding model Optics-PCCO-Millis-Zimmers , giving per formula unit.
We recall that ARPES measures the occupied part of the energy () and momentum () dependent single-particle spectral function . We note the independent-particle dispersion, the folding vector, and the AFM gap at . Then, the conduction (, ) and valence (, ) bands in the presence of long-range AFM order are Bansil-TwoBand-NonMonoDwave ; Belen-Leni-Uk2Vk2 :
| (1) |
with
| (2) |
The spectral function is Bansil-TwoBand-NonMonoDwave ; Belen-Leni-Uk2Vk2 :
| (3) |
where is the electron scattering rate. The coherence factors, which quantify the removal probability of an electron from the ‘main’ and ‘folded’ bands, are Bansil-TwoBand-NonMonoDwave ; Belen-Leni-Uk2Vk2 :
| (4) |
Experimentally, we only have access to features below , namely and . However, for at , it can be shown that . In this case, the spectral weights of the main and folded bands below correspond to and , respectively, verifying the sum rule .
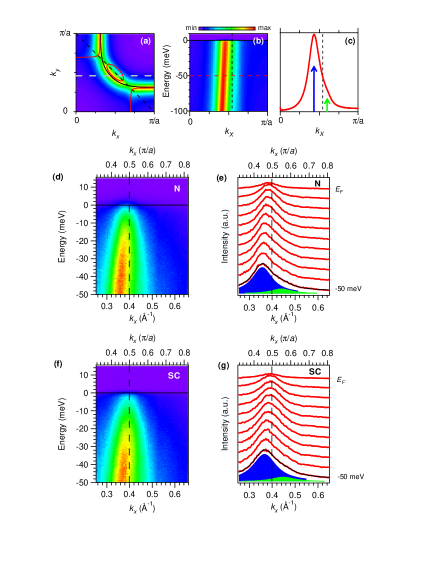
Figures. 1(a-c) are a guide to our data analysis. They present a simulation of AFM folding in the spectral function of an electron-doped cuprate using values for the AFM gap and scattering rate close to the ones inferred from our data (see later). Due to coherence factors and the scattering introduced in the simulation, the folded band is seen neither in the Fermi surface shown in figure 1(a) nor in the energy-momentum map along the node shown in figure 1(b). However, its presence yields a shoulder (or an overall assymetric line-shape) in the momentum distribution curves (MDCs), as in figure 1(c), and observed in the data discussed below.
Figures 1(d-g) show measurements for cuts along passing through the node. Figs. 1(d, e) present the measured energy-momentum intensity maps and the corresponding MDCs, in the normal state at K [to be compared to figures 1(b)-(c)]. Figs. 1(f, g) display the equivalent data in the SC state at K. Note that, as in the simulations, the MDCs in both the normal and SC states present an asymmetric shape, with a distinct peak at wavevectors smaller than the AFM zone boundary (, black dashed line) and a shoulder at . The peak and shoulder disperse towards each other as they approach . We found that the MDCs can be very well fitted by two Lorentzians symmetrically distributed around , of equal width (full width at half maximum Å-1) but different amplitudes, as shown by the fits to the MDCs at meV in Figs.1(e, g) (we checked that relaxing all these conditions does not change the results that follow). This is fully compatible with the simulations shown in Fig. 1(c). Therefore, we ascribe the peak and shoulder features to the main and folded bands at the AFM wave vector, respectively. To prove that such an assignment is correct, we determined the coherence factors for the main and folded bands in the normal state by using the two independent methods described below.
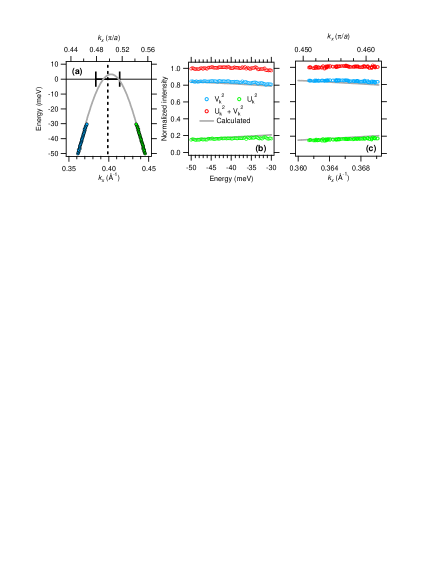
For the first method, we performed the above two-Lorentzian fits for the MDCs in the range meV meV, because for energies closer to the fit breaks down. The widths of the Lorentzians were found to be constant within experimental uncertainties in this energy range. Thus, the amplitude parameter of each Lorentzian represents and for the main and folded bands, respectively. The dispersions for the main and folded bands, resulting from the centers of the Lorentzians, are shown by the blue and green filled circles in Fig. 2(a). The corresponding spectral weights are represented as a function of energy by the blue and green open circles in Fig. 2(b), and as a function of momentum in Fig. 2(c). The total spectral weight , shown by the red open circles in Figs. 2(b)-(c), is found to be constant within error bars. This indicates that the sum rule is obeyed. Thus, the average of the total spectral weight was taken as an absolute normalization factor for the amplitude of each band to define the vertical scales in Figs. 2(b)-(c). Note that the experimental band velocity is about 20 meV0.01 Å eV Å, which together with the linewidth of Å-1 from Fig. 1(e) gives a scattering rate of approximately 200 meV, as in the simulations presented in Fig. 1.
For the second method, we calculated and from Eqns. 1, 2, and 4. These are completely determined by a model for the unfolded band, the folding vector and the AFM gap, independently of the experimental coherence factors. We fitted the experimental main and folded bands in Fig. 2(a) using a tight-binding band for (we checked that other model bands, like a linearly-dispersing band, give consistent results) folded by a vector with an AFM gap meV –compatible with other estimates for samples of similar doping Park-UndSCCO ; Optics-PCCO-SDWgap-Zimmers ; Zimmers-STM-SCCO . The resulting calculated dispersion and coherence factors are represented by the grey lines in Figs. 2(a)-(c). There is an excellent agreement between the two sets of coherence factors determined from the two independent procedures. This is unambiguous evidence for long-range AFM band-folding and the presence of a small nodal hole-pocket Fermi-surface as shown in Fig. 2(a). In fact, note that a hypothetical superposition of AFM non-SC regions and paramagnetic SC regions (which would be the case for, e.g., a non-homogeneous sample or for short-range AFM order), or equivalently, a superposition of single-sheet and two-sheet Fermi surfaces cannot possibly explain our observations: the summed spectral weights of the superposed bands would obliterate any correlation to the expected coherence factors Park-UndSCCO . Additionally, scanning tunneling experiments on the same batch of samples found evidence for a local coexistence of antiferromagnetism and superconductivity in all the explored regions of the sample Zimmers-STM-SCCO .
We checked (not shown) that similar analysis can be performed for band-folding observed along other cuts off the node, reinforcing the robustness of our conclusions.
We can now estimate a lower bound for the AFM correlation length () from the observed AFM folding: it was shown that dispersive folded bands exist when , where is the Fermi velocity and the right-hand-side is the electron thermal wavelength Lee-Rice-Anderson-FluctuationsPierls ; Vilk-FoldedBands-AFMCorrLength . From the measured eV Å, we deduce that at 5 K, in the SC state, Å, or equivalently , in agreement with estimates from recent SdH oscillations Helm-SdH-NCCO . Furthermore, according to neutron scattering data in other electron-doped cuprates, the onset of long-range AFM order is reached when Motoyama-NeutronsNCCO ; Greven-SpinCorrelations-AFM-NonSC-NCCO . Hence, we conclude that long-range antiferromagnetism and superconductivity coexist in the samples studied here.
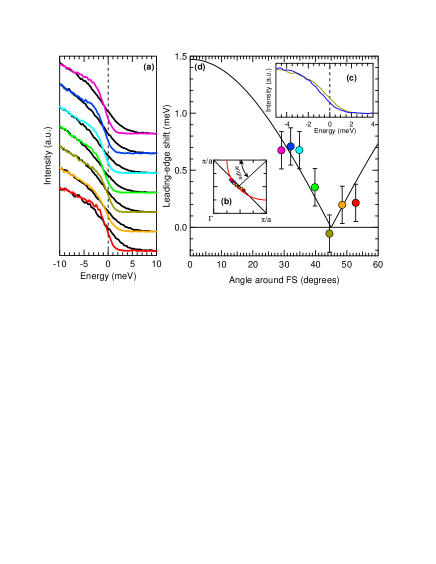
We now study the SC gap in the hole pocket around the diagonal direction. Figure 3(a) presents the energy distribution curves (EDCs) at the Fermi wave vector in the normal state at K (black lines) and the SC state at K (color lines) at several loci in the Fermi-surface hole-pocket specified in Fig. 3(b). Fig. 3(c) shows the two EDCs at 5.7 K along the node and away from the node. In the SC state, the leading edge of each EDC shifts to larger binding energies as one moves away from the node. In order to estimate the momentum-dependence of the SC gap (), we fitted the EDCs in the normal and SC states in figure 3(a) by resolution-broadened Fermi-Dirac functions with the Fermi energy (defining the leading-edge energy) being determined by the fit. The resulting leading-edge shift () as a function of angle around the Fermi-surface is shown in Fig. 3(d). It is compatible with a -wave gap of amplitude meV, as shown by the fit (black line) in Fig. 3(d). Using K, and the empirical relation Matsui-SCgap , the maximum SC gap that the system would have in absence of band folding is . This is comparable to the weak-coupling -wave BCS value of and to the ratio of from measurements of the SC gap near the hot spots in other electron-doped cuprates Matsui-SCgap ; Blumberg-Raman-SCgap .
In summary, our data give new crucial inputs to the understanding of electron-doped cuprates. We directly observed the small Fermi-surface nodal hole pockets, where a -wave-like SC gap opens, and proved that long-range antiferromagnetism and superconductivity coexist in optimally-doped SCCO. Together with the previously reported electron pockets at Ikeda-LnCeCuO-PRB ; Park-UndSCCO and the non-monotonic SC gap over the whole Fermi surface Matsui-SCgap ; Blumberg-Raman-SCgap , our observations imply that electron-doped cuprates are two-Fermi-surface superconductors, and suggest that, in contrast to the nodal hole pocket, the electron pocket around becomes fully gapped in the SC state, the gap being nearly isotropic. As proposed by several theories of electron-doped cuprates Yuan-Ting-TwoBand-NonMonoDwave ; Bansil-TwoBand-NonMonoDwave ; Luo-Xiang-SFD , a two-SC-gap picture would explain the apparent non-monotonic -wave gap and the anomalous temperature dependence of the superfluid density Kim-Anomalous-SFD , which presents a positive curvature close to –a property of two-band superconductors Xiang-Wheatley-TwoBand-SCs .
We thank B. Liang and P. Li for help in the sample growth and characterization, and B. Valenzuela, E. Bascones, A. Millis and A.-M. Tremblay for discussions. Work at University of Tokyo was supported by a Grant-in-Aid for Priority Area “Invention of Anomalous Quantum Materials” from MEXT, Japan. Work at the University of Maryland was supported by NSF DMR-0653535.
References
- (1) H. J. Kang et al., Nature 423, 522 (2003).
- (2) H. J. Kang et al., Nature Mater. 6, 224 (2007).
- (3) Y. Dagan et al., Phys. Rev. Lett. 92, 167001 (2004).
- (4) W. Yu et al., Phys. Rev. B. 76, 020503 (2007).
- (5) E. M. Motoyama et al., Nature 445, 186 (2007).
- (6) M. Ikeda et al., Phys. Rev. B 80, 014510 (2009).
- (7) H. Matsui et al., Phys. Rev. Lett. 94, 047005 (2005).
- (8) S. R. Park et al., Phys. Rev. B 75, 060501 (2007).
- (9) H. Matsui et al., Phys. Rev. Lett. 95, 017003 (2005).
- (10) G. Blumberg et al., Phys. Rev. Lett. 88, 107002 (2002).
- (11) T. Helm et al., Phys. Rev. Lett. 103, 157002 (2009).
- (12) N. P. Armitage et al., Phys. Rev. B 68, 064517 (2003).
- (13) R. Eguchi et al., Phys. Rev. Lett. 96, 076402 (2006).
- (14) J. D. Koralek et al., Phys. Rev. Lett. 96, 017005 (2006).
- (15) J. L. Peng, Z. Y. Li and R. L. Greene, Physica C 177, 79 (1991).
- (16) T. Kiss et al., Rev. Sci. Inst. 79, 023106 (2008).
- (17) A. J. Millis et al., Phys. Rev. B 72, 224517 (2005).
- (18) T. Das, R. S. Markiewicz and A. Bansil, Phys. Rev. B 74, 020506(R) (2006).
- (19) B. Valenzuela and E. Bascones, Phys. Rev. B 78, 174522 (2008).
- (20) A. Zimmers et al., Europhys. Lett. 70, 225 (2005).
- (21) A. Zimmers et al., Phys. Rev. B 76, 132505 (2007).
- (22) P. A. Lee, T. M. Rice and P. W. Anderson, Phys. Rev. Lett. 31, 462 (1973).
- (23) Y. M. Vilk, Phys. Rev. B 55, 3870 (1997).
- (24) P. K. Mang et al., Phys. Rev. Lett. 93, 027002 (2004).
- (25) Q. Yuan, F. Yuan and C. S. Ting, Phys. Rev. B 73, 054501 (2006).
- (26) H. G. Luo and T. Xiang, Phys. Rev. Lett. 94, 027001 (2005).
- (27) M.-S. Kim et al., Phys. Rev. Lett. 91, 087001 (2003).
- (28) T. Xiang and J. M. Wheatley, Phys. Rev. Lett. 76, 134 (1996).