The number density and mass density of star-forming and quiescent galaxies at
Abstract
We study the build-up of the bimodal galaxy population using the NEWFIRM Medium-Band Survey, which provides excellent redshifts and well-sampled spectral energy distributions of galaxies with at . We first show that star-forming galaxies and quiescent galaxies can be robustly separated with a two-color criterion over this entire redshift range. We then study the evolution of the number density and mass density of quiescent and star-forming galaxies, extending the results of the COMBO-17, DEEP2, and other surveys to . The mass density of quiescent galaxies with increases by a factor of from to the present day, whereas the mass density in star-forming galaxies is flat or decreases over the same time period. Modest mass growth by a factor of of individual quiescent galaxies can explain roughly half of the strong density evolution at masses , due to the steepness of the exponential tail of the mass function. The rest of the density evolution of massive, quiescent galaxies is likely due to transformation (e.g. quenching) of the massive star-forming population, a conclusion which is consistent with the density evolution we observe for the star-forming galaxies themselves, which is flat or decreasing with cosmic time. Modest mass growth does not explain the evolution of less massive quiescent galaxies (), which show a similarly steep increase in their number densities. The less massive quiescent galaxies are therefore continuously formed by transforming galaxies from the star-forming population.
Subject headings:
galaxies: formation — galaxies: evolution — galaxies: high-redshift1. Introduction
Large surveys, such as the Sloan Digital Sky Survey (SDSS), have begun to sample representative volumes of the nearby Universe. One of the more surprising results from these surveys is the existence of a bimodal galaxy population, manifested in correlations between a wide variety of galaxy properties both observed (i.e., color vs. luminosity, color vs. morphology; Strateva et al., 2001; Blanton et al., 2003; Baldry et al., 2004) and derived (i.e., stellar age and stellar mass; Kauffmann et al., 2003, e.g.). This bimodal population is composed of red, early-type galaxies with old stellar populations and little ongoing star-formation that tend to be the most luminous and massive galaxies at any redshift, and a complementary population of star-forming disk galaxies with bluer colors typical of young stellar populations.
A key question is when this bimodality was established, and what fraction of the total stellar mass is locked up in each of the two galaxy types as a function of cosmic time. In a landmark study, Bell et al. (2004) find that a red sequence was already in place at . The color evolution of the red sequence at is roughly consistent with passive evolution, but analyses of the luminosity function indicate a buildup of a factor of 2 in stellar mass over this redshift range (Bell et al., 2004; Borch et al., 2006; Arnouts et al., 2007; Brown et al., 2007; Faber et al., 2007; Ilbert et al., 2010). The results at are somewhat uncertain because they require large corrections for incompleteness (see Faber et al., 2007). Furthermore, the most massive galaxies do not appear to evolve significantly at (Wake et al., 2006; Brown et al., 2007), implying that they were assembled at higher redshifts.
A number of recent studies have extended this work to . In particular, Arnouts et al. (2007) and Ilbert et al. (2010) find an increase of a factor of 10 in the stellar mass density of quiescent galaxies between and , which would imply very dramatic changes over a relatively short ( Gyr) period. These studies are not definitive, as they depend on relatively uncertain photometric redshifts at determined from broad-band NIR photometry. Taylor et al. (2009b) show that large redshift uncertainties make the robust identification of a bimodal galaxy population extremely difficult at . Unfortunately, spectroscopic verification of these results is extremely difficult due to the faintness of massive galaxies in the observer’s optical (see, e.g., Kriek et al., 2008).
Here we examine the evolution of the bimodal galaxy population with the NEWFIRM Medium-Band Survey (NMBS), a moderately deep, moderately wide near-IR survey which uses a novel set of medium-bandwidth filters specifically tuned to the redshift range (van Dokkum et al., 2009; Whitaker et al., 2010). In Brammer et al. (2009), we used the NMBS to show that massive galaxies are nearly all red up to but that a bimodal population is apparent after correcting the colors of galaxies heavily reddened by dust. Whitaker et al. (2010) find that not only can quiescent galaxies be identified in the NMBS up to , but their color scatter within the red sequence is resolved. They find that the fraction of quiescent galaxies among all galaxies at decreases sharply from roughly 90% at to 40% at . Furthermore, Marchesini et al. (2010) find evidence that the quiescent fraction of extremely massive galaxies () decreases further still to 7–30% by .
In this paper, we use the NMBS to study the buildup of star-forming and quiescent galaxies from to the present by constructing their mass functions and quantifying the evolution of their number and mass densities. In §2 we describe the survey data and sample selection. We show the galaxy rest-frame color distribution and its evolution in §3, and describe a method of cleanly separating the red, “quiescent” galaxy sequence from intrinsically blue, star-forming galaxies by accounting for the effects of dust reddening. We present stellar mass functions in §4. We study the evolution of the galaxy number and mass densities in §5, and we discuss our results in the context of massive galaxy formation in §6. We summarize our results in §7. We assume a CDM cosmology throughout, with , , and . All magnitudes and colors are given in the AB system.
2. Data
2.1. The NEWFIRM Medium-Band Survey
The NEWFIRM Medium-Band Survey (NMBS; van Dokkum et al., 2009; Whitaker et al., 2011) provides well-sampled galaxy spectral energy distributions (SEDs) from rest-frame UV through NIR wavelengths up to , thanks in part to a custom set of five medium-band NIR filters that span observed wavelengths 1–1.7 at roughly twice the spectral resolution of standard broad-band filters. The medium-band filter technique has been successfully employed at optical wavelengths to measure very precise photometric redshifts at (COMBO-17, Wolf et al., 2003; COSMOS, Ilbert et al., 2009; E-CDFS, Cardamone et al., 2010). The ability of medium-band filters to constrain photometric redshifts depends on their sampling strong, broad spectral features, and in particular the Balmer/4000 Å break, which is redshifted to at . The NMBS filters are designed to enable precise photometric redshift estimates at by improved sampling of the Balmer/4000 Å break at these redshifts. We briefly summarize the NMBS below; a full description of the data reduction and photometric catalogs is provided by Whitaker et al. (2011).
The NMBS provides medium-band near-IR photometry over 0.25 deg2 NEWFIRM (Probst et al., 2004) pointings in each of two well-studied survey fields, COSMOS (Scoville et al., 2007) and the All-wavelength Extended Groth Strip International Survey (AEGIS)111http://aegis.ucolick.org/. The NEWFIRM data were taken over 75 nights in 2008–9 at the Mayall/4m telescope at the Kitt Peak National Observatory. The NEWFIRM , , and data are supplemented at optimal wavelengths by deep imaging in both fields from the CFHT Legacy Survey222http://cfht.hawaii.edu/Science/CFHTLS, as reduced by the CARS team (Erben et al., 2009; Hildebrandt et al., 2009). Furthermore, we include deep Subaru imaging in broad-band and in 12 medium-band filters that span 4000–8000 Å (Capak et al., 2007; Ilbert et al., 2009). At mid-IR wavelengths, we include Spitzer-IRAC 3–8 and MIPS 24 imaging that cover the entire COSMOS pointing (S-COSMOS; Sanders et al., 2007) and 60% of the AEGIS pointing (Barmby et al., 2008). After masking regions with less than 30% of the maximum exposure time in the NMBS bands and regions around bright stars, the NMBS covers 0.20 deg2 and 0.19 deg2 in COSMOS and AEGIS, respectively.
Objects are detected in the NEWFIRM image, and the optical/NIR photometry is performed on images convolved to the same point-spread function (PSF) to limit band-dependent effects (Whitaker et al., 2011; see Quadri et al. 2007 for a similar photometric strategy). Objects are detected at 5, and the corresponding depths in the medium-bands are approximately flat as a function of . The CFHT and Subaru broad-band optical images are among the deepest available in any field, which is especially important for producing high-S/N SEDs of optically-faint, red galaxies at . The large-PSF IRAC and MIPS images require advanced photometric techniques to minimize photometric contamination by neighboring objects. We employ a source-fitting method that uses the higher-resolution -band image to model the positions and sizes of objects in the redder Spitzer bands, whose flux normalizations are fit by least-squares regression. Fluxes and errors are then measured for each object with simple aperture photometry after subtracting the model of all neighboring objects (Labbé et al., 2006; see Wuyts et al., 2007 for an illustrative example). The IRAC images are significantly deeper than the NEWFIRM -band. The MIPS 24 images reach 20 at .
The primary sample used throughout this paper is defined as all galaxies in the Whitaker et al. (2011) catalog (version 5.0) of the two NMBS fields with , , and the standard quality cuts, which yields 25,423 galaxies (15,485 with MIPS coverage).
2.2. Photometric Redshifts
We estimate photometric redshifts from the SEDs using the Eazy photometric redshift code (Brammer et al., 2008). We use the default Eazy template set described by Brammer et al. (2008) with a modified treatment of emission lines inspired by Ilbert et al. (2009); rather than using the emission lines as predicted by the Pégase population synthesis code (Fioc & Rocca-Volmerange, 1997), we compute a “star-formation rate” (SFR) from the rest-frame 2800 Å flux of each template and then add , Lyman-, O II and O III emission lines using fixed line ratios (Ilbert et al., 2009; after Kennicutt, 1998). Although this treatment of emission lines is still over-simplified—real galaxies will have a non-trivial range of SFRs, line strengths and line ratios for a given 2800 Å flux—we find that it significantly improves the photometric redshift quality of the medium-band SEDs, which are more sensitive to line contamination than broad-band SEDs (see also Ilbert et al. 2009 and Appendix A below).
To further improve the photometric redshifts, we iteratively adjust the photometric zeropoints of the ground-based photometric bands to minimize the residuals to template fits at fixed redshift for objects with spectroscopic redshifts (see below). With the exception of CFHT-, which appears to be 0.2 mag “too faint” (Erben et al. 2009 note a similar discrepancy), the adjustments to the CFHT/NEWFIRM zeropoints are 2%, well within typical 0.05 mag zeropoint calibration uncertainties. The Subaru broad- and medium-band images require significantly larger corrections to their publicly-listed zeropoints of up to 0.2 mag (see also Table 1 of Ilbert et al., 2009). These offsets are constrained by the well-calibrated, overlapping CFHT photometry, and we find that the photometric redshift quality is improved significantly when including all of the available optical data.
Two large spectroscopic surveys, DEEP2 (Davis et al., 2003) and COSMOS (Lilly et al., 2007), provide a large number of spectroscopic redshift measurements that can help us assess the quality of our photometric redshift estimates. For 2067 objects from our sample that have DEEP2 redshifts, we measure a NMAD (see Brammer et al., 2008) scatter . In the COSMOS field, where objects have 35-band SEDs that include medium bands from 4000 Å–1.7, the NMAD scatter is for 1099 galaxies with COSMOS redshifts.333We use only the most reliable spectroscopic redshift quality flags from DEEP2 () and COSMOS (). The number of catastrophic redshift failures with is 2.6% (1.6%) in AEGIS (COSMOS). These results are among the best that have been achieved for photometric surveys, and we note that Eazy has been shown to produce redshift estimates with the lowest scatter and the smallest fraction of outliers of any of the public photometric redshift codes (Hildebrandt, 2010).
We caution that the subset of objects with spectroscopic redshifts tend to be optically-bright (e.g., for COSMOS) and almost all are at ; the spectroscopic sample is not representative of the full -selected sample used throughout this paper. van Dokkum et al. (2009) targeted four galaxies in the Kriek et al. (2008) GNIRS spectroscopic sample to test the NEWFIRM medium-band technique on -selected galaxies at , and they find for all four objects. Furthermore, Kriek et al. (2011) have shown recently that H emission can be detected in composite SEDs built from the medium-band photometry itself, and they conclude that the photometric redshift errors must be given the shape of the observed emission line. While small spectroscopic samples suggest the potential of the NMBS medium-band filters for providing accurate photometric redshifts at , further spectroscopic followup is required to fully assess the redshift quality at the redshift and magnitude limits of the survey.
2.3. Rest-frame colors
We derive rest-frame and colors444We adopt the and filter definitions of Maíz Apellániz (2006), and 2MASS- from the template that best fits the observed photometry, which itself is a linear combination of the Eazy templates. We take the rest-frame color from the template directly, similar to the technique described by Wolf et al. (2003) for the COMBO-17 survey.555Eazy2.0 with the updated templates and the rest-frame color implementation is made available at http://www.astro.yale.edu/eazy/. Other methods have been developed to measure rest-frame fluxes by interpolating between the observed bands that bracket the rest-frame band at a given redshift, with the potential advantage that the resulting rest-frame fluxes are determined more directly from the observed photometry rather than depending on the choice of fitting templates (e.g., the algorithm of Rudnick et al., 2003, implemented in the InterRest program by Taylor et al., 2009b). For a sufficiently flexible set of templates (e.g., arbitrary linear combinations of the Eazy templates), these two methods produce very similar results for photometric surveys with mostly non-overlapping, broad-band filters. As the filters become more closely-spaced, direct template fluxes are more robust as they are able to make use of more of the observed photometry. That is, at a particular redshift the interpolation method may interpolate between two adjacent filters that have relatively low S/N, while the SED shape at the desired wavelength is actually well-constrained by additional nearby filters. We adopt the direct template colors throughout, but note that our results are qualitatively consistent for both our template-fitting and the Taylor et al. (2009b) methods.
2.4. and star formation rates
We use the rest-frame color routine described above to derive luminosities at 2800 Å, which we combine with the MIPS 24 photometry to estimate star formation rates, (Bell et al., 2005; adapted for the Kroupa IMF by Franx et al., 2008). The MIPS 24 fluxes are converted to total IR luminosities () using the Dale & Helou (2002) templates, where we adopt the log average conversion for templates with (see Wuyts et al., 2008). This conversion has a systematic uncertainty of a factor of 3 (Wuyts et al., 2008). Papovich et al. (2007) and Muzzin et al. (2010) (among others) show that the commonly-used alternative method of fitting the luminosity-dependent Chary & Elbaz (2001) templates tends to overestimate at by factors of 5.
2.5. SED modeling: stellar masses,
We measure stellar masses and dust reddening of the NMBS galaxies by fitting a grid of population synthesis models to the NMBS SEDs using the fast code (Kriek et al., 2009). The model grid is composed of Bruzual & Charlot (2003) models with exponentially-declining star formation histories (SFHs) with decline rates , computed with a Kroupa (2001) initial mass function (IMF). To first order, alternative choices of the IMF (e.g. Salpeter, 1955) cause a shift in the derived stellar masses without affecting other properties of the fit (e.g., ; Marchesini et al., 2009). Note that adopting alternative star-formation histories, such as a SFH that increases with time (Maraston et al., 2010; Papovich et al., 2011), could also affect the derived stellar masses by significant factors, perhaps as large as a factor of two. We estimate the amount of dust reddening from the SED fit by allowing a uniform dust screen with up to four magnitudes of extinction in the -band () and with a wavelength dependence following the Calzetti et al. (2000) reddening law. Using a similar SED-fitting technique with photometric redshifts and broad-band photometry, Muzzin et al. (2009) demonstrate that stellar masses can be determined with precision 0.1 dex. Marchesini et al. (2009) show, however, that changing the modeling assumptions such as the modeling library or the IMF can cause systematic differences in the derived stellar masses that are larger than these random errors. For example, stellar masses estimated with Maraston (2005) models tend to be systematically lower than those determined from Bruzual & Charlot (2003) models by a factor of 1.4 (Wuyts et al., 2007; Whitaker et al., 2010). We use the Bruzual & Charlot (2003) models as they appear to better describe the SEDs of young quiescent galaxies than the Maraston (2005) models (Conroy et al., 2009; Kriek et al., 2010).
3. The bimodal galaxy population
3.1. Color-mass relations and completeness
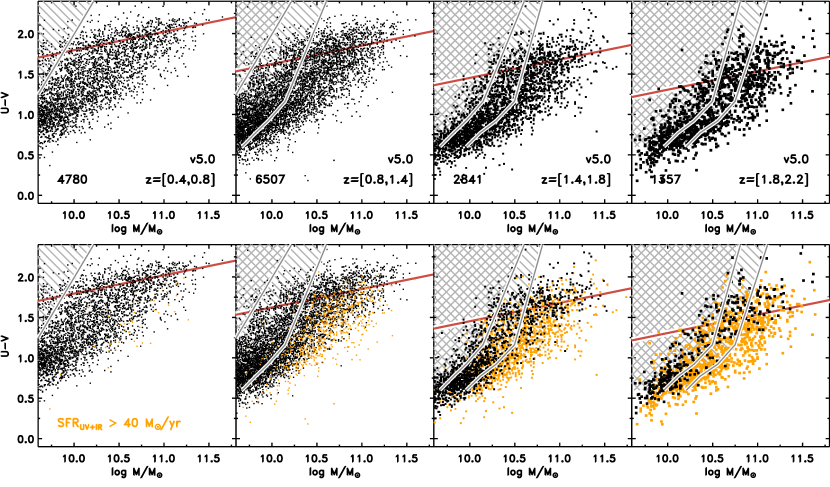
We first analyze simple color-mass relations as a function of redshift. As we show below, the use of a single color to identify different galaxy populations is sufficient at low redshift but is not very meaningful at redshifts . The color-mass relations in four redshift bins are shown in Fig. 1. The redshift bins are chosen such that they sample similar comoving volumes, with the exception of the lowest-redshift bin that encompasses a volume only 40% of the other bins.
Areas of the color-mass diagram where the sample is incomplete are shaded on Fig. 1. Selection in the -band is closer to a stellar mass selection than an optical selection is (e.g., Franx et al., 2008); nevertheless, a fixed -band flux limit will result in a mass completeness limit that varies as a function of redshift and color (Taylor et al., 2009a; Marchesini et al., 2009). The completeness limits were estimated from the NMBS sample itself combined with the deeper FIREWORKS catalog of the CDFS (Wuyts et al., 2008) following the method described by Taylor et al. (2009a) and Marchesini et al. (2009). At we are complete for all galaxies with at . The completeness limit extends to for blue galaxies with lower ratios. We avoid uncertain completeness corrections below by only considering stellar mass ranges above the completeness threshold at a given redshift.
The top panels of Fig. 1 highlight a key aspect of massive galaxies at high redshift, which has earlier been highlighted by others (e.g., Papovich et al., 2006; Brammer et al., 2009; Whitaker et al., 2010): nearly all galaxies with have red colors at . However, this does not imply that all these galaxies are quiescent with low star formation rates. In the bottom panels of Fig. 1 galaxies with are shown in orange. This star formation rate limit corresponds to the minimum SFR observable at given the MIPS flux limit of . A significant fraction of red galaxies with are vigorously forming stars at , with the fraction increasing with redshift and reaching 50% by (Whitaker et al., 2010). This is qualitatively consistent with the observed increase in the number of IR-luminous galaxies with redshift (Le Floc’h et al., 2005, 2009). In the low- bin, galaxies on the massive red sequence have much lower star formation rates, which is consistent with many other studies that have found that red galaxies at tend to be old, passively-evolving, early-type systems (e.g. Strateva et al., 2001; Blanton et al., 2003; Kauffmann et al., 2003; Bell et al., 2004).
3.2. Separating quiescent and star-forming galaxies
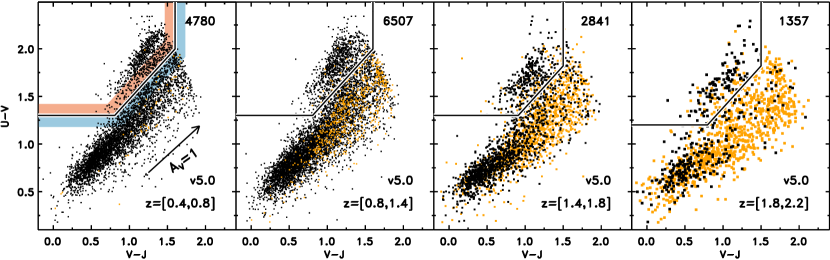
Given that red galaxies at comprise both quiescent galaxies and dusty star-forming galaxies, a single rest-frame color criterion is not the most informative way to identify different galaxy populations. Recent studies of the local universe and of galaxies up to have shown that the galaxy color bimodality is more clearly seen after accounting for dust reddening (Wyder et al., 2007; Cowie & Barger, 2008; Maller et al., 2009), which Brammer et al. (2009) extend to using the NMBS. Quiescent galaxies follow a red sequence at least up to (Brammer et al., 2009; Whitaker et al., 2010), while star-forming galaxies follow a sequence where the colors become redder with increasing mass, with the color primarily determined by increasing dust reddening with mass (Labbé et al., 2007; Brammer et al., 2009).
Labbé et al. (2005) show that it is possible to separate quiescent from dusty galaxies with similarly red colors using the combination of two rest-frame colors, and (see also Wuyts et al., 2007; Williams et al., 2009). The SEDS of quiescent galaxies are red in but blue beyond the Balmer/4000 Å break, while dust-reddened galaxies are red in both colors. We choose here to use this two-color “” selection technique because it is independent of differences between population synthesis models, while the dust-corrected selection used by Brammer et al. (2009) depends on accurately measuring from the SED fit. Whitaker et al. (2010) compare the and dust-corrected color selection methods and find that the fraction of red/quiescent galaxies with differs by less than 5% between them.
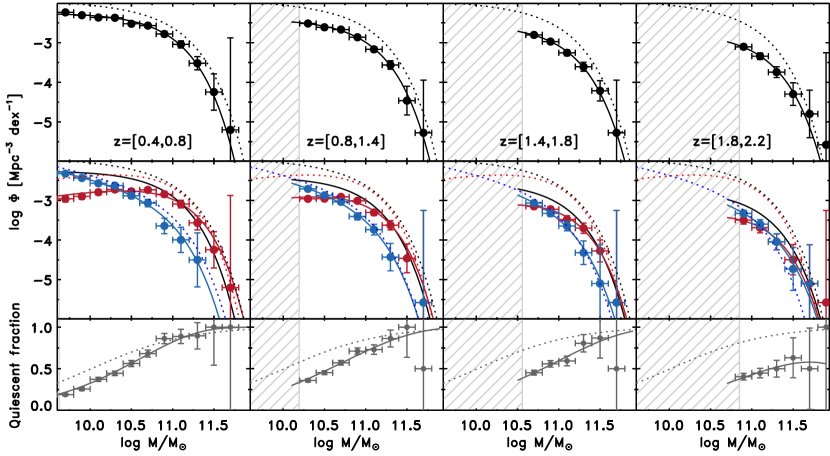
Figure 2 shows the and colors of galaxies in the NMBS at . The two-color distribution is bimodal up to (see also Williams et al., 2009; Ilbert et al., 2010), and we adopt the Williams et al. (2009) selection criteria (solid line) to separate quiescent galaxies and star-forming galaxies. Galaxies with are again shown with orange symbols in Fig. 2. While this SFR limit, set by the depth of the observations, is insufficient for firmly establishing a galaxy to be “quiescent”, the clear separation in the diagram supports the idea that the quiescent red galaxies form a population distinct from the dusty, star-forming galaxies, particularly at . We note here that the existence of massive galaxies with very little ongoing star-formation at is supported by near-IR spectroscopic studies (Kriek et al., 2006).
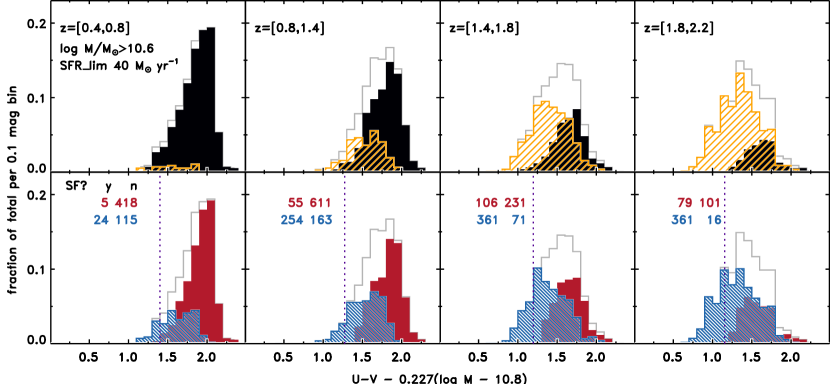
It is clear that red (quiescent) and blue (star-forming) samples selected using the colors will be different from those based on a single rest-frame color, as was done by, e.g., Bell et al. (2004) and Borch et al. (2006). This is shown qualitatively in Fig. 3, which shows histograms of color corrected for the slope of the color-magnitude relation. The top panels show the color distribution split according to the SFR threshold used in Fig. 1, while the bottom panels show the distribution split according to the quiescent/star-forming selection. Although the distribution of colors changes only slightly with redshift, the distribution of star-forming versus quiescent galaxies changes rapidly with redshift. Hereafter, we discuss the two distinct populations apparent in the diagram as “quiescent” and “star-forming” samples. We cannot exclude some on-going star formation in the quiescent galaxies (particularly if it is completely obscured), but their rest-frame optical SEDs are dominated by an evolved stellar population.
It is worth commenting here on other recent studies of the evolution of the red sequence to . A number of studies have found little or no evidence for a significant number of red, quiescent galaxies at (Arnouts et al., 2007; Cirasuolo et al., 2007). Like the NMBS, these studies rely on photometric redshifts, but they have relatively poor sampling of observed NIR wavelengths with only the and broad-band filters. This will result in large redshift uncertainties at (Brammer et al., 2008), and therefore derived rest-frame colors will have insufficient precision to identify the distinct red/blue populations at those redshifts (Taylor et al., 2009a). Though sample sizes are small, spectroscopic studies have unambiguously identified quiescent galaxies at (Cassata et al., 2008; Kriek et al., 2008), emphasizing the need for precise redshift measurements. Furthermore, the definition of “quiescence” varies from one study to another. Arnouts et al. (2007) define galaxies to be quiescent when they are best-fit by a non-evolving (local) elliptical galaxy template. As can be seen in Fig. 1, passive evolution ensures that quiescent galaxies at cannot have the colors of local elliptical galaxies, and thus such a selection will fail to identify this population.
4. Stellar mass functions
Having robustly divided the sample in quiescent and star-forming galaxies, we now study the evolution of the stellar mass function split by galaxy type. We first show the evolution of all galaxies, in the top panels of Fig. 4 (see also, e.g., Fontana et al., 2006; Marchesini et al., 2009; Pozzetti et al., 2010). These mass functions are computed by simply counting galaxies in stellar mass and redshift bins. We do not adopt the formalism (Avni & Bahcall, 1980) as we only consider stellar masses where the NMBS is complete. We fit Schechter (1976) functions with fixed faint-end slope to the densities in each redshift bin to demonstrate only that the mass functions have reasonable shapes. Our stellar mass completeness limits do not allow us to constrain the faint-end slope at , and strong degeneracies between the Schechter parameters (e.g. Marchesini et al., 2009) would make the parameter values and their evolution with redshift difficult to interpret given the simple analysis used here. We defer a more detailed analysis of the NMBS stellar mass functions, including a full accounting of systematic errors and incompleteness, to a future paper.
We include in Fig. 4 the mass function from Bell et al. (2003) for comparison, which we have scaled to our assumed cosmology. Additionally, we scale the Bell et al. (2003) stellar masses down by a factor of 1.2 to account for the difference between a “diet-Salpeter” IMF and the Kroupa (2001) IMF we use to estimate stellar masses. It is apparent from the total mass functions that the mass function evolves gradually from to , with no indications for sudden or dramatic changes in particular redshift ranges.
The mass functions are split into quiescent and star-forming galaxies in the middle panels of Fig. 4. The dotted lines indicate the Bell et al. (2003) local mass functions of early- and late-type populations separated by color. It is clear that the mass functions of the quiescent and star-forming samples evolve in significantly different ways. Massive galaxies () at are almost entirely in the quiescent population. The number of massive quiescent galaxies decreases steadily with increasing redshift, while the mass function of the star-forming sample evolves very little up to for . The differential evolution is such that the two populations are approximately equal in number at for these galaxies with (Fig. 4, bottom panels). Thus we observe in the galaxy population directly the argument made by Bell et al. (2007), who noted that the IR-luminous (massive) starburst galaxies observed at must later migrate to the red sequence to avoid dramatically over-predicting the number of massive, blue galaxies observed locally. Furthermore, we demonstrate here that the evolution of the total galaxy population is mostly due to the evolution of the quiescent galaxies: the star-forming population is similar at all redshifts, and it is the rise of quiescent population with cosmic time that is responsible for the gradual evolution of the total mass function.
The shape of the quiescent mass function may also evolve with redshift, although we are severely hampered by incompleteness at low masses and high redshifts. Taking the data at face value, we find that massive quiescent galaxies above evolve more slowly than those at lower masses, but deeper data at the low mass end and spectroscopic redshifts at the high mass end are needed to confirm this. We note that this evolution would be qualitatively consistent with the recent () build-up of low-mass red galaxies found by Rudnick et al. (2009), both in cluster and field populations.
5. Number and mass density evolution
5.1. Full galaxy sample
To further quantify the evolution of star-forming and quiescent galaxies, we now consider the evolution of their number and mass densities with redshift. We measure these quantities directly from the data by simply counting objects above the mass completeness threshold in a given redshift bin, so we do not rely on the assumption that the mass functions follow a Schechter function. Again, the NMBS does not constrain the faint-end of the mass function at , so integrating the mass functions to zero mass would result in an unreliable extrapolation of the observed data.
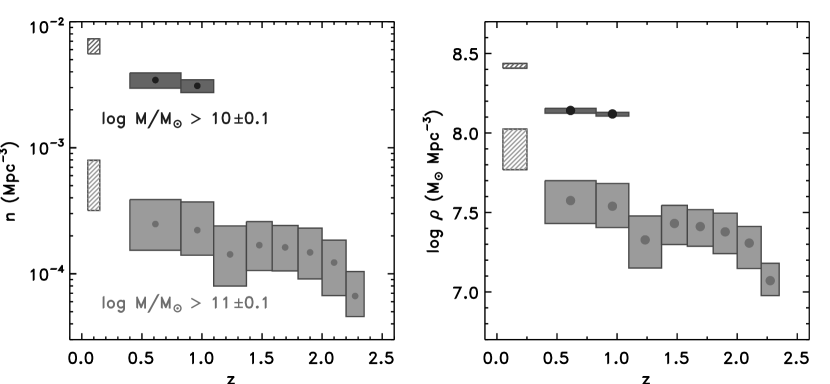
The number and mass density evolution in two mass ranges is shown in Fig. 5. The redshift bins used are those from Figs. 1–4 divided in two; the bins are still somewhat larger than the expected photometric redshift uncertainties even at (§2.2). Only redshift bins where the survey is complete to the specified mass limits are shown. The uncertainties on the number densities are a combination of Poisson errors and the cosmic variance estimated using the Somerville et al. (2004) prescription, given the observed number density, redshift binning, and survey geometry. We can obtain a rough estimate of the cosmic variance directly from the NMBS itself: the number and mass densities for the individual COSMOS and AEGIS fields are shown as the dotted and dash-dotted lines, respectively. The differences between the two fields are significant and are generally well-represented by the error estimates that account for cosmic variance.
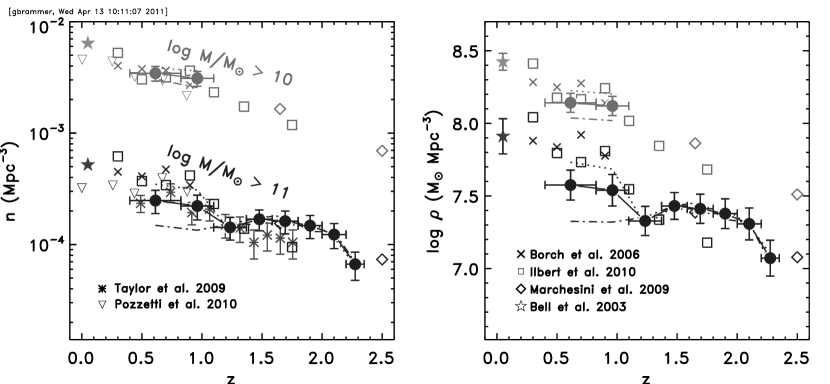
The inclusion of the local density measurement is important for evaluating the overall evolution, and here we include densities integrated from the Bell et al. (2003) mass function. While the methodology we use to estimate stellar masses and separate quiescent from star-forming galaxies is quite different than that used by Bell et al. (2003), the local reference point appears to connect well with our NMBS measurements in Fig. 5. Similar to other studies, we find that there is modest mass density evolution (0.25 dex) up to for masses . Up to , we observe an overall decrease in the mass density of 0.6 dex at . We do not find a sudden change at ; the evolution appears to be gradual over the entire redshift range . We note that the results here are consistent with those of Marchesini et al. (2009), who find very little evolution at extreme masses (Figure 4).
Differences between the two NMBS fields highlight the importance of sampling large volumes: the COSMOS field shows an overall mass density decrease of 0.6 dex between , while densities measured in the AEGIS field are essentially consistent with no evolution over this same redshift range. Furthermore, we note that our results are sensitive to subtle redshift-dependent systematic errors in the masses, including systematic differences between the point and the higher redshift data. This is demonstrated explicitly in Fig. 10 in the Appendix.
5.2. The number and mass densities of quiescent and star-forming galaxies
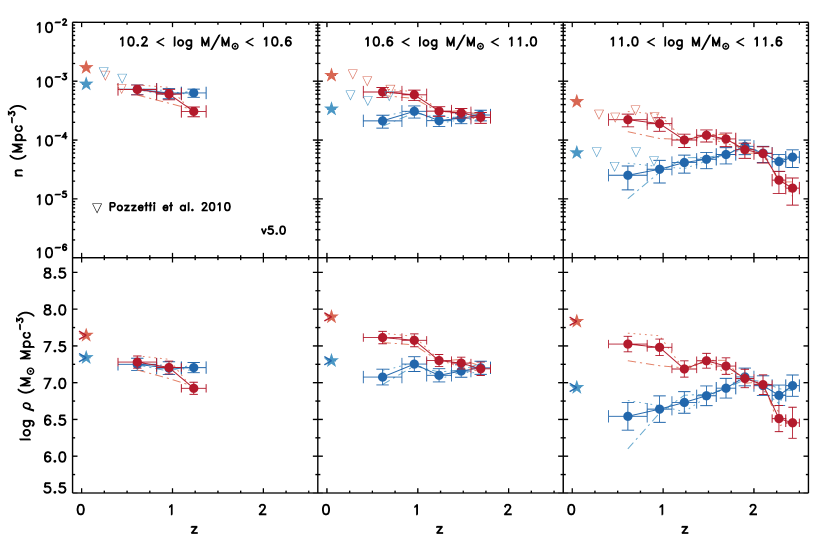
We examine the number and mass density evolution of the quiescent and star-forming samples (§3.2) in Fig. 6. Rather than integrating down to a mass limit as in Fig. 5, we now consider three separate stellar mass bins where the NMBS is complete to at least . While this is essentially the same measurement as the stellar mass functions described above, plotting the densities allows the trends with redshift and mass to be more readily apparent.
It is immediately clear again that the quiescent and star-forming galaxy populations evolve in very different ways. The number and mass densities of star-forming galaxies remain nearly constant with redshift for all masses . Star-forming galaxies with , which are relatively rare at low redshift, are more prominent at where they have the same number and mass densities as the massive quiescent population. We again take the local comparison from Bell et al. (2003), who provide stellar mass functions divided into early- and late-type populations by color. The local comparison is important for showing the overall redshift evolution, particularly at low masses where our data indicate rapid growth of the quiescent population since . Whether or not the local comparison is considered, the density evolution of star-forming galaxies is in stark contrast with that of quiescent galaxies, whose density decrease with redshift at all of the masses considered. The evolution of the mass density of the quiescent galaxies as a function of redshift is to first order independent of mass for , with about 0.5 dex of mass density growth per unit redshift for all of the mass ranges shown. Because three times as much time elapses between and the present day as between and , the massive red sequence grows rapidly between and , at which point the growth slows considerably over the remaining 8 Gyr until the present day (see also Kriek et al., 2008).
The differential density evolution between the quiescent and star-forming populations shown in Fig. 6 provides another manifestation of the “downsizing” phenomenon, in which the characteristic sites of star-formation shift to lower mass galaxies at later times (Cowie et al., 1996, followed by e.g., Bell et al., 2005; Juneau et al., 2005; Bundy et al., 2006 and many others). Here we see that the number and mass densities of quiescent and star-forming galaxies are equal at earlier times for increasing galaxy stellar mass, after which the densities are dominated by the quiescent population. This is effectively a reformulation of taking the stellar mass at which the mass functions cross to be the characteristic mass of transforming galaxies from the star-forming to quiescent population (Bundy et al., 2006). Indeed, we see a similar trend in the NMBS stellar mass functions in Fig. 4: the quiescent and star-forming stellar mass functions cross at stellar masses that increase with redshift.
6. Discussion: The build-up of quiescent galaxies
The trends for star-forming and quiescent galaxies are contrary to naive expectations. One would naively expect that the stellar mass density of star-forming galaxies increases with time, as they are forming new stars. Quiescent galaxies have already stopped forming stars, and one might expect their mass density to remain constant. However, we observe the opposite. Consistent with previous studies at lower redshift (Borch et al., 2006; Bell et al., 2007; Martin et al., 2007), we find that the mass density of the star-forming population shows very little evolution up to for galaxies with . At the same time, the mass density in quiescent galaxies increases with time. The obvious interpretation is that galaxies migrate from the star-forming population to the quiescent population (see also, e.g., Bell et al., 2007; Faber et al., 2007). Furthermore, the mass density of the massive quiescent population above might grow through mergers with less massive galaxies (e.g., van Dokkum, 2005).
6.1. Mass evolution at fixed cumulative number density
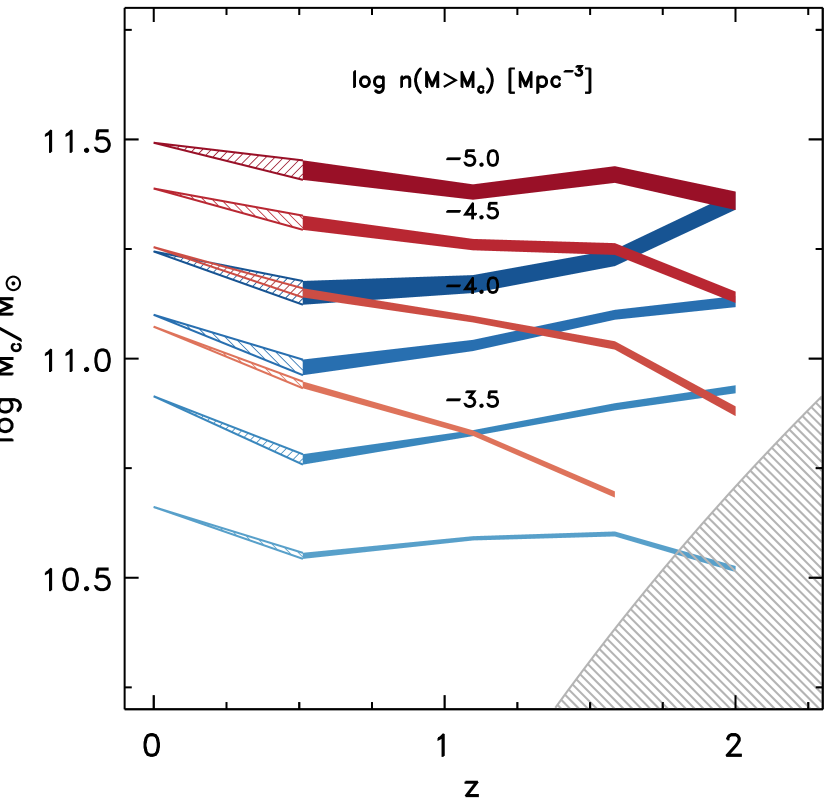
To explore the causes of the rise of quiescent galaxies we first ask how much the masses of individual galaxies grow with time. As shown by van Dokkum et al. (2010), selecting galaxies at a constant number density rather than a constant mass enables the study of the evolution with time of a single coherent population of galaxies at the massive, exponential end of the mass function, as both star formation and any merger with a ratio somewhat less than than 1:1 will increase these galaxies’ masses without changing their number density. van Dokkum et al. (2010) find that galaxies with a number density grow in mass by a factor of two since (with at ).
We modify the van Dokkum et al. (2010) selection slightly and consider a selection based on a constant cumulative number density, defining to be the stellar mass at constant . This definition has the advantage that it is single-valued even at low-masses. Starting with a baseline mass function with at time , the value of can increase after time (i.e., ) as a result of three physical process that all may occur simultaneously: growth from mergers where the secondary objects have or both progenitors have , star formation, and creation of new galaxies in the considered sample via transformation of galaxies (with ) from a different population. In the first two of these processes, an increase in is directly related to the average increase in mass in individual galaxies above that threshold, given the simplifying assumption that all galaxies above the threshold evolve in a uniform way. If two galaxies each with merge within time, , then , as one would have to move further down the mass function to count the same number of galaxies in the same volume. Such mergers with both progenitors with would necessarily have mass ratios of nearly 1:1 for due to the steepness of the mass function. Finally, mass loss in galaxies above after some time, , will result in .
We show the evolution of for the quiescent and star-forming galaxy populations in Fig. 7, for a range of . We find that the stellar mass of quiescent galaxies with at increases by a factor of 2 by , similar to the van Dokkum et al. (2010) value for the full sample not divided by color. Interestingly, the growth of at the highest masses slows with time, perhaps suggesting an increased prevalence of dry, equal-mass mergers at these masses since . The value of for the star-forming galaxies is nearly constant with redshift for all densities considered, which is likely the result of tension between competing and opposite effects: star-formation within the population and migration out of the star-forming and into the quiescent population.
6.2. Mergers versus truncation of star formation
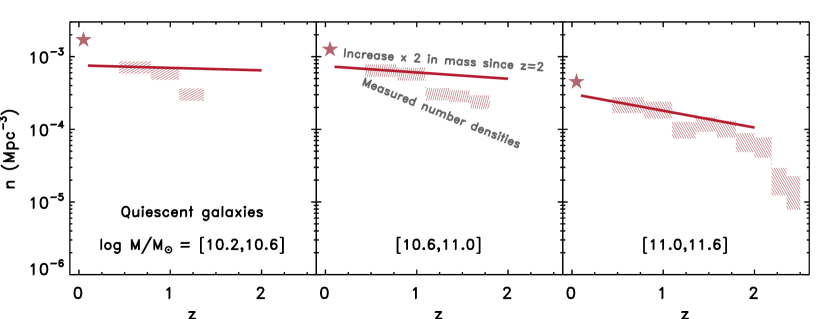
We now construct a very simple empirical calculation to test the hypothesis that the observed number density evolution of quiescent galaxies is a result of growing the stellar mass of individual galaxies by the factor of two measured from Fig. 7. For the quiescent population, this growth should be dominated by minor mergers since 1) these galaxies are not forming stars at a high rate and 2) equal mass mergers are rare, at least at the massive end, because the galaxies themselves are relatively rare (see also van Dokkum et al., 2010). The shape of the mass function ensures that there is a large number of low-mass merger progenitors. Taking the Marchesini et al. (2009) function, we measure the change in number density in each mass bin that results from increasing all masses by a factor of two. This is essentially taking the derivative of the mass function at the indicated mass bins. Thus, the number density evolution for a given increase in stellar mass is greatest in the mass bin where the mass function is steepest.
The density evolution that is implied by this calculation is shown in Fig. 8, where we normalized the evolution the density observed in the NMBS at . The modest assumed growth of stellar mass in individual galaxies results in a factor of 3 growth in the number density since for the massive bin. This simple model can explain at least 50% of the observed density growth in the massive bin, suggesting that the growth in the number and mass densities of these galaxies is dominated by (minor) mergers (see also Hopkins et al., 2010; van Dokkum et al., 2010). The remaining density growth of massive quiescent galaxies can likely be explained by transforming galaxies from the dusty star-forming population, which is indeed required to avoid overproducing massive star-forming galaxies, as in Fig. 4
By contrast, growing the stellar masses of individual quiescent galaxies by a factor of two can only account for 10–15% of their observed number density evolution at lower masses. If this modest mass growth within the less massive quiescent population (e.g. due to red mergers) is insufficient to explain the rapid increase of their number and mass densities, transformation of galaxies from the star-forming to quiescent populations is likely the dominant mechanism necessary to make up the difference. This conclusion is further supported by the lack of evolution of the number/mass densities and for the star-forming population as seen in Figs. 6 and 7, respectively.
6.3. Consequences of the massive, dusty galaxy population at
The process by which galaxies transform from the star-forming sequence to the quiescent sequence is unknown, but at moderate and high stellar masses it can not be a simple fading of blue, dust-free star forming galaxies to red, dust-free quiescent galaxies. As noted earlier, the bimodal galaxy population at is not immediately apparent in the color-mass diagram because the star-forming and quiescent galaxies have essentially identical red colors (Fig. 1). The former, we have argued, are heavily reddened by dust. At no point for do we see a significant population of massive, star-forming galaxies with un-reddened blue colors. This lack of observed blue galaxies indicates that the dusty nature of the massive star-forming galaxies we observe at is not likely to be a simple effect of the dust geometry—for example that highly-inclined (blue) disks would have reddened colors that would put them on the red sequence (e.g. Bailin & Harris, 2008; Maller et al., 2009)—because the random orientation of objects would show a range of obscuration at constant stellar mass broader than that observed.
As a result, massive galaxies must leave the star-forming sequence and eventually arrive on the quiescent sequence at essentially the same color. Although local early-type galaxies are frequently observed to contain modest amounts of dust (Kormendy & Djorgovski, 1989), the dust does not appear to affect the overall optical colors of nearby red-sequence galaxies to the dramatic extent that we find in the optical-NIR SEDs of massive star-forming galaxies at (see also Whitaker et al., 2010). Therefore, dust must be destroyed or the dust geometry needs to change during the process of of transforming galaxies from the dusty star-forming sequence to the quiescent red sequence. As these processes probably operate on timescales similar to or longer than the timescale of star formation quenching, one might expect an increase in the amount of dust in the quiescent population with redshift. Marchesini et al. (2010) do find that extremely massive galaxies at in the NMBS have fairly strong Balmer/4000 Å breaks and also mag of dust extinction, measured with the same techniques described in §2.5. Future work combining medium-band surveys such as the NMBS with new far-IR capabilities to better characterize emission from the dust itself (e.g. Elbaz et al., 2010), will help to further test this prediction of moderate dust in quiescent galaxies at .
7. Summary
We use the unique photometric dataset provided by the NEWFIRM Medium-Band Survey to study the color and stellar mass distributions of galaxies up to . The NMBS provides the best-sampled SEDs and most precise photometric redshift estimates at available to date, which greatly improves the quality of rest-frame properties (colors, masses, stellar population parameters) derived from the photometry. We find that nearly all galaxies with have red rest-frame colors up to . Using a two-color method, supported by MIPS 24 photometry, we identify a bimodal galaxy population consisting of a quiescent sequence with relatively low star-formation rates and a distinct star-forming sequence that becomes increasingly dusty with increasing stellar mass.
Separating the evolution of the mass function by star formation rate, we find that it is driven by the rise of quiescent galaxies from to . The mass function of star-forming galaxies is remarkably similar at all redshifts, whereas the quiescent galaxies show strong, mass-dependent, evolution (see also Marchesini et al., 2009; Drory et al., 2009). Quantifying this evolution, we find that number and stellar mass densities of all galaxies with evolve by 0.5 dex per unit redshift. Considering the density evolution of star-forming and quiescent galaxies separately, we find that the density of star-forming galaxies is nearly flat out to , and the density of quiescent galaxies decreases by a factor of from to . Interestingly, at the mass and number densities of the quiescent and star-forming populations with are nearly identical. This crossing point of the densities occurs at progressively later times at lower stellar masses.
Using an empirical argument based on selecting subsamples based on their cumulative number density, we show that the average mass in individual quiescent galaxies grows by a factor of 2 from to . If we assume that most of this mass growth is due to mergers, we find that a simple calculation based on the shape of the mass function is able to explain much (at least 50%) of the number density evolution of galaxies with . This model is unable to account for the density evolution of less massive quiescent galaxies, which we argue are formed primarily via transformations from the star-forming population. In general, our results bring together a large variety of results from the literature—based on disparate samples selected at different wavelengths and redshifts—into a coherent picture extended up to , thus demonstrating the utility of large, uniformly-selected surveys for the study of galaxy formation and evolution.
References
- Arnouts et al. (2007) Arnouts, S., Walcher, C. J., Le Fèvre, O., et al. 2007, A&A, 476, 137
- Avni & Bahcall (1980) Avni, Y., & Bahcall, J. N. 1980, ApJ, 235, 694
- Bailin & Harris (2008) Bailin, J., & Harris, W. E. 2008, ApJ, 681, 225
- Baldry et al. (2004) Baldry, I. K., Glazebrook, K., Brinkmann, J., et al. 2004, ApJ, 600, 681
- Barmby et al. (2008) Barmby, P., Huang, J.-S., Ashby, M. L. N., et al. 2008, ApJS, 177, 431
- Bell et al. (2003) Bell, E. F., McIntosh, D. H., Katz, N., et al. 2003, ApJS, 149, 289
- Bell et al. (2005) Bell, E. F., Papovich, C., Wolf, C., et al. 2005, ApJ, 625, 23
- Bell et al. (2004) Bell, E. F., Wolf, C., Meisenheimer, K., et al. 2004, ApJ, 608, 752
- Bell et al. (2007) Bell, E. F., Zheng, X. Z., Papovich, C., et al. 2007, ApJ, 663, 834
- Blanton et al. (2003) Blanton, M. R., Hogg, D. W., Bahcall, N. A., et al. 2003, ApJ, 594, 186
- Borch et al. (2006) Borch, A., Meisenheimer, K., Bell, E. F., et al. 2006, A&A, 453, 869
- Brammer et al. (2008) Brammer, G. B., van Dokkum, P. G., & Coppi, P. 2008, ApJ, 686, 1503
- Brammer et al. (2009) Brammer, G. B., Whitaker, K. E., van Dokkum, P. G., et al. 2009, ApJ, 706, L173
- Brown et al. (2007) Brown, M. J. I., Dey, A., Jannuzi, B. T., et al. 2007, ApJ, 654, 858
- Bruzual & Charlot (2003) Bruzual, G., & Charlot, S. 2003, MNRAS, 344, 1000
- Bundy et al. (2006) Bundy, K., Ellis, R. S., Conselice, C. J., et al. 2006, ApJ, 651, 120
- Calzetti et al. (2000) Calzetti, D., Armus, L., Bohlin, R. C., et al. 2000, ApJ, 533, 682
- Capak et al. (2007) Capak, P., Aussel, H., Ajiki, M., et al. 2007, ApJS, 172, 99
- Cardamone et al. (2010) Cardamone, C. N., van Dokkum, P. G., Urry, C. M., et al. 2010, ApJS, 189, 270
- Cassata et al. (2008) Cassata, P., Cimatti, A., Kurk, J., et al. 2008, A&A, 483, L39
- Chary & Elbaz (2001) Chary, R., & Elbaz, D. 2001, ApJ, 556, 562
- Cirasuolo et al. (2007) Cirasuolo, M., McLure, R. J., Dunlop, J. S., et al. 2007, MNRAS, 380, 585
- Conroy et al. (2009) Conroy, C., Gunn, J. E., & White, M. 2009, ApJ, 699, 486
- Cowie & Barger (2008) Cowie, L. L., & Barger, A. J. 2008, ApJ, 686, 72
- Cowie et al. (1996) Cowie, L. L., Songaila, A., Hu, E. M., et al. 1996, AJ, 112, 839
- Dale & Helou (2002) Dale, D. A., & Helou, G. 2002, ApJ, 576, 159
- Davis et al. (2003) Davis, M., Faber, S. M., Newman, J., et al. 2003, in Presented at the Society of Photo-Optical Instrumentation Engineers (SPIE) Conference, Vol. 4834, Society of Photo-Optical Instrumentation Engineers (SPIE) Conference Series, ed. P. Guhathakurta, 161–172
- Drory et al. (2009) Drory, N., Bundy, K., Leauthaud, A., et al. 2009, ApJ, 707, 1595
- Elbaz et al. (2010) Elbaz, D., Hwang, H. S., Magnelli, B., et al. 2010, A&A, 518, L29+
- Erben et al. (2009) Erben, T., Hildebrandt, H., Lerchster, M., et al. 2009, A&A, 493, 1197
- Faber et al. (2007) Faber, S. M., Willmer, C. N. A., Wolf, C., et al. 2007, ApJ, 665, 265
- Fioc & Rocca-Volmerange (1997) Fioc, M., & Rocca-Volmerange, B. 1997, A&A, 326, 950
- Fontana et al. (2006) Fontana, A., Salimbeni, S., Grazian, A., et al. 2006, A&A, 459, 745
- Franx et al. (2008) Franx, M., van Dokkum, P. G., Schreiber, N. M. F., et al. 2008, ApJ, 688, 770
- Hildebrandt (2010) Hildebrandt, H. 2010, A&A, 99
- Hildebrandt et al. (2009) Hildebrandt, H., Pielorz, J., Erben, T., et al. 2009, A&A, 498, 725
- Hopkins et al. (2010) Hopkins, P. F., Bundy, K., Croton, D., et al. 2010, ApJ, 715, 202
- Ilbert et al. (2009) Ilbert, O., Capak, P., Salvato, M., et al. 2009, ApJ, 690, 1236
- Ilbert et al. (2010) Ilbert, O., Salvato, M., Le Floc’h, E., et al. 2010, ApJ, 709, 644
- Juneau et al. (2005) Juneau, S., Glazebrook, K., Crampton, D., et al. 2005, ApJ, 619, L135
- Kauffmann et al. (2003) Kauffmann, G., Heckman, T. M., White, S. D. M., et al. 2003, MNRAS, 341, 54
- Kennicutt (1998) Kennicutt, Jr., R. C. 1998, ARA&A, 36, 189
- Kormendy & Djorgovski (1989) Kormendy, J., & Djorgovski, S. 1989, ARA&A, 27, 235
- Kriek et al. (2010) Kriek, M., Labbé, I., Conroy, C., et al. 2010, ApJ, 722, L64
- Kriek et al. (2008) Kriek, M., van der Wel, A., van Dokkum, P. G., et al. 2008, ApJ, 682, 896
- Kriek et al. (2006) Kriek, M., van Dokkum, P. G., Franx, M., et al. 2006, ApJ, 649, L71
- Kriek et al. (2009) Kriek, M., van Dokkum, P. G., Labbé, I., et al. 2009, ApJ, 700, 221
- Kriek et al. (2011) Kriek, M., van Dokkum, P. G., Whitaker, K. E., et al. 2011, ArXiv e-prints
- Kroupa (2001) Kroupa, P. 2001, MNRAS, 322, 231
- Labbé et al. (2006) Labbé, I., Bouwens, R., Illingworth, G. D., et al. 2006, ApJ, 649, L67
- Labbé et al. (2007) Labbé, I., Franx, M., Rudnick, G., et al. 2007, ApJ, 665, 944
- Labbé et al. (2005) Labbé, I., Huang, J., Franx, M., et al. 2005, ApJ, 624, L81
- Le Floc’h et al. (2009) Le Floc’h, E., Aussel, H., Ilbert, O., et al. 2009, ApJ, 703, 222
- Le Floc’h et al. (2005) Le Floc’h, E., Papovich, C., Dole, H., et al. 2005, ApJ, 632, 169
- Lilly et al. (2007) Lilly, S. J., Le Fèvre, O., Renzini, A., et al. 2007, ApJS, 172, 70
- Maíz Apellániz (2006) Maíz Apellániz, J. 2006, AJ, 131, 1184
- Maller et al. (2009) Maller, A. H., Berlind, A. A., Blanton, M. R., et al. 2009, ApJ, 691, 394
- Maraston (2005) Maraston, C. 2005, MNRAS, 362, 799
- Maraston et al. (2010) Maraston, C., Pforr, J., Renzini, A., et al. 2010, MNRAS, 407, 830
- Marchesini et al. (2009) Marchesini, D., van Dokkum, P. G., Förster Schreiber, N. M., et al. 2009, ApJ, 701, 1765
- Marchesini et al. (2010) Marchesini, D., Whitaker, K. E., Brammer, G. B., et al. 2010, ApJ
- Martin et al. (2007) Martin, D. C., Wyder, T. K., Schiminovich, D., et al. 2007, ApJS, 173, 342
- Muzzin et al. (2009) Muzzin, A., Marchesini, D., van Dokkum, P. G., et al. 2009, ApJ, 701, 1839
- Muzzin et al. (2010) Muzzin, A., van Dokkum, P., Kriek, M., et al. 2010, ApJ, 725, 742
- Papovich et al. (2011) Papovich, C., Finkelstein, S. L., Ferguson, H. C., et al. 2011, MNRAS, 412, 1123
- Papovich et al. (2006) Papovich, C., Moustakas, L. A., Dickinson, M., et al. 2006, ApJ, 640, 92
- Papovich et al. (2007) Papovich, C., Rudnick, G., Le Floc’h, E., et al. 2007, ApJ, 668, 45
- Pozzetti et al. (2010) Pozzetti, L., Bolzonella, M., Zucca, E., et al. 2010, A&A, 523, A13+
- Probst et al. (2004) Probst, R. G., Gaughan, N., Abraham, M., et al. 2004, in Presented at the Society of Photo-Optical Instrumentation Engineers (SPIE) Conference, Vol. 5492, Society of Photo-Optical Instrumentation Engineers (SPIE) Conference Series, ed. A. F. M. Moorwood & M. Iye, 1716–1724
- Quadri et al. (2007) Quadri, R., van Dokkum, P., Gawiser, E., et al. 2007, ApJ, 654, 138
- Rudnick et al. (2003) Rudnick, G., Rix, H.-W., Franx, M., et al. 2003, ApJ, 599, 847
- Rudnick et al. (2009) Rudnick, G., von der Linden, A., Pelló, R., et al. 2009, ApJ, 700, 1559
- Salpeter (1955) Salpeter, E. E. 1955, ApJ, 121, 161
- Sanders et al. (2007) Sanders, D. B., Salvato, M., Aussel, H., et al. 2007, ApJS, 172, 86
- Schechter (1976) Schechter, P. 1976, ApJ, 203, 297
- Scoville et al. (2007) Scoville, N., Aussel, H., Brusa, M., et al. 2007, ApJS, 172, 1
- Somerville et al. (2004) Somerville, R. S., Lee, K., Ferguson, H. C., et al. 2004, ApJ, 600, L171
- Strateva et al. (2001) Strateva, I., Ivezić, Ž., Knapp, G. R., et al. 2001, AJ, 122, 1861
- Taylor et al. (2009a) Taylor, E. N., Franx, M., van Dokkum, P. G., et al. 2009a, ApJ, 694, 1171
- Taylor et al. (2009b) —. 2009b, ApJS, 183, 295
- van Dokkum (2005) van Dokkum, P. G. 2005, AJ, 130, 2647
- van Dokkum et al. (2009) van Dokkum, P. G., Labbé, I., Marchesini, D., et al. 2009, PASP, 121, 2
- van Dokkum et al. (2010) van Dokkum, P. G., Whitaker, K. E., Brammer, G., et al. 2010, ApJ, 709, 1018
- Wake et al. (2006) Wake, D. A., Nichol, R. C., Eisenstein, D. J., et al. 2006, MNRAS, 372, 537
- Whitaker et al. (2011) Whitaker, K., van Dokkum, P., Brammer, G., et al. 2011, ApJ, submitted
- Whitaker et al. (2010) Whitaker, K. E., van Dokkum, P. G., Brammer, G., et al. 2010, ApJ, 719, 1715
- Williams et al. (2009) Williams, R. J., Quadri, R. F., Franx, M., et al. 2009, ApJ, 691, 1879
- Wolf et al. (2003) Wolf, C., Meisenheimer, K., Rix, H.-W., et al. 2003, A&A, 401, 73
- Wuyts et al. (2007) Wuyts, S., Labbé, I., Franx, M., et al. 2007, ApJ, 655, 51
- Wuyts et al. (2008) Wuyts, S., Labbé, I., Schreiber, N. M. F., et al. 2008, ApJ, 682, 985
- Wyder et al. (2007) Wyder, T. K., Martin, D. C., Schiminovich, D., et al. 2007, ApJS, 173, 293
Appendix A Line emission in the broad/medium-band filters
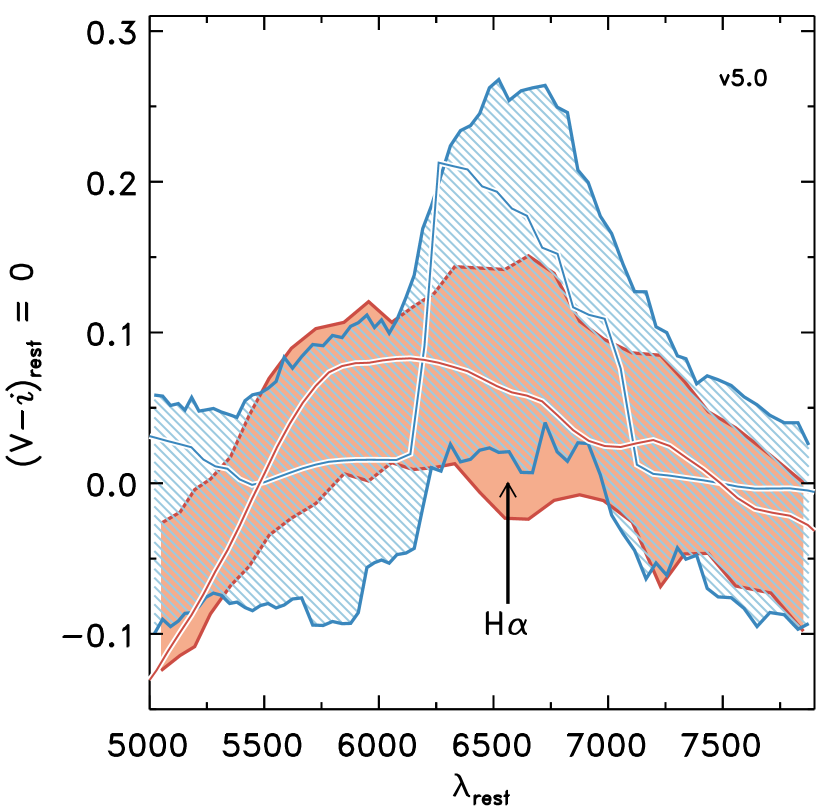
We find that adjusting the treatment of nebular emission lines in the Eazy templates, following Ilbert et al. (2010), significantly improves the quality of our photometric redshift estimates. This treatment becomes even more important as we use medium-band photometry from 4000Å to 1.7 and the medium-width filters are more sensitive to the flux contamination by emission lines. We investigate the contribution of emission lines to the medium- and broad-band photometry in Fig. 9. The shaded regions show the distributions of broad-band fluxes shifted to the rest-frame of objects in the quiescent and star-forming populations, selected as in Fig.1 (see Whitaker et al. (2010) for a more detailed description of the construction of these “rest-frame SEDs”.) We include galaxies over the full redshift range of the NMBS and . We detect the clear signature of H emission, with a shape similar to that expected from a typical filter sensitivity curve, in the average SED of the star-forming sample. This feature is sampled in the figure by, among others, the , , and filters at , respectively. The quiescent population shows no such feature and has a different overall SED shape from the star-forming population. These results highlight both the importance of including emission lines in the redshift templates and also that our star-forming/quiescent selection criterion succeeds in selecting galaxies with/without H emission. The detection of spectral features in the NMBS photometry, including the shape and strength of the H emission line as a function of galaxy SED type, is explored in greater detail by Kriek et al. (2011).
Appendix B Effect of mass measurement errors on the density evolution
Redshift-dependent systematic errors in the stellar masses are an important systematic uncertainty in our study. It is very difficult to assess how important such errors are. As noted in, e.g., Marchesini et al. (2009) the metallicities, IMF, and other parameters could vary systematically with redshift. Furthermore, we sample a different part of “model space” at low redshift (where we rely on models for 10+ Gyr old stellar populations) and high redshift (where we rely on models for younger populations, and star-forming galaxies). In Fig. 10 we show the effects of a 0.1 dex error in the masses on the number densities and the mass densities. The effects are substantial, particularly for the number densities at the highest masses. A 0.1 dex redshift-dependent error implies a range in the evolution of the number density of massive galaxies from very little to a decrease of a factor of 5 between and . The only way to reduce these uncertainties is to obtain dynamical mass measurements of large samples of high redshift galaxies.
| aa: , : | aa: , : | |||
|---|---|---|---|---|
| 0.61 | 34.45.2 | 13.92.1 | 2.50.6 | 3.80.9 |
| 0.96 | 31.04.7 | 13.22.0 | 2.20.6 | 3.50.9 |
| 1.23 | 1.40.3 | 2.10.5 | ||
| 1.48 | 1.70.4 | 2.70.6 | ||
| 1.69 | 1.60.4 | 2.60.6 | ||
| 1.90 | 1.50.3 | 2.40.6 | ||
| 2.10 | 1.20.3 | 2.00.5 | ||
| 2.28 | 0.70.2 | 1.20.3 | ||
| aa: , : | aa: , : | |||||||||||
|---|---|---|---|---|---|---|---|---|---|---|---|---|
| QbbQ: quiescent, SF: star-forming (Fig. 2). | SFbbQ: quiescent, SF: star-forming (Fig. 2). | Q | SF | Q | SF | Q | SF | Q | SF | Q | SF | |
| 0.613 | 7.2 1.4 | 7.3 1.4 | 1.9 0.4 | 1.8 0.3 | 6.5 1.3 | 2.1 0.5 | 4.1 0.8 | 1.2 0.3 | 2.2 0.5 | 0.3 0.1 | 3.4 0.8 | 0.3 0.2 |
| 0.961 | 6.0 1.2 | 6.3 1.3 | 1.6 0.3 | 1.6 0.3 | 5.9 1.2 | 3.1 0.7 | 3.8 0.8 | 1.8 0.4 | 1.9 0.5 | 0.3 0.1 | 3.0 0.8 | 0.4 0.2 |
| 1.234 | 3.1 0.6 | 6.3 1.0 | 0.8 0.2 | 1.6 0.3 | 3.1 0.6 | 2.1 0.4 | 2.0 0.4 | 1.3 0.3 | 1.0 0.3 | 0.4 0.1 | 1.5 0.4 | 0.5 0.2 |
| 1.477 | 2.9 0.5 | 2.4 0.5 | 1.8 0.3 | 1.4 0.3 | 1.2 0.3 | 0.5 0.1 | 2.0 0.5 | 0.7 0.2 | ||||
| 1.692 | 2.4 0.5 | 2.7 0.5 | 1.5 0.3 | 1.6 0.3 | 1.0 0.3 | 0.6 0.2 | 1.7 0.4 | 0.8 0.3 | ||||
| 1.900 | 0.7 0.2 | 0.8 0.2 | 1.1 0.3 | 1.2 0.3 | ||||||||
| 2.100 | 0.6 0.2 | 0.6 0.2 | 0.9 0.3 | 0.9 0.3 | ||||||||
| 2.275 | 0.2 0.1 | 0.4 0.1 | 0.3 0.1 | 0.7 0.2 | ||||||||
| 2.425 | 0.2 0.1 | 0.5 0.2 | 0.3 0.1 | 0.9 0.3 | ||||||||