Discovery of a Large Stellar Periphery Around the Small Magellanic Cloud
Abstract
The Magellanic Clouds are a local laboratory for understanding the evolution and properties of dwarf irregular galaxies. To reveal the extended structure and interaction history of the Magellanic Clouds we have undertaken a large-scale photometric and spectroscopic study of their stellar periphery (the MAgellanic Periphery Survey, MAPS). We present first MAPS results for the Small Magellanic Cloud (SMC): Washington , + DDO51 photometry reveals metal-poor red giant branch stars in the SMC that extend to large radii (11 kpc), are distributed nearly azimuthally symmetrically (ellipticity=0.1), and are well-fitted by an exponential profile (out to 7.5°). An Gyr old, [Fe/H]1.3 main-sequence turnoff is also evident to at least =7.3°, and as far as 8.4in some directions. We find evidence for a “break” population beyond 8 radial scalelengths having a very shallow radial density profile that could be either a bound stellar halo or a population of extratidal stars. The distribution of the intermediate stellar component (3 7.5°) contrasts with that of the inner stellar component ( 3°), which is both more elliptical ( 0.3) and offset from the center of the intermediate component by 0.59°, although both components share a similar radial exponential scale length. This offset is likely due to a perspective effect because stars on the eastern side of the SMC are closer on average than stars on the western side. This mapping of its outer stellar structures indicates that the SMC is more complex than previously thought.
Subject headings:
Galaxies: interactions — Local Group — Magellanic Clouds — Galaxies: dwarf — Galaxies: individual (SMC) — Galaxies: photometry1. Introduction
The Magellanic Clouds (MCs) have had a complex history that includes a recent close encounter with each other (about 200 Myr ago), a presently ongoing period of intense star formation, and immense loss of gas to the various components of the HI Magellanic System (the Magellanic Bridge, Magellanic Stream and Leading Arm). Systematic study of the Small Magellanic Cloud (SMC) stellar morphology started with the pioneering work by de Vaucouleurs (1955), who studied mostly the bright and young structures and noted the SMC’s very irregular shape. Photographic plate photometry of red horizontal branch stars (RHB) helped show that the older SMC population extends to a radius of 5°, is fairly azimuthally symmetric, but has a larger line-of-sight depth on the northeastern side than for the rest of the SMC likely due to the recent interaction with the Large Magellanic Cloud (LMC; Hatzidimitriou & Hawkins, 1989; Gardiner & Hawkins, 1991; Gardiner & Hatzidimitriou, 1992). Additionally, Gardiner & Hawkins (1991) found that the SMC line-of-sight depth on the western side increases with radius, a finding more consistent with a spherically symmetric radial exponential law than with a flattened system (i.e., a disk). Stellar radial velocity studies (Kunkel et al., 2000; Harris & Zaritsky, 2006) show no signs of rotation but instead that the stars are pressure supported and very likely in a spherical or ellipsoidal structure. In contrast, rotation is observed in the HI component of the SMC for 3°(Stanimirović et al., 2004), which reinforces that the structure of the SMC is complex and multi-faceted. In deep CCD photometry of three fields to the south of the SMC, Noël & Gallart (2007) found old SMC stars out to 5.8°, whereas De Propris et al. (2010) find very few SMC stars at a radius of 5toward the east and suggest the edge of the SMC is at a radius of 6 kpc. All of the above results for the SMC are generally in agreement with the following known properties of dIrr galaxies: the old and red stellar components (as traced by evolved stars) are (1) spatially smoother and more extended than their younger and bluer counterparts, and (2) generally follow a radial exponential profile (e.g., Mateo, 1998). However, many questions remain about the structure of the SMC periphery beyond 5°: Where is the edge of the SMC? Does the SMC have a stellar halo or stellar tidal tails? How has the interaction of the MCs with each other (and the MW) disturbed their stellar structures?
We have undertaken the MAgellanic Periphery Survey (MAPS), a large photometric and spectroscopic survey of the stellar periphery of the MCs designed to elucidate their extended structure and kinematics and piece together their past interactions as recorded in their outer morphologies. In this Letter, we present our first photometric results for the SMC (§2). Using Washington , + DDO51 photometry we detect metal-poor SMC red giant branch stars to a radius of 10.6(11.1 kpc) and at all of the many position angles explored around the SMC (§3). These stars are distributed nearly azimuthally symmetrically and are well-fitted by a radial exponential profile to 7.5°. We find evidence for a “break” population beyond 8with a shallower radial density profile that could be a bound stellar halo or a population of extratidal stars ($ 4). The fitted center of the intermediate stellar distribution (3 7.5°) is offset by 0.59from that of the inner stellar distribution, which is also much more elliptical This lack of centration is likely due to a perspective effect (§4).
2. Observations And Data Reduction
The stellar periphery of the SMC was imaged as part of the MAPS survey using the Washington DDO51 photometric system (Majewski et al., 2000a), which substantially helps discriminate foreground MW dwarf stars from the Magellanic red giant branch (RGB) stars. Observations were obtained with the MOSAIC II camera (36′36′) on the CTIO–4m Blanco telescope on UT 2006 February 28–March 4 and UT 2007 August 16–18 with the majority of the SMC data coming from the second observing run. In all fields net integrations of (40, 60, 280)s in (, , DDO51) were acquired, and in a subset of 33 fields (most arranged in four radial “spokes” around the SMC) additional 300s observations were also obtained in and (see Fig. 1). Observations were also obtained for Geisler (1990) standard star fields to enable photometric calibration.
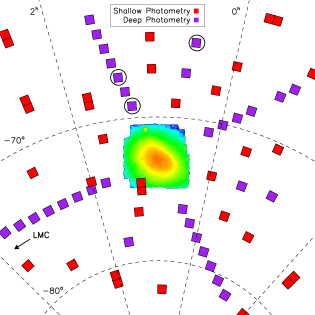
The SuperMACHO pipeline (Rest et al., 2005; Miknaitis et al., 2007) was used to obtain flattened images and the PHOTRED pipeline (D. Nidever et al. 2011, in preparation) was used for the rest of the photometric reduction. PHOTRED makes use of a combination of the stand-alone DAOPHOT/ALLSTAR (Stetson, 1987), ALLFRAME (Stetson, 1994) and Sextractor (Bertin & Arnouts, 1996) packages to make photometric measurements and create final, calibrated, dereddened photometry. Figure 1 shows our MAPS SMC fields and the density of SMC RGB stars in the central region (2°; color image) as selected from the OGLE-III (Udalski et al., 2008) and MCPS (Zaritsky et al., 2002) SMC photometric catalogs. Examples of the final MAPS SMC photometry can be seen in Figure 2.
3. The Radial Density Profile
Figure 2 shows dereddened (, ) color magnitude diagrams (CMDs) and (, DDO51) color-color diagrams (2CDs) for three fields in the northern part of the SMC. These fields are typical for the north and northeastern SMC, which have higher densities than in other directions as described below. The SMC main-sequence (MS), RGB, and red clump (RC) are visible in the three fields extending out to 8.4°. The right-most panel is simulated photometry for the 8.4field using the Besancon Galactic model (Robin et al., 2003) to ascertain the approximate distribution of MW foreground stars. Padova isochrones (Girardi et al., 2002) with [Fe/H]=0.6/0.7 Gyr, [Fe/H]=1.0/2 Gyr, and [Fe/H]=1.3/6 Gyr, shifted to a distance of 63 kpc, are also shown (red, gold and blue respectively) as fiducials. The dominant population in the left three panels is 6 Gyr old but a sizable younger population (2 Gyr) is also visible to at least =6.2as well as a weaker 0.7 Gyr population. Giant and dwarf stars separate well in the 2CD due to the gravity sensitivity of the DDO51 filter. Our giant selection criteria are shown by the dashed line and all stars selected as giants (with 21.0) are plotted as filled red circles.
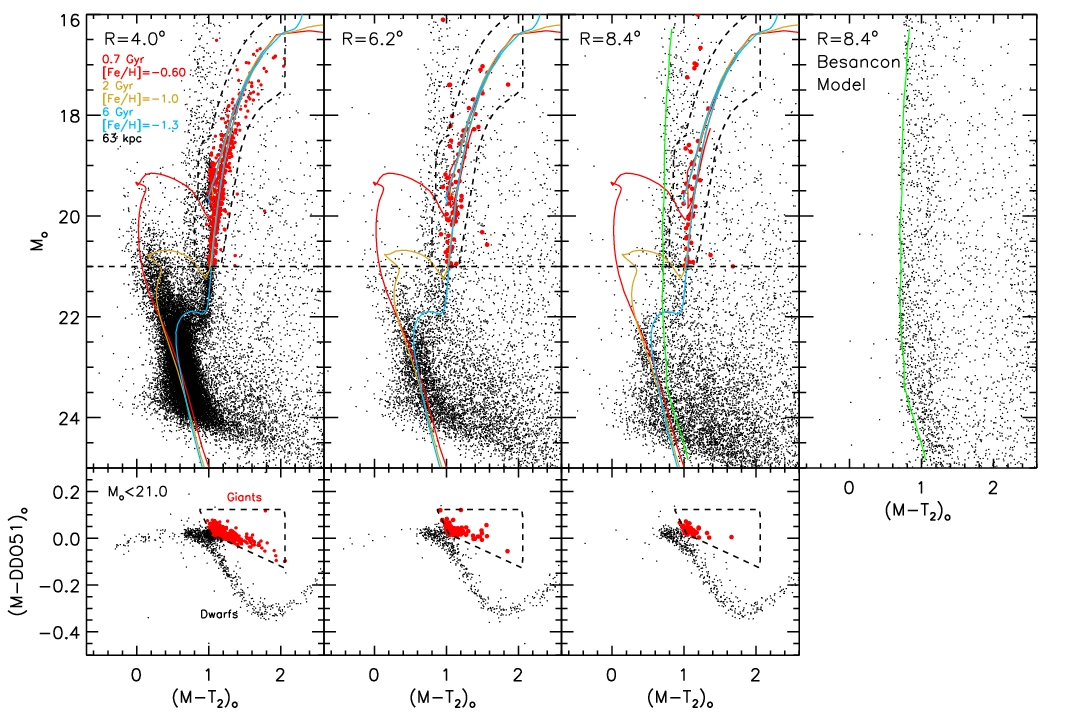
We derive starcounts in our fields by using a 2CD giant selection (dashed line in Fig. 2 lower panels) and an SMC RGB-CMD selection (dashed line in Fig. 2 upper panels). Our starcounts can be contaminated by MW halo giants and metal-poor MW dwarfs that fall in the 2CD giant selection. To estimate and remove this contamination we use the same 2CD selection criteria and the same CMD selection criteria but offset by 3 magnitudes in order to not overlap the SMC stars (following Majewski et al. 2000b; see, e.g., their Fig. 12). This shifted CMD selection extends beyond our bright limit; to account for missing giants we use a related dataset (Majewski, 2004) with the same photometric filters and reduced with the same software but that extends to brighter magnitudes in fields far enough from the MCs not to be contaminated by them; from these we calculate that we are on average missing 22% of the foreground giants due to our brightness limit111This fraction is small because in general the RGB-tip is less well populated.. This constant fraction is used to correct the foreground values for all fields. The selection at these brighter magnitudes should have contamination levels similar to those in our actual SMC selection if the Galactic halo field giants follow a law, which produces a uniform distribution in magnitude (Majewski et al., 2000b). This method has been used (and more extensively explained) in several related studies (Majewski et al., 2000b; Palma et al., 2003; Westfall et al., 2006) and shown to be reliable (Majewski et al., 2005). Finally, we perform a 2D spatial linear fit to the foreground contamination levels of all fields to obtain a smooth distribution.
The starcounts as a function of radial distance from the SMC center (taken as 00h52m44s, 72°49.7′; Mateo, 1998) can be seen in Figure 3a. The median foreground level is shown. Fields with towards the LMC (four fields) were removed because these are heavily “contaminated” by LMC RGB stars. We detect SMC stars above the foreground in all fields to 10.6(11.1 kpc), almost twice as far as the previous most distant photometric detection of SMC stars ( 5.8°, Noël & Gallart, 2007).
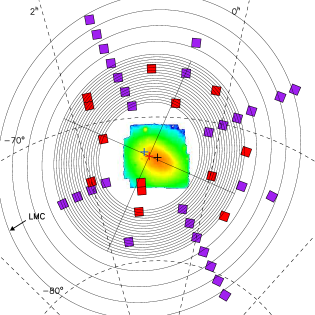
The SMC starcount density follows a general radial exponential, but the distribution is not well-fitted by a single exponential for all radii and position angles, as can be seen by the large scatter about the exponential fit (dashed line, fit to 8fields). The density along each radial spoke follows roughly a radial exponential profile with nearly identical radial scale lengths ( 0.8°) but with different amplitudes – northeastern fields having higher amplitudes than southwestern fields. A simple explanation of this pattern is that the center we have used – the center of the inner stellar distribution – is not appropriate for the outer SMC stellar distribution. Figure 3b shows an elliptical exponential fit to the same fields that also allowed the density center to vary. This provides a much better solution than the previous fit, with best-fitting parameters: 01h00m31s, =72°43′11″4′ (0.59from the Mateo 1998 center), 1.0°, ellipticity0.10, and line-of-nodes154.4(E of N). An illustration of the fitted distribution is shown in Figure 4. The shape of the outer contours (7.5°) is not well constrained by our data since we only sample a few position angles. For Figure 4 the ellipticity and line-of-nodes of the intermediate distribution were simply extended to the outer distribution.
The distribution of RGB stars is quite different for the inner (3°) and intermediate (37.5°) radial regions. The intermediate component is much more azimuthally symmetric (0.1) than the inner component, which is quite elliptical (0.3; Harris & Zaritsky, 2006), and the major axes of the two components are nearly perpendicular (difference of 105°; inner line-of-nodes 50°; Harris & Zaritsky, 2006). The center of the intermediate component is offset by 0.59to the northeast of the center of the inner component (red and black crosses respectively in Fig. 4) – along the inner’s major axis – and is closer to the HI dynamical center (separation=0.38°; Stanimirović et al., 2004).
Finally, Figure 3b, and the sudden increase in contour spacing seen in the outer parts of Figure 4, both show that there is a striking departure from the exponential fit for fields at large radii (7.5°). This “break” population extends from 7.5to our fields at =10.6and has a much shallower radial density profile (7°). Because the detected break population density is only a few times the foreground density, more data are needed to determine its density at these large radii securely.
4. Discussion
It is common for dIrr galaxies to have patchy distributions of young, blue stars but smoother and more extended distributions of older, redder stars that follow exponential (or King) surface density profiles (Mateo, 1998). The fairly azimuthally symmetric elliptical exponential profile of the older SMC stars is consistent with this general trend. However, this symmetrical distribution (0.1) of the stellar periphery is quite surprising in the specific case of the SMC considering (1) the SMC’s recent close encounter with the LMC 200 Myr ago, which stripped large amounts of HI from the SMC to create the Magellanic Bridge (e.g., Muller & Bekki, 2007), (2) that the MCs have just recently passed periGalacticon (e.g., Besla et al., 2007) and thus were subjected to stronger tidal forces from the MW, and (3) that the LMC’s outer stellar contours are more elliptical (0.2; van der Marel, 2001) than the SMC’s even though the LMC is 10 more massive. How is this possible?
On closer inspection, we find that the SMC is not as “undisturbed” as might be suggested from the fairly symmetrical density profile of its intermediate component. Hatzidimitriou et al. (1989) and Gardiner & Hawkins (1991) used red clump stars to show that the line-of-sight depth varies significantly across the face of the SMC. It is much thicker (“puffed-up”) in the northeast and extends to smaller distances there (from the Sun) compared to the southwest. Therefore, the three-dimensional structure of the SMC is somewhat irregular and disturbed, likely due to the recent close interaction of the SMC with the LMC. The fact that the projected density profile is still so symmetric might be a coincidence owing to the particular orientation of the MC system relative to our viewing angle.
The difference in the line-of-sight depths between the eastern and western sides of the SMC suggests a possible explanation for the lack of centration between the inner and outer distributions. Because the stars on the eastern side of the SMC are on average closer than the stars on the western side, the SMC periphery will exhibit a perspective effect. The near-side of the SMC will appear larger than the far-side and the density contours will be “stretched” on the near-side (east) and “bunched-up” on the far-side (west). The net result is that the center of outer contours of a fit to the on-sky densities will be systematically shifted to the near-side, or the east, as observed. A perspective effect has previously been observed to affect the outer contours of the LMC due to the inclination of its stellar disk (van der Marel, 2001). However, it is important to note that the lack of any stellar rotation seen in radial velocities (Kunkel et al., 2000; Harris & Zaritsky, 2006) or proper motions (Piatek et al., 2008) indicates that the SMC does not have a stellar disk (like the LMC), but is pressure supported and likely has a more spheroidal or ellipsoidal shape. The difference in line-of-sight distances across the SMC might be a result of tidal distortions of the SMC shape due to the recent encounter of the MCs 200 Myr ago.
What is the nature of the break population that apparently dominates over 7.510.6and is fairly azimuthally symmetric for at least 270°? The two main possibilities are (1) a tidal tail or debris, or (2) a “classical” bound stellar halo as exists around the MW and M31 (e.g., Guhathakurta et al., 2005). The MCs had a recent close encounter (200 Myr ago), which no doubt had a profound impact on the SMC. The LMC very likely stripped HI gas from the SMC to form the Magellanic Bridge, and possibly also puffed-up the stellar distribution on the northeastern side of the SMC. It’s possible that this encounter also created a stellar tidal stream. Extratidal stars energy sort into the well-known double-tidal tail shape only outside a few tidal radii and at smaller radii can appear fairly azimuthally symmetric (Muñoz et al., 2008). Since the tidal radius of the SMC is 4–9 kpc (Stanimirović et al., 2004) the break population is within 2 tidal radii; it is, therefore, difficult to distinguish a bound classical halo from extratidal stars in this regime. An anlysis of the kinematics and velocity dispersion of these stars as well as further photometric mapping at more position angles and larger radii might help elucidate their true nature (i.e., bound versus unbound). Either way, these stars can be thought of as a newfound “halo” component of the SMC.
De Propris et al. (2010) claim that the edge of the SMC is at a radius of 6 kpc on the eastern side because they detected only five spectroscopically-confirmed SMC giants in an eastern field at 5 kpc. We have a field 1.6away (but at a similar radius) from theirs and find 57 giant candidates with our WashingtonDDO51 selection method (21.0). When we also use the De Propis et al. 2MASS selection criteria (13 14, 0.5 1.5) this reduces the number of giants to five in agreement with the De Propris et al. result. The difference in detected giants between the two techniques is due to the shallowness of the De Propis et al. selection, which is limited to 17 at the color of the SMC RGB (1.7). As can be seen in the =6.2panel of Figure 2 this selection only samples the very tip of the SMC RGB whereas our selection goes four magnitudes fainter and is more sensitive to lower SMC densities. Therefore, we find the De Propris et al. conclusion that the SMC edge toward the east is at 6 kpc to be premature; our deeper data show that the SMC extends to much larger radii (at least 9 kpc and likely to 11 kpc, Fig. 3).
5. Summary
In this paper we have discovered SMC stars to a radius nearly twice as large as the previous most-distant SMC detections. We observe two outer SMC stellar structures:
-
1.
An intermediate component of older stars dominates over 37.5°, follows a slightly elliptical exponential profile (=1.0°), is nearly azimuthally symmetric (=0.1), and has a center that is offset from the center of the inner stellar distribution by 0.59(to the northeast) likely due to perspective effects. The structure of this component is probably spheroidal or ellipsoidal.
-
2.
An outer component dominating 7.510.6that is fairly azimuthally symmetric over at least 270and has a shallow radial scale length (7°). The component could be a bound stellar halo or a population of extratidal stars. Analysis of kinematics and velocity dispersions of these stars and further photometric mapping are needed to better reveal the nature of this component.
The SMC, therefore, appears to be much more complex than previously thought and composed of several structural components, like larger galaxies.
References
- Bertin & Arnouts (1996) Bertin, E., & Arnouts, S. 1996, A&AS, 117, 393
- Besla et al. (2007) Besla, G., Kallivayalil, N., Hernquist, L., Robertson, B., Cox, T. J., van der Marel, R. P., & Alcock, C. 2007, ApJ, 668, 949
- De Propris et al. (2010) De Propris, R., Rich, R. M., Mallery, R. C., & Howard, C. D. 2010, ApJ, 714, L249
- de Vaucouleurs (1955) de Vaucouleurs, G. 1955, AJ, 60, 219
- Gardiner & Hawkins (1991) Gardiner, L. T., & Hawkins, M. R. S. 1991, MNRAS, 251, 174
- Gardiner & Hatzidimitriou (1992) Gardiner, L. T., & Hatzidimitriou, D. 1992, MNRAS, 257, 195
- Geisler (1990) Geisler, D. 1990, PASP, 102, 344
- Girardi et al. (2002) Girardi, L., Bertelli, G., Bressan, A., Chiosi, C., Groenewegen, M. A. T., Marigo, P., Salasnich, B., & Weiss, A. 2002, A&A, 391, 195
- Guhathakurta et al. (2005) Guhathakurta, P., Ostheimer, J. C., Gilbert, K. M., Rich, R. M., Majewski, S. R., Kalirai, J. S., Reitzel, D. B., & Patterson, R. J. 2005, arXiv:astro-ph/0502366
- Harris & Zaritsky (2006) Harris, J., & Zaritsky, D. 2006, AJ, 131, 2514
- Hatzidimitriou et al. (1989) Hatzidimitriou, D., Hawkins, M. R. S., & Gyldenkerne, K. 1989, MNRAS, 241, 645
- Hatzidimitriou & Hawkins (1989) Hatzidimitriou, D., & Hawkins, M. R. S. 1989, MNRAS, 241, 667
- Kunkel et al. (2000) Kunkel, W. E., Demers, S., & Irwin, M. J. 2000, AJ, 119, 2789
- Majewski et al. (2000a) Majewski, S. R., Ostheimer, J. C., Kunkel, W. E., & Patterson, R. J. 2000, AJ, 120, 2550
- Majewski et al. (2000b) Majewski, S. R., Ostheimer, J. C., Patterson, R. J., Kunkel, W. E., Johnston, K. V., & Geisler, D. 2000, AJ, 119, 760
- Majewski (2004) Majewski, S. R. 2004, PASA, 21, 197
- Majewski et al. (2005) Majewski, S. R., et al. 2005, AJ, 130, 2677
- Mateo (1998) Mateo, M. L. 1998, ARA&A, 36, 435
- Miknaitis et al. (2007) Miknaitis, G., et al. 2007, ApJ, 666, 674
- Muller & Bekki (2007) Muller, E., & Bekki, K. 2007, MNRAS, 381, L11
- Muñoz et al. (2008) Muñoz, R. R., Majewski, S. R., & Johnston, K. V. 2008, ApJ, 679, 346
- Noël & Gallart (2007) Noël, N. E. D., & Gallart, C. 2007, ApJ, 665, L23
- Palma et al. (2003) Palma, C., Majewski, S. R., Siegel, M. H., Patterson, R. J., Ostheimer, J. C., & Link, R. 2003, AJ, 125, 1352
- Piatek et al. (2008) Piatek, S., Pryor, C., & Olszewski, E. W. 2008, AJ, 135, 1024
- Rest et al. (2005) Rest, A., et al. 2005, ApJ, 634, 1103
- Robin et al. (2003) Robin, A. C., Reylé, C., Derrière, S., & Picaud, S. 2003, A&A, 409, 523
- Schlegel et al. (1998) Schlegel, D. J., Finkbeiner, D. P., & Davis, M. 1998, ApJ, 500, 525
- Stanimirović et al. (2004) Stanimirović, S., Staveley-Smith, L., & Jones, P. A. 2004, ApJ, 604, 176
- Stetson (1987) Stetson, P. B. 1987, PASP, 99, 191
- Stetson (1994) Stetson, P. B. 1994, PASP, 106, 250
- Udalski et al. (2008) Udalski, A., et al. 2008, Acta Astronomica, 58, 329
- van der Marel (2001) van der Marel, R. P. 2001, AJ, 122, 1827
- Westfall et al. (2006) Westfall, K. B., Majewski, S. R., Ostheimer, J. C., Frinchaboy, P. M., Kunkel, W. E., Patterson, R. J., & Link, R. 2006, AJ, 131, 375
- Zaritsky et al. (2002) Zaritsky, D., Harris, J., Thompson, I. B., Grebel, E. K., & Massey, P. 2002, AJ, 123, 855
| Field NameaaField names are of format “radius–L/S–PA” where radius is 10 degrees, L=LMC center, S=SMC center, PA=position angle with respect to L/S. | RA | DEC | PASMC | Ngiants | Nback | Error | |||
|---|---|---|---|---|---|---|---|---|---|
| (J2000) | (J2000) | (deg) | (deg) | (deg) | stars deg-2 | stars deg-2 | |||
| 190L225a | 01:09:37.5 | 75:05:20.2 | 2.54 | 2.47 | 154.71 | 2581 | 9 | 7,142.6 | 141.4 |
| 190L225b | 01:09:37.7 | 74:32:07.8 | 2.08 | 1.93 | 147.21 | 4588 | 9 | 12,718.0 | 188.3 |
| 40S026 | 01:12:44.0 | 69:10:20.5 | 4.00 | 3.90 | 26.38 | 549 | 8 | 1,502.5 | 65.6 |
| 40S071 | 01:39:58.5 | 71:10:10.1 | 4.00 | 3.82 | 71.25 | 664 | 8 | 1,819.6 | 72.1 |
| 40S116 | 01:46:01.8 | 74:11:49.4 | 4.01 | 3.68 | 116.21 | 862 | 9 | 2,367.8 | 82.0 |
| 40S161 | 01:15:02.7 | 76:33:26.8 | 4.01 | 3.99 | 161.12 | 443 | 10 | 1,202.5 | 59.1 |
| 40S206 | 00:23:05.9 | 76:18:51.1 | 4.00 | 4.74 | 205.95 | 387 | 10 | 1,046.9 | 55.4 |
| 40S251 | 23:58:31.1 | 73:41:24.9 | 3.99 | 5.09 | 251.11 | 219 | 9 | 582.8 | 42.0 |
| 40S296 | 00:09:14.2 | 70:44:37.8 | 3.98 | 4.71 | 296.28 | 258 | 7 | 694.6 | 45.3 |
| 40S341 | 00:38:32.0 | 69:00:41.0 | 3.99 | 4.13 | 341.40 | 613 | 7 | 1,681.9 | 69.2 |
| 51S026 | 01:17:01.9 | 68:08:35.3 | 5.10 | 5.08 | 26.31 | 336 | 7 | 911.3 | 51.5 |
| 51S116 | 02:01:57.7 | 74:24:59.7 | 5.11 | 4.83 | 116.21 | 316 | 9 | 850.7 | 50.1 |
| 51S206 | 00:12:06.9 | 77:12:56.0 | 5.10 | 5.92 | 206.05 | 94 | 10 | 232.0 | 28.4 |
| 51S296 | 23:58:53.2 | 70:04:08.2 | 5.08 | 5.87 | 296.29 | 88 | 7 | 223.3 | 27.2 |
| 62S004 | 00:56:55.2 | 66:38:54.9 | 6.19 | 6.22 | 3.85 | 96 | 7 | 247.0 | 28.2 |
| 62S026 | 01:20:59.5 | 67:06:38.5 | 6.20 | 6.27 | 26.30 | 84 | 7 | 211.7 | 26.6 |
| 190L247a | 01:45:19.8 | 68:40:59.2 | 5.97 | 6.07 | 52.62 | 94 | 8 | 237.2 | 28.1 |
| 190L247b | 01:45:23.8 | 68:07:40.3 | 6.41 | 6.56 | 49.45 | 55 | 8 | 129.1 | 22.1 |
| 62S116 | 02:18:15.9 | 74:33:39.2 | 6.21 | 5.99 | 116.19 | 91 | 9 | 225.5 | 27.9 |
| 62S161 | 01:33:01.8 | 78:32:00.0 | 6.20 | 6.20 | 161.23 | 117 | 10 | 295.4 | 31.4 |
| 62S206 | 23:59:48.7 | 78:05:24.3 | 6.19 | 7.10 | 205.98 | 45 | 10 | 94.7 | 20.8 |
| 62S229 | 23:33:42.3 | 76:08:26.4 | 6.19 | 7.45 | 228.65 | 54 | 10 | 121.2 | 22.3 |
| 62S251 | 23:27:09.3 | 73:46:09.7 | 6.19 | 7.55 | 251.14 | 23 | 9 | 37.7 | 15.8 |
| 62S274 | 23:33:58.2 | 71:24:38.8 | 6.18 | 7.38 | 273.69 | 32 | 8 | 65.9 | 17.6 |
| 62S296 | 23:48:59.5 | 69:21:19.1 | 6.19 | 7.04 | 296.20 | 30 | 7 | 63.3 | 16.9 |
| 62S319 | 00:09:27.0 | 67:48:38.4 | 6.18 | 6.62 | 318.82 | 59 | 6 | 145.5 | 22.5 |
| 62S341 | 00:32:29.6 | 66:52:48.6 | 6.19 | 6.34 | 341.28 | 69 | 6 | 173.3 | 24.2 |
| 73S026 | 01:24:38.8 | 66:04:26.4 | 7.30 | 7.46 | 26.31 | 37 | 7 | 81.4 | 18.6 |
| 73S116 | 02:34:51.4 | 74:38:19.3 | 7.31 | 7.16 | 116.25 | 36 | 9 | 72.5 | 18.8 |
| 73S206 | 23:45:16.0 | 78:55:16.4 | 7.29 | 8.29 | 206.05 | 26 | 11 | 40.8 | 17.0 |
| 73S296 | 23:40:06.5 | 68:36:58.1 | 7.28 | 8.19 | 296.28 | 21 | 6 | 39.3 | 14.7 |
| 84S026 | 01:27:56.9 | 65:01:32.0 | 8.40 | 8.66 | 26.26 | 27 | 7 | 53.9 | 16.3 |
| 84S206 | 23:28:36.8 | 79:42:14.4 | 8.39 | 9.49 | 206.07 | 29 | 11 | 47.8 | 17.7 |
| 84S251 | 22:56:08.2 | 73:33:12.7 | 8.38 | 10.03 | 251.21 | 18 | 9 | 22.9 | 14.6 |
| 84S341 | 00:27:34.1 | 64:44:27.9 | 8.39 | 8.57 | 341.31 | 37 | 5 | 87.2 | 18.1 |
| 95S026 | 01:31:06.9 | 63:59:01.2 | 9.50 | 9.87 | 26.31 | 22 | 7 | 40.2 | 15.1 |
| 95S206 | 23:09:15.3 | 80:25:10.6 | 9.49 | 10.70 | 206.13 | 32 | 12 | 54.8 | 18.5 |
| 95S296 | 23:23:41.8 | 67:02:55.2 | 9.48 | 10.54 | 296.28 | 19 | 5 | 36.2 | 13.9 |
| 106S026 | 01:33:53.8 | 62:55:24.9 | 10.60 | 11.09 | 26.23 | 17 | 7 | 26.4 | 13.7 |
| 106S206 | 22:47:15.1 | 81:04:02.9 | 10.59 | 11.91 | 206.10 | 45 | 12 | 89.4 | 21.1 |
| 106S296 | 23:16:16.8 | 66:13:51.0 | 10.58 | 11.73 | 296.27 | 15 | 5 | 26.4 | 12.6 |