FIRE Spectroscopy of Five Late-type T Dwarfs Discovered with the Wide-field Infrared Survey Explorer111This paper includes data gathered with the 6.5-m Magellan Telescopes located at Las Campanas Observatory, Chile.
Abstract
We present the discovery of five late-type T dwarfs identified with the Wide-field Infrared Survey Explorer (WISE). Low-resolution near-infrared spectroscopy obtained with the Magellan Folded-port InfraRed Echellette (FIRE) reveal strong H2O and CH4 absorption in all five sources, and spectral indices and comparison to spectral templates indicate classifications ranging from T5.5 to T8.5:. The spectrum of the latest-type source, WISE J1812+2721, is an excellent match to that of the T8.5 companion brown dwarf Wolf 940B. WISE-based spectrophotometric distance estimates place these T dwarfs at 12-13 pc from the Sun, assuming they are single. Preliminary fits of the spectral data to the atmosphere models of Saumon & Marley indicate effective temperatures ranging from 600 K to 930 K, both cloudy and cloud-free atmospheres, and a broad range of ages and masses. In particular, two sources show evidence of both low surface gravity and cloudy atmospheres, tentatively supporting a trend noted in other young brown dwarfs and exoplanets. In contrast, the high proper motion T dwarf WISE J20187423 exhibits a suppressed -band peak and blue spectrophotometric colors indicative of an old, massive brown dwarf; however, it lacks the broadened -band peak seen in metal-poor counterparts. These results illustrate the broad diversity of low-temperature brown dwarfs that will be uncovered with WISE.
Subject headings:
stars: fundamental parameters — stars: individual (WISEPC J161705.75+180714.0, WISEPC J181210.85+272144.3, WISEPC J201824.98742326.1, WISEPC J231336.41803701.4, WISEPC J235941.07733504.8) — stars: low mass, brown dwarfs1. Introduction
The discovery in 1995 of a faint companion to the nearby M dwarf Gliese 229 galvanized the field of brown dwarf observational astrophysics. Its near-infrared spectrum exhibits strong H2O and CH4 absorption, unambiguous indicators of a low-temperature, substellar atmosphere (Nakajima et al., 1995; Oppenheimer et al., 1995). These features now define the T dwarf spectral class (Burgasser et al., 2006b), the coldest known brown dwarfs with effective temperatures extending down to Teff 500 K (e.g., Burningham et al. 2008; Lucas et al. 2010). Over 200 T dwarfs have been uncovered in the past 15 years,222For an up-to-date compilation, see the DwarfArchives website, http://dwarfarchives.org. identified primarily in wide-field, near-infrared imaging surveys such as the Two Micron All Sky Survey (2MASS; Skrutskie et al. 2006; e.g., Burgasser et al. 2002; Looper et al. 2007), the Sloan Digital Sky Survey (SDSS; York et al. 2000; e.g., Geballe et al. 2002; Chiu et al. 2006), the United Kingdom Infrared Telescope Deep Sky Survey (UKIDSS; Lawrence et al. 2007; e.g., Lodieu et al. 2007; Burningham et al. 2010b), and the Canada-France Brown Dwarf Survey (CFBDS; Delorme et al. 2008b, a; Reylé et al. 2010).
Efforts are now underway to identify even colder brown dwarfs, sources whose atmospheres are anticipated to bridge the temperature gap between the known population and the Jovian planets (Teff 125 K). This is the realm in which directly detectable young extrasolar planets are now being found and investigated (e.g., Kalas et al. 2008; Marois et al. 2008; Janson et al. 2010; Bowler et al. 2010b; Currie et al. 2010). Theoretical models of substellar atmospheres predict several interesting chemical transitions at these temperatures, including the emergence of NH3 as a prominent absorber at near-infrared wavelengths; the condensation of H2O and formation of thick ice clouds; and the condensation of alkali salts, depleting brown dwarf atmospheres of spectrally prominent K I and Na I gases (Lodders, 1999; Lodders & Fegley, 2002; Marley et al., 2002; Burrows et al., 2003; Saumon et al., 2006; Leggett et al., 2007). All of these transitions have been suggested as possible triggers for the definition of a new spectral class, tentatively designated the Y dwarf class (Kirkpatrick, 2005). These “ultracold” brown dwarfs may also comprise the bulk of the Galactic substellar population. Depending on the underlying mass function, number densities for brown dwarfs colder than 600 K may exceed those of their warmer counterparts by a factor of a few or more (Burgasser, 2004; Saumon & Marley, 2008). These sources would also sample the minimum brown dwarf formation mass, an important statistic for brown dwarf formation theories (e.g., Whitworth & Stamatellos 2006) and a determinant for the total baryonic mass associated with compact objects (e.g., Graff & Freese 1996).
Two intriguing sources—both companions to nearby stars—have recently been identified whose estimated Teff 300–400 K may broach the Y-dwarf regime (Luhman et al., 2011; Liu et al., 2011). However, their extremely faint near-infrared magnitudes ( 21.5) have so far impeded spectroscopic follow-up. In order to identify a significant sample of similarly cold brown dwarfs, search programs must shift to mid-infrared wavelengths where the majority of spectral flux emerges (Burrows et al., 2003). The Wide-field Infrared Survey Explorer (WISE; Wright et al. 2010), which has surveyed the full sky in four infrared bands centered at wavelengths of 3.4 (), 4.6 (), 12 () and 22 (), provides an opportunity to find these cold brown dwarfs. The and bands were specifically designed to differentiate T dwarfs from background sources, sampling the strong 3.3 CH4 band and the pseudo-continuum peak at 4.6 , respectively (Oppenheimer et al., 1998; Burrows et al., 2003; Golimowski et al., 2004). Mainzer et al. (2011) have recently reported the first cold brown dwarf discovery with WISE, WISEPC J045853.90+643451.9 (hereafter WISE J0458+6434), a source which exhibits nearly saturated near-infrared H2O and CH4 bands consist with a T9 classification (see also Gelino et al. 2011).
In this article, we report the discovery of five new late-type T dwarfs identified in WISE and confirmed through near-infrared spectroscopy with the Folded-port Infrared Echellette (FIRE; Simcoe et al. 2008, 2010). In Section 2 we describe the selection of these sources based on WISE photometry and additional survey data. In Section 3 we describe our follow-up imaging and spectroscopic observations that confirm the T dwarf nature of these sources. In Section 4 we derive spectral classifications using both spectral indices and comparison to near-infrared spectral templates, and estimate distances and kinematics. In Section 5 we provide additional constraints on the atmospheric and physical properties of these sources through spectral model fits using the calculations of Saumon & Marley (2008). In Section 6 we discuss the properties of individual discoveries in detail. Results are summarized in Section 7.
2. Candidate Selection
2.1. WISE Photometry
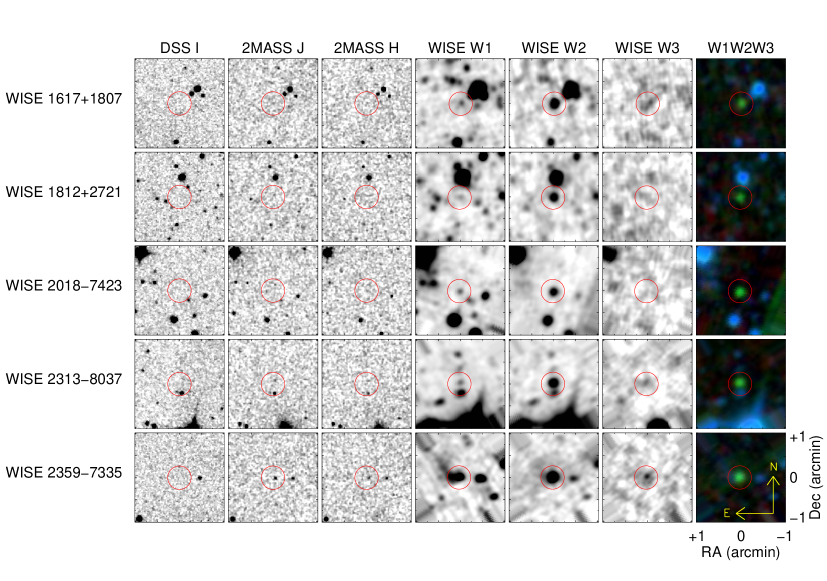
Candidate late-type T dwarfs were selected from the WISE coadd source working database, as described in detail in Mainzer et al. (2011) and J. D. Kirkpatrick et al. (in prep.). In brief, sources were selected to have 2, 2.5 (to exclude extragalactic sources; see Wright et al. 2010), a signal-to-noise ratio 10, and a point spread function consistent with an unresolved point source. These sources were then compared to optical and near-infrared imaging survey data from the Digitized Sky Survey (DSS), SDSS and 2MASS to exclude optical counterparts and other contaminants. The five new T dwarfs presented here represent only a subset of the full candidate pool currently under investigation. Their designations333Throughout the text, we use the shorthand notation WISE Jhhmmddmm to refer to WISE sources, where the suffix is the sexagesimal Right Ascension (hour and minute) and declination (degree and arcminute). and measured photometry (excluding ) are listed in Table 1. Figure 1 displays DSS, 2MASS and WISE images of the fields around each target.
| Designation | ||||||||||
|---|---|---|---|---|---|---|---|---|---|---|
| (mag) | (mag) | (mag) | (mag) | (mag) | (mag) | (mag) | (mag) | (mag) | ||
| WISEPC J161705.75+180714.0 | 18.710.04 | 17.660.08 | 18.230.08 | 16.890.16 | 14.030.06 | 12.480.48 | 4.200.10 | 2.860.17 | 1.550.48 | |
| WISEPC J181210.85+272144.3 | 18.190.06 | 18.830.16 | 17.320.21 | 14.150.05 | 12.4 | 4.680.17 | 3.170.21 | 1.8 | ||
| WISEPC J201824.98742326.1 | 17.110.21aaPhotometry from the 2MASS Reject Table (WISE J20187423 and WISE J23138037) and 6x Catalogs (WISE J23597335; Skrutskie et al. 2006). | 16.5aaPhotometry from the 2MASS Reject Table (WISE J20187423 and WISE J23138037) and 6x Catalogs (WISE J23597335; Skrutskie et al. 2006). | 16.6aaPhotometry from the 2MASS Reject Table (WISE J20187423 and WISE J23138037) and 6x Catalogs (WISE J23597335; Skrutskie et al. 2006). | 16.550.10 | 13.760.03 | 12.3 | 2.7 | 2.800.11 | 1.5 | |
| WISEPC J231336.41803701.4 | 16.970.24aaPhotometry from the 2MASS Reject Table (WISE J20187423 and WISE J23138037) and 6x Catalogs (WISE J23597335; Skrutskie et al. 2006). | 16.2aaPhotometry from the 2MASS Reject Table (WISE J20187423 and WISE J23138037) and 6x Catalogs (WISE J23597335; Skrutskie et al. 2006). | 16.4aaPhotometry from the 2MASS Reject Table (WISE J20187423 and WISE J23138037) and 6x Catalogs (WISE J23597335; Skrutskie et al. 2006). | 16.290.07 | 13.770.04 | 12.520.32 | 2.4 | 2.520.08 | 1.250.33 | |
| WISEPC J235941.07733504.8 | 16.170.04aaPhotometry from the 2MASS Reject Table (WISE J20187423 and WISE J23138037) and 6x Catalogs (WISE J23597335; Skrutskie et al. 2006). | 16.070.07aaPhotometry from the 2MASS Reject Table (WISE J20187423 and WISE J23138037) and 6x Catalogs (WISE J23597335; Skrutskie et al. 2006). | 16.050.13aaPhotometry from the 2MASS Reject Table (WISE J20187423 and WISE J23138037) and 6x Catalogs (WISE J23597335; Skrutskie et al. 2006). | 15.120.04 | 13.260.04 | 11.630.20 | 2.650.19 | 1.860.06 | 1.630.20 |
2.2. Additional Survey Photometry and Astrometry
All of the WISE targets were cross-matched to the 2MASS, SDSS and UKIDSS catalogs. One source, WISE J23597335, had a counterpart in the 2MASS Point Source and 6x catalogs444This source had been previously identified by D. Looper as part of a color-selected search of the 2MASS 6x catalog, but not published; see Looper et al. (2007). It is included here despite having ., with a magnitude in the latter of 16.170.04. WISE J20187423 and WISE J23138037 had faint counterparts in the 2MASS Reject Catalog, with = 17.110.21 and 16.970.24 mag, respectively (detection grades of “C” and “E”), located 7-10 from their WISE positions. We confirmed these counterparts were associated using our -band FIRE acquisition images (see Section 3.2.1). WISE J1617+1807 has a nearby counterpart in the SDSS Data Release 7 catalog 9 from its WISE position, but this match appears spurious based on the source’s blue optical colors ( = 21.910.16, ). No common proper motion companions were found within 5 of any of the WISE sources in SIMBAD or in the US Naval Observatory CCD Astrograph Catalog (UCAC3; Zacharias et al. 2010).
| Astrometry | aaBased on the spectrophotometric distance estimates listed in Table 5. | |||||
|---|---|---|---|---|---|---|
| Source | 2MASS | WISE | (yr) | (mas yr-1) | (mas yr-1) | (km s-1) |
| WISE J20187423 | 20:18:24.24 74:23:17.92 | 20:18:24.98 74:23:26.14 | 9.6 | 31132 | 85231 | 566 |
| WISE J23138037 | 23:13:35.37 80:36:56.24 | 23:13:36.40 80:37:01.40 | 10.4 | 24232 | 49629 | 315 |
| WISE J23597335 | 23:59:40.33 73:35:05.33 | 23:59:41.07 73:35:04.87 | 9.5 | 33226 | 4923 | 203 |
The roughly ten-year baseline between the 2MASS and WISE detections of WISE J20187423, WISE J23138037 and WISE J23597335 allows proper motion measurements for these sources. Astrometry from the two catalogs are listed in Table 2, and the computed proper motions incorporate uncertainties in the 2MASS and WISE positions but do not account for parallactic motion. We note that an error in the astrometric calibration pipeline of the WISE working database (now corrected) leads to an occasional large offset (of order 1) in declination coordinate. As such, these proper motions should be considered preliminary until the WISE Final Release catalog astrometry is available. Nevertheless, the relatively large angular motions of these sources, as high as 091003 yr-1 for WISE J20187423, are typical for nearby field dwarfs.
3. Observations
3.1. Imaging
3.1.1 SOAR/SpartanIRC
-band photometry of WISE J1617+1807 were obtained on 2010 March 21 (UT) in clear conditions with the Spartan Infrared Camera (SpartanIRC; Loh et al. 2004) on the 4.1m SOAR telescope. The source was observed at an airmass of 1.53 with five 60-s exposures in each filter, dithered in 40 offsets. Imaging data were reduced using custom routines that perform flat-fielding and sky-subtraction, the latter from a sky frame created from a median stack of the dither image sequence. A 22 mosaic was created by stacking the reduced images to a common center and averaging. Aperture photometry was measured for all sources in the mosaic, and photometric calibration was done on the 2MASS system using three bright stars in the field-of-view, with a zero-point uncertainty estimated from the standard deviation of photometric offsets for these three stars. Measurements are listed in Table 1.
3.1.2 Fan Mountain/FanCam
-band photometry of WISE J1617+1807 was obtained on 2010 April 1 (UT) in photometric conditions with the FanCam near-infrared imager mounted on the 0.8 m Fan Mountain telescope (Kanneganti et al., 2009). Imaging data were obtained and reduced as described in Mainzer et al. (2011), with 15 exposures of 60 s and 80 exposures of 30 s obtained in a 15 dither pattern, for a total exposure time of 55 minutes. Aperture photometry on the mosaicked frame was measured using standard IRAF routines, with an instrumental zeropoint derived by estimating -band magnitudes of neighboring stars from their 2MASS and photometry and the transformation of Hamuy et al. (2006). We found = 18.710.04 for WISE J1617+1807, implying = 4.680.07, about 0.7 mag bluer than WISE J0458+6434 (Mainzer et al., 2011).
3.1.3 Palomar/WIRC
-band photometry of WISE J1812+2721 were obtained on 2010 Aug 30 (UT) using the Wide-Field Infrared Camera (WIRC; Wilson et al. 2003) mounted on the 200-inch Hale Telescope at Palomar Observatory. WIRC has a pixel scale of 02487 pixel-1 and a total field of view of 8787. Conditions were clear during the observations, but with high humidity and poor seeing (2.5 at ). For each filter, a series of 15 exposures of 60 s each were obtained, dithering by 50-100. Targets were observed over an airmass range of 1.09–1.13.
The imaging data were reduced using a suite of IRAF555Image Reduction and Analysis Facility (IRAF; Tody 1986). and FORTRAN programs provided by T. Jarrett. These routines first linearize and dark subtract the images, then create a sky frame and flat field images for each dither set which are subtracted from and divided into (respectively) each science image. At this stage, WIRC images still contain a significant bias that is not removed by the flat field. Comparison of 2MASS and WIRC photometric differences across the array shows that this flux bias has a level of 10% and the pattern is roughly the same for all filters. Using these 2MASS-WIRC differences for many fields, we created a flux bias correction image that was applied to each of the “reduced” images. Finally, we determined an astrometric calibration for the images using 2MASS stars in the field, and the images were mosaicked together. This final mosaic was photometrically calibrated using 2MASS stars, and magnitudes computed using aperture photometry. Measurements are listed in Table 1.
3.2. Spectroscopy
3.2.1 Magellan/LDSS-3
Optical spectroscopy of WISE J23597335 was obtained on 2005 December 2 (UT) in clear conditions using the Low Dispersion Survey Spectrograph (LDSS-3; Allington-Smith et al. 1994) mounted on the Magellan 6.5m Clay Telescope (see Table 3 for a complete observing log). Data were obtained using the VPH-red grism (660 lines/mm) and the 075 (4-pixel) wide longslit, aligned along the parallactic angle, providing 6050–10500 Å spectroscopy with 1800. The OG590 longpass filter was used to eliminate second order light shortward of 6000 Å. Two exposures of 1800 s each were obtained over an airmass range of 1.62–1.81. This was followed by observation of the nearby G2 V star HD 10991 ( = 9.38) for telluric absorption correction. HeNeAr arc lamp and flat-field quartz lamp exposures reflected off of the Clay secondary flat field screen were obtained for dispersion and pixel response calibration. The data were reduced using the IRAF onedspec package, as described in Burgasser et al. (2007).
| Source | Instrument | UT Date | Integration | Airmass | Calibrator | Conditions/ |
|---|---|---|---|---|---|---|
| (s) | Star | Seeing | ||||
| WISE J1617+1807 | Magellan/FIRE | 2010 Apr 7 | 282 | 1.74 | BD+29 3523 | clear, 06 |
| WISE J1812+2721 | Magellan/FIRE | 2010 Sep 19 | 1045 | 1.88-2.03 | BD+30 3488 | clear, 15–2 |
| WISE J20187423 | Magellan/FIRE | 2010 Sep 20 | 526 | 1.53-1.55 | HD 189588 | clear, 04 |
| WISE J23138037 | Magellan/FIRE | 2010 Sep 20 | 526 | 1.61 | HD 189588 | clear, 04 |
| WISE J23597335 | Magellan/LDSS-3 | 2005 Dec 2 | 3600 | 1.62-1.81 | HD 10991 | clear, 08 |
| AAT/IRIS2 | 2006 May 15 | 600/600aaFor and observations, respectively. | 1.49/1.60aaFor and observations, respectively. | HIP 118079 | clear & humid, 15 | |
| AAT/IRIS2 | 2006 June 11 | 600 | 1.52 | HIP 118079 | clear & humid, 2 | |
| Magellan/FIRE | 2010 Dec 24 | 846 | 2.02-2.14 | HD 189588 | clear, 08 | |
| Wolf 940B | Magellan/FIRE | 2010 Sep 19 | 1045 | 1.14-1.15 | HD 208368 | clear, 15–2 |
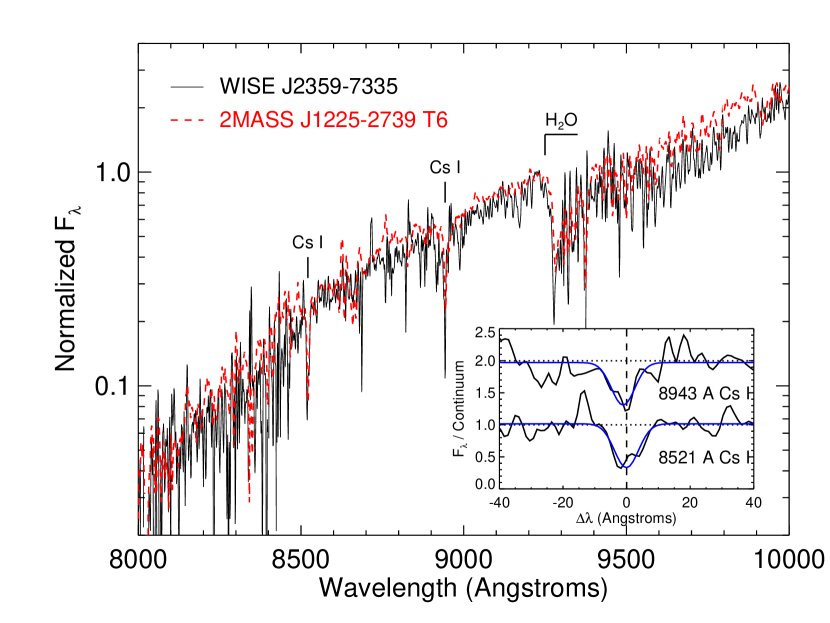
Figure 2 displays a portion of the WISE J23597335 LDSS-3 spectra spanning 8000–10000 Å, compared to equivalent data666These data were obtained with the Low-Resolution Imaging Spectrometer (LRIS; Oke et al. 1995). for the T6 dwarf 2MASS J122554322739466 (hereafter 2MASS J12252739; Burgasser et al. 1999, 2003a). Both spectra are logarithmically scaled to highlight absorption features within their steep red optical slopes. Absorption from Cs I (8521 and 8943 Å) and H2O (9250 Å bandhead) are visible. The pseudoequivalent widths of the Cs I lines were measured to be 4.91.7 Å and 8.92.5 Å, respectively, the latter consistent with measurements for mid-type T dwarfs (Burgasser et al., 2003a).
3.2.2 AAT/IRIS2
Near-infrared spectroscopy of WISE J23597335 was obtained on 2006 May 15 and 2006 June 11 (UT) with the Infrared Imager and Spectrograph (IRIS2; Tinney et al. 2004) mounted on the 3.9m Anglo-Australian Telescope (AAT). Conditions on both nights were clear but humid with poor seeing (15–2). Spectra in the -band (1.47–1.81 ) were obtained in May using the 1-wide slit, Sapphire-240 transmission grating and Jl filter, at an airmass of 1.49. Spectra in the -band (1.47–1.81 ) were obtained in both May and June using the 1-wide slit, SAPPHIRE-316 transmission grating and Hs filter, at airmasses of 1.60 and 1.52, respectively. Average resolution of these spectral modes is = 2100. Individual exposures of 150 s were obtained in ABBA dither patterns nodding along the slit, for a total exposures of 600 s at and 1200 s at . The G0 V star HIP 118079 was observed on both nights immediately after the WISE target for telluric absorption and flux calibration. Exposures of Quartz halogen and Xe lamps reflected off of the AAT flat-field screen were also obtained at the beginning of each night for pixel response correction and high-order dispersion calibration of the wavelength scale. The latter calibration was then updated using the telluric OH emission in the science frames. Data were reduced following the procedures described in Tinney et al. (2005).


Figure 3 displays the resulting spectra, smoothed to = 500. The data have relatively low signal-to-noise (5 at the 1.27 peak; 10 at the 1.58 peak), but are nevertheless sufficient to resolve the strong near-infrared H2O and CH4 bands characteristic of mid- to late-type T dwarf spectra.
3.2.3 Magellan/FIRE
Near-infrared spectroscopy of the WISE candidates and the T8.5 dwarf companion brown dwarf Wolf 940B (Burningham et al., 2009) was obtained on three separate runs during 2010 April 7, 2010 September 19-20, and 2010 December 24 (UT). All targets were observed with FIRE in its low-resolution, prism-dispersed mode, which delivers 0.85–2.45 continuous spectroscopy in a single order. Each source was initially acquired using FIRE’s -band acquisition camera, then placed into a 06 slit aligned to the parallactic angle (rotator angle 895). This prism/slit combination provides a variable resolution of = 250-350 across the near-infrared band. A series of AB or ABBA dither exposure sequences were obtained with integrations ranging from 60 s to 120 s per exposure (plus 10.6 s read time), the latter being the maximum permitted to avoid saturating OH telluric lines in the -band. The spectrograph detector was read out using the 4-amplifier mode at “high gain” (1.2 counts/e-) with either Fowler-8 sampling (April and September) or Sample Up The Ramp (December) modes. Each science target observation was accompanied by an observation of a nearby A0 V calibrator star (typically with = 10–12) at a similar airmass. Given FIRE’s high sensitivity, these calibrators were occasionally observed out of focus and/or offset from the slit to avoid saturation in FIRE’s minimum readout time (11.6 s). We also obtained exposures of a variable voltage quartz flat field lamp (set at 1.2 V and 2.2 V) and arc lamps (NeAr) reflected off of Baade’s secondary flat-field screen for pixel response and wavelength calibration. Data were reduced using a combination of IRAF (NOAO onedspec package) and IDL777Interactive Data Language. routines (SpeXtool xcombspec and xtellcor_general; Vacca et al. 2003; Cushing et al. 2004), as described in detail in Burgasser et al. (2010b).

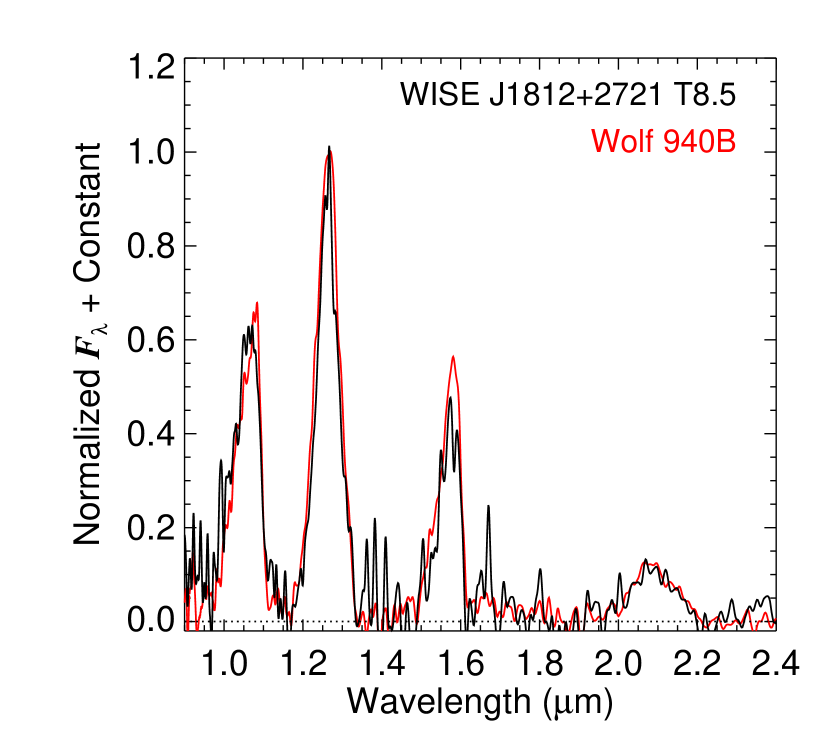
Figure 4 displays the reduced FIRE spectra. Signal-to-noise at the 1.27 peak varies from 20 for WISE J1812+2721 to 100 for WISE J1617+1807. All of the WISE spectra exhibit strong H2O and CH4 bands, absorption from the pressure-broadened red wing of the 0.77 K I doublet, and blue near-infrared spectral energy distributions, characteristic signatures of late-type T dwarfs. The 1.1 and 1.6 bands are particularly deep in the spectra of WISE J1617+1807, WISE J1812+2721 and WISE J23138037, comparable to the bands seen in the spectrum of Wolf 940B. These features are weakest in the spectrum of WISE J23597335. WISE J20187423 exhibits an unusually flat 2.1 -band flux peak compared to the other sources, a region dominated by collision-induced H2 absorption (Linsky 1969; Saumon et al. 1994; see Section 6.3). Note that the lower signal-to-noise spectrum of WISE J1812+2721 is due to its faintness ( = 18.190.02) and poor observing conditions on 2010 September 19 (airmass 2; seeing 15). Nevertheless, its overall spectral shape is clearly indicative of a very late-type T dwarf.
4. Characterizing the T Dwarfs
4.1. Spectral Classification
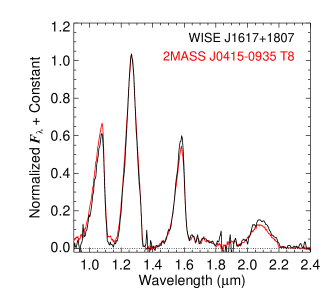
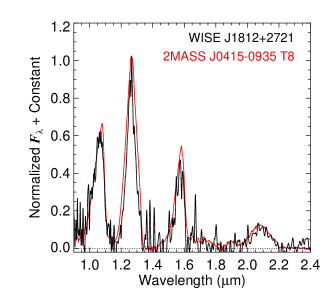
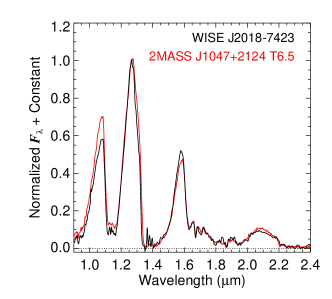
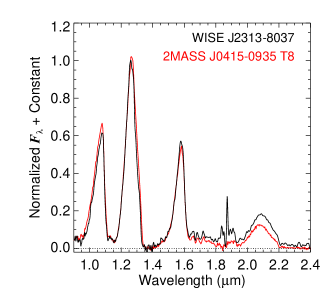
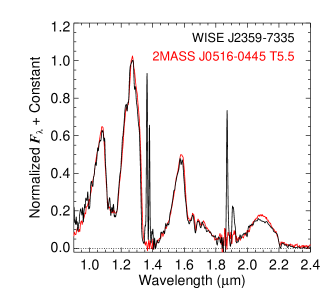
The T dwarfs were classified using their FIRE spectra following two methods. First, we compared the data to a suite of spectral templates drawn from the SpeX Prism Spectral Libraries888See http://www.browndwarfs.org/spexprism., including the T dwarf standards defined in Burgasser et al. (2006b). The SpeX prism data (Rayner et al., 2003) have lower resolution than the FIRE data, = 90–120; we therefore smoothed the latter to this resolution using a gaussian kernel. We quantified the agreement between normalized WISE and template spectra using the statistic, sampling over the wavelength regions 1.0–1.35 , 1.45–1.8 and 2.0–2.4 to avoid strong telluric absorption. Figure 5 displays the best-matching templates for each of the WISE targets. Note that the spectra of WISE J1812+2721 and (to a lesser extent) WISE J23138037 appear later than that of the T8 spectral standard 2MASS J041519540935066 (hereafter 2MASS J04150935; Burgasser et al. 2002) based on their narrower -band flux peaks.
| Index | WISE J1617+1807 | WISE J1812+2721 | WISE J2018-7423 | WISE J2313-8037 | WISE J2359-7335 | Wolf 940B |
|---|---|---|---|---|---|---|
| H2O-J | 0.0200.004 (T8) | 0.040.05 (T7/T8) | 0.0860.006 (T7) | 0.0440.008 (T8) | 0.2060.008 (T5) | 0.0260.012 (T8) |
| CH4-J | 0.1700.003 (T8) | 0.120.03 (T8) | 0.1980.004 (T8) | 0.1160.004 (T8) | 0.2610.004 (T7) | 0.1000.013 (T8) |
| H2O-H | 0.1590.007 (T8) | 0.140.13 (T6/T9) | 0.2440.011 (T7) | 0.1740.012 (T8) | 0.3430.011 (T5) | 0.130.04 (T8/T9) |
| CH4-H | 0.1080.006 (T8) | 0.290.11 (T5/T7) | 0.2310.010 (T7) | 0.1420.011 (T8) | 0.3150.008 (T6) | 0.080.04 (T8) |
| CH4-K | 0.0330.016 (T7) | -0.030.23 (N/A) | 0.170.04 (T5/T7) | 0.140.03 (T6/T7) | 0.1450.007 (T6) | 0.000.12 (N/A) |
| 0.2750.003 (T8/T9) | 0.220.04 (T9) | 0.4200.005 (T6) | 0.3240.005 (T8) | 0.5490.005 (T6) | 0.2510.014 (T9) | |
| K/J | 0.1560.002 | 0.140.03 | 0.0970.003 | 0.1960.004 | 0.1580.002 | 0.1350.012 |
| aaSpectrophotometric colors computed from the spectral data following Cushing et al. (2005). | -0.210.05 | -0.50.8 | -0.540.10 | 0.120.07 | -0.480.02 | -0.70.4 |
| Template SpT | T8 | T8 | T6.5 | T8 | T5.5 | T8 |
| Adopted SpT | T8 | T8.5: | T7 | T8 | T5.5 | T8.5 |
Note. — Index spectral types based on the index ranges defined in Burningham et al. (2010b), which incorporates the definitions set out by Burgasser et al. (2006b) for T0-T8 dwarfs and Burningham et al. (2008, for the index) for T9 dwarfs. The final type is an average of the index types and the template classification, accounting for upper/lower limits.
We also computed the near-infrared classification indices H2O-J, CH4-J, H2O-H, CH4-H, CH4-K and from the FIRE data using the definitions given in Burgasser et al. (2006b) and Warren et al. (2007), and the spectral type/index ranges defined in Burningham et al. (2010b) which extend to type T9. For completeness, we also measured the K/J index defined in Burgasser et al. (2006b) and the spectrophotometric color on the MKO999Mauna Kea Observatory filter system; see Tokunaga et al. (2002) and Simons & Tokunaga (2002). system following Cushing et al. (2005). We accounted for uncertainty in these measures through Monte Carlo simulation, sampling 1000 realizations of each spectrum varied pixel-by-pixel by random offsets drawn from a normal distribution scaled to the noise spectrum. The final index values, listed in Table 4, reflect the means and standard deviations of these measurements. The associated spectral types for each index, rounded off to the nearest half subtype, are also listed in Table 4. These types are generally in agreement with each other and with the template-comparison classification, although the noisier spectrum of WISE J1812+2721 results in greater scatter. The final classifications were taken as an average of the index and template classifications, accounting for limits in the index types. Classifications range from T5.5 for WISE J23597335 to T8.5: for WISE J1812+2721, where the colon indicates an uncertain classification due to noise. WISE J1617+1807, WISE J1812+2721 and WISE J23138037 are all classified as T8 and later.
4.2. Estimated Distances and Kinematics
To estimate the distances of these T dwarfs, we first derived a linear absolute magnitude/spectral type relation for T6–T8 dwarfs based on WISE photometry (Mainzer et al., 2011) and parallax measurements (Perryman et al., 1997; Tinney et al., 2003; Vrba et al., 2004) for the T6 dwarf SDSSp J162414.37+002915.6 (Strauss et al., 1999), the T7.5 dwarf Gliese 570D (Burgasser et al., 2000) and the T8 dwarf 2MASS J04150935. The inferred relation is
| (1) |
where SpT(T6) = 6, SpT(T8) = 8, etc. The scatter in the fit is formally 0.03 mag; however, due to the small number of calibrators used we assume a systematic uncertainty of 0.1 mag. Distances, taking into account uncertainties in the photometry, spectral classification (0.5-1.0 subtypes) and absolute magnitude relation are listed in Table 5. All of the WISE T dwarfs in this sample are roughly 12–13 pc from the Sun (modulo 1.5–3 pc uncertainties), assuming they are single.
For WISE J20187423, WISE J23138037 and WISE J23597335, we combined these distances with proper motion measurements to infer tangential velocities. We find = 566 km s-1, 315 km s-1 and 203 km s-1 for these sources, respectively. The motions of WISE J23138037 and WISE J23597335 are consistent with the mean kinematics of nearby field T dwarfs (3020 km s-1; Faherty et al. 2009), while WISE J20187423 is a 1 outlier. This high velocity source is discussed in further detail in Section 6.3.
5. Spectral Model Fits
To further characterize these brown dwarfs, we compared our FIRE spectra to both cloudy and cloud-free atmosphere models from Saumon & Marley (2008). We restricted our analysis to the near-infrared spectra alone; i.e., we did not include the WISE photometry. As such, this analysis should be regarded as a preliminary reconnaissance of the atmospheric and physical properties of these dwarfs. A more comprehensive modeling effort will be presented in a forthcoming paper (M. Cushing et al. 2011, in preparation)


| Model Fit | Photometric | |||||||
|---|---|---|---|---|---|---|---|---|
| Source | SpT | Teff | Cloudy? | Mass | Age | Distance | Distance | |
| (K) | (cm s-2) | (MJup) | (Gyr) | (pc) | (pc) | |||
| WISE J1617+1807 | T8 | 600 | 4.0 | Yes | 73 | 0.20.3 | 13.10.6 | 13.01.5 |
| WISE J1812+2721 | T8.5: | 620 | 4.3 | No | 137 | 0.91.3 | 193 | 133 |
| WISE J2018-7423 | T7 | 710 | 5.4 | Yes? | 509 | 104 | 12.22.3 | 13.11.4 |
| WISE J2313-8037 | T8 | 600 | 4.0 | Yes | 73 | 0.30.4 | 9.30.4 | 11.71.6 |
| WISE J2359-7335 | T5.5 | 930 | 5.1 | No | 3818 | 44 | 173 | 12.51.7 |
| Wolf 940B | T8.5 | 560 | 5.0 | Yes? | 3010 | 74 | 11.51.6 | 12.50.7aaParallax distance measurement for the Wolf 940A primary (Harrington & Dahn, 1980). |
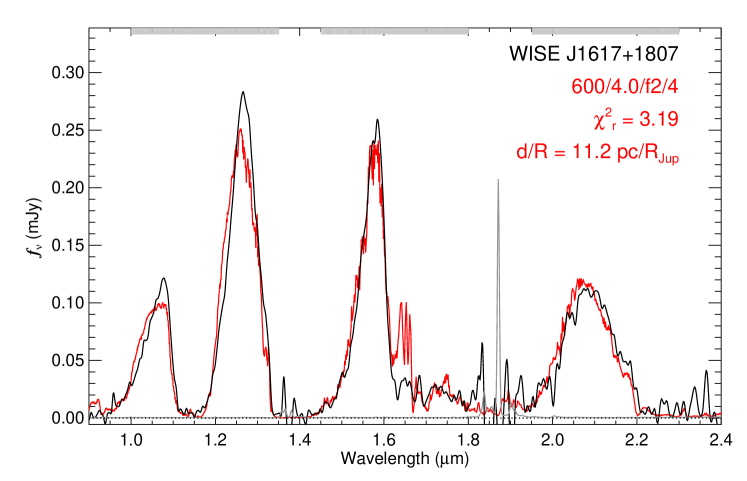
We followed a fitting prescription similar to that described in Burgasser et al. (2010b), built upon contemporary work by Cushing et al. (2008) and Bowler et al. (2009). We used solar metallicity models with non-equilibrium chemistry (eddy diffusion parameter = 104 cm s-2; Griffith & Yelle 1999; Saumon et al. 2006; Hubeny & Burrows 2007), and considered both cloud-free and cloudy models, the latter with condensate sedimentation parameter = 2 (Ackerman & Marley, 2001). Atmospheric parameters Teff = 500–1000 K (50 K steps) and = 4.0–5.5 cgs (0.5 dex steps) were sampled, with corresponding physical parameters (mass, age and radius) determined using the appropriate evolutionary tracks from Saumon & Marley (2008). The FIRE spectra were scaled to the apparent -band magnitude of each source, and both models and data were smoothed to a common resolution of = 300 and sampled at 4 pixels per resolution element to match FIRE’s projected slit width. Spectra were compared in the 1.0–1.35 , 1.45–1.8 and 1.95–2.3 regions, using the statistic to assess both the goodness-of-fit and the relative scaling factor , where is the radius of the brown dwarf and its distance from the Sun. We further constrained our fits by requiring that the model-inferred distance be within 3 of the estimated distance based on photometry (Section 4.2). Note that this constraint is only weakly sensitive to unresolved multiplicity since both distances are based on photometric scaling. Means and uncertainties in the atmospheric parameters were determined using the F-distribution probability distribution function (F-PDF) as a weighting factor (Equations 1–4 in Burgasser et al. 2010b). Sampling uncertainties of 25 K and 0.25 dex were also imposed on the inferred Teff and values, which were propagated into the estimated physical parameters.
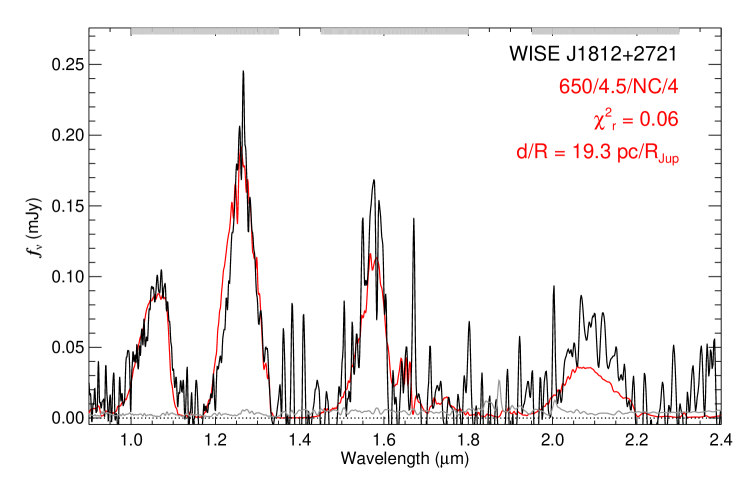
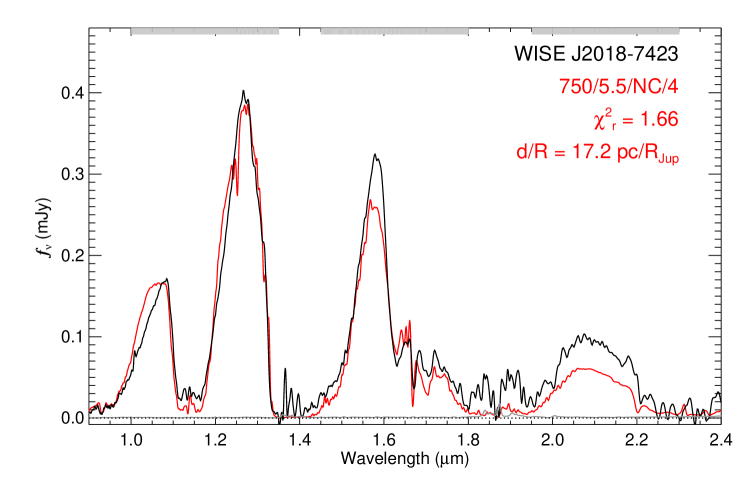
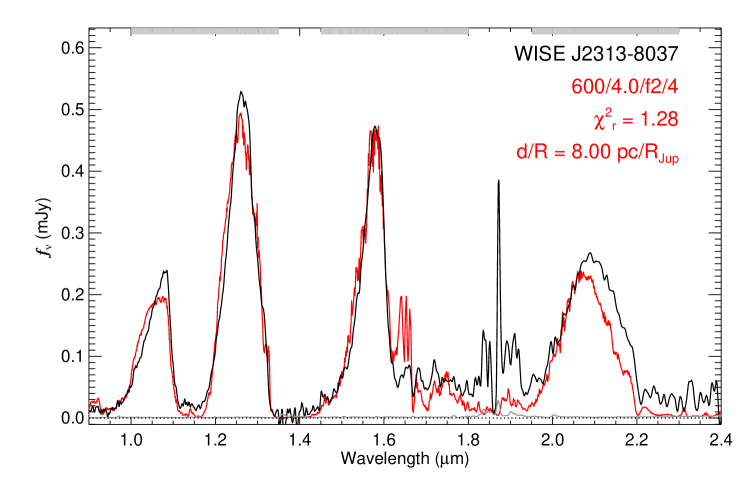
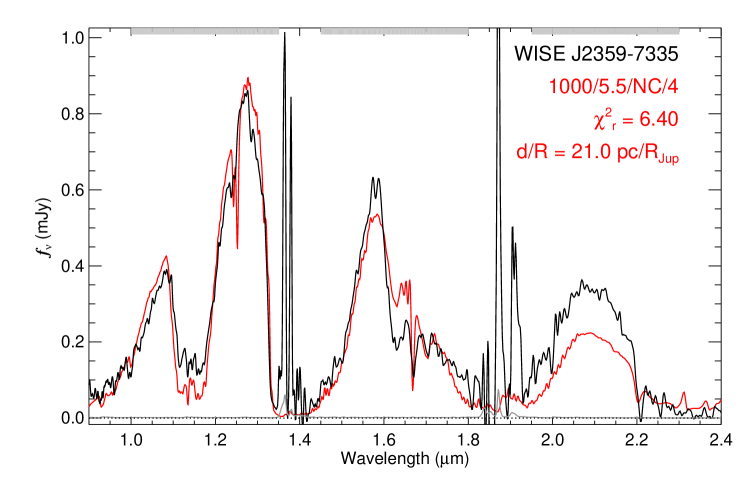
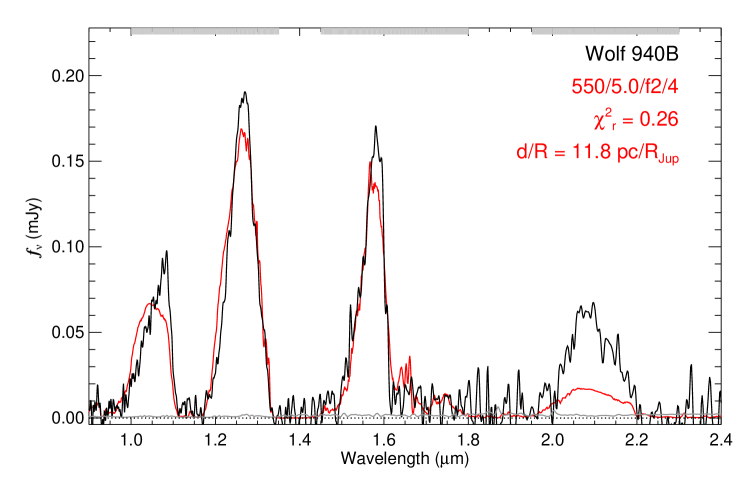
Figures 6–11 show the best-fitting models for each of the WISE spectra and for Wolf 940B, as well as the F-PDF weighted distributions of Teff, and parameters. Table 5 summarizes the inferred atmospheric and physical parameters. Overall, the models provide reasonable fits to the spectral data, with the exception of known discrepancies in the core of the 1.6–1.7 CH4 band, the strength of the 1.25 K I lines (for the warmer T dwarfs), and the detailed shape of the 1.05 -band peak. Fits to WISE J23597335 are particularly poor, likely due to the best fitting models residing at the end of our parameter range. For Wolf 940B, the best-fitting models poorly reproduce the brightness of the observed -band peak. Examining the inferred parameters in detail, we find that Teffs track well with spectral type and are consistent with the spectral type/Teff scales of Golimowski et al. (2004); Stephens et al. (2009) and Marocco et al. (2010). This correlation may be an artifact of the imposed distance constraints, which are tied to the /spectral type relation defined above. However, our inferred parameters for Wolf 940B, which are constrained by the parallactic distance of the system (Harrington & Dahn, 1980), are consistent with the broad-band spectral fitting results of Leggett et al. (2010). We infer similar Teffs for the WISE targets when the distance constraint is removed. Surprisingly, a range of cloud parameters are indicated, with both WISE J1617+1807 and WISE J23138037 exhibiting evidence for the presence of photospheric cloud opacity. We discuss some of these secondary parameters in further detail below.
6. Discussion of Individual Sources
6.1. The T8.5: Dwarf WISE J1812+2721
The latest-type source in this sample is WISE J1812+2721, tentatively classified T8.5: based on spectral comparison to 2MASS J0415-0935 in Figure 5 and spectral indices. It also has the reddest color in our sample. While this classification is somewhat uncertain due to the lower signal-to-noise of the spectral data, its binned spectrum is very similar to that of Wolf 940B, itself classified T8.5 (Figure 12). Near- and mid-infrared spectral model fits to Wolf 940B indicate Teff = 585–625 K and = 4.83–5.22 cgs for an age of 3–10 Gyr (Leggett et al., 2010), similar to the results we infer here. For WISE J1812+2721 we find a comparable Teff but much lower surface gravity, age and mass. While surface gravity determinations should in general be treated with caution (see below), the agreement in spectral morphology and inferred Teff confirms the cool nature of this source.
6.2. WISE J1617+1807 and WISE J23138037: Young and Cloudy Field T Dwarfs?
WISE J1617+1807 and WISE J23138037 exhibit relatively red spectrophotometric colors and large ratios for their spectral types, and our spectral model fits suggest cool (Teff = 600 K), low surface gravity ( = 4.0 cgs), and cloudy atmospheres. The inferred surface gravities are driven largely by the relatively bright -band peaks of these spectra, an indication of reduced collision induced H2 absorption; surface gravity variations in the absorption strength of this molecule is also cited as an explanation for the red near-infrared colors of young, low-mass L dwarfs (e.g., Lucas et al. 2001; Kirkpatrick et al. 2006, 2008; Allers et al. 2007). Thick clouds may also give rise to reddened colors in L dwarf spectra (e.g., Knapp et al. 2004; Stephens et al. 2009), so it is pertinent that the spectra of both WISE J1617+1807 and WISE J23138037 are best fit by cloudy models. Cloud opacity primarily influences the flux peaks in brown dwarf spectra, which represent minima in gas opacity (Ackerman & Marley, 2001). As such, the models without clouds exhibit -band peaks that are too strong for these two sources. This discrepancy drives our model fits toward cloudier atmospheres.
The presence of clouds has recently been suggested in similar model fits to the T8 dwarf Ross 458C, a widely-separated companion to a nearby M dwarf binary system which has an independent age constraint of 150–800 Myr (Burgasser et al., 2010b; Goldman et al., 2010; Scholz, 2010a). The similarity in the inferred properties of Ross 458C, WISE J1617+1807 and WISE J23138037—low temperature, low surface gravity and cloudy atmospheres—appears indicative of a trend toward cloudier atmospheres in younger brown dwarfs. Indeed, such a trend has previously been proposed to explain the spectra of young L dwarfs (e.g., Metchev & Hillenbrand 2006; Stephens et al. 2009) and in contemporary studies of directly-detected exoplanets (e.g., Bowler et al. 2010b; Currie et al. 2011; Madhusudhan et al. 2011). While compelling, evidence for these trends are not yet conclusive. Our model fits for the WISE T dwarfs indicate relatively young ages (200–300 Myr) and low masses (7 MJup), values that are somewhat suspect for a pair of isolated field objects (although we cannot rule out membership in a nearby young association such as AB Doradus or Tucana Horologium; Zuckerman et al. 2001, 2004). The fits are also constrained by fairly uncertain spectrophotometric distance estimates. Moreover, we have not considered metallicity variations in this study which are also known to modulate the -band peaks of both L and T dwarf spectra (Burgasser et al. 2006a; Burgasser 2007; Liu et al. 2007; Looper et al. 2008). We therefore regard the increased role of clouds in shaping young T dwarf spectra as a suggestive trend, and defer further analysis to more comprehensive, broad-band spectral modeling (M. Cushing, in prep.).
6.3. WISEPC J201824.98742326.1: An Old Blue T Dwarf?
WISE J20187423 exhibits an opposing spectral peculiarity: a suppressed -band peak resulting in an unusually blue spectrophotometric near-infrared color ( = 0.540.10) and small index (0.0970.003) for its spectral type. Previously identified blue T dwarfs, such as 2MASS J09373487+2931409 ( = 1.100.07; = 0.08; Burgasser et al. 2002, 2006a; Knapp et al. 2004) and SDSS J141624.08+134826.7B (hereafter SDSS J1416+1348B, = 1.580.17; = 0.0370.004; Burningham et al. 2010a; Burgasser et al. 2010a; Scholz 2010b), have similarly suppressed -band peaks from strong collision-induced H2 absorption, attributed to a high surface gravity and/or subsolar metallicity. Our spectral model fits support a high surface gravity for this source, indicating 5.4 cgs, age 6 Gyr and mass M 50 MJup; the estimated = 566 km s-1 of this object supports a relatively old age. However, our fits cannot test whether this source is metal-poor.
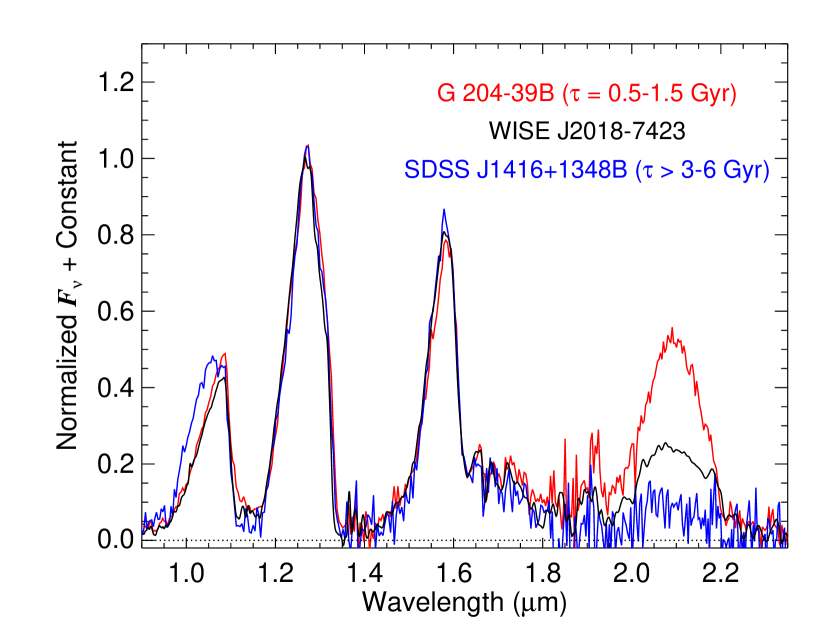
Fortunately, metallicity effects can be separately discerned in the 1.05 -band peak, which is broadened in both the theoretical and observed spectra of metal-poor T dwarfs (Burgasser et al., 2006a, 2010a). In Figure 13 we compare the spectrum of WISE J20187423 to those of two equivalently-classified T dwarf companions to stars with independent age and metallicity constraints: the young, metal-rich T6.5 G 204-39B (a.k.a. SDSS J175805.46+463311.9; Knapp et al. 2004; Faherty et al. 2010) and the old, metal-poor T7 SDSS J1416+1348B. G 204-39A is an M3 star which exhibits weak signatures of H and X-ray activity consistent with = 0.5–1.5 Gyr, and optical spectral indicators (i.e., ratio of TiO/CaH) suggesting a slightly supersolar metallicity. SDSS J1416+1348A is an unusually blue L dwarf, and spectral model fits to both primary and secondary indicate an older ( Gyr) and possibly metal-poor system (e.g., Bowler et al. 2010a; Burgasser et al. 2010a, b; Cushing et al. 2010. As Figure 13 shows, the spectra of all three sources are roughly equivalent in the 1.2–1.8 region, but vary in -band peak brightness, with WISE J20187423 being the intermediate source. More importantly, WISE J20187423 does not have the broadened 1.05 peak seen in the spectrum of SDSS J1416+1348B. This comparison suggests that WISE J20187423 is a roughly solar-metallicity field brown dwarf that is both older and more massive than the average local population.
7. Summary
We have identified five new late-type T dwarfs with WISE, confirmed through low-resolution, near-infrared spectroscopy with the Magellan FIRE spectrograph. The spectra indicate classifications ranging from T5.5 to T8.5:, with the latest-type source, WISE J1812+2721, found to be an excellent match to the T8.5 companion brown dwarf Wolf 940B. Estimated distances are roughly 12–13 pc, assuming single sources. Preliminary spectral model fits indicate Teffs as low as 600 K, with a broad range of surface gravities, masses, ages and cloud properties. In particular, WISE J1617+1807 and WISE J23138037 show indications of being young, low-mass and cloudy based on the relative strengths of their flux peaks, characteristics similar to the 150–800 Myr T8 companion Ross 458C; while the relatively blue and high proper motion T dwarf WISE J20187423 may be a solar-metallicity, older and more massive brown dwarf. Validation of the atmospheric and physical properties of these objects requires more comprehensive broad-band modeling with improved treatment of molecular opacities and the role of clouds. Nevertheless, it is clear from these early results that WISE will produce an extensive and diverse sample of cool brown dwarfs that can be used to improve our physical understanding of low-temperature, substellar atmospheres (J. D. Kirkpatrick et al. 2011, in preparation).
References
- Ackerman & Marley (2001) Ackerman, A. S., & Marley, M. S. 2001, ApJ, 556, 872
- Allers et al. (2007) Allers, K. N., Jaffe, D. T., Luhman, K. L., Liu, M. C., Wilson, J. C., Skrutskie, M. F., Nelson, M., Peterson, D. E., Smith, J. D., & Cushing, M. C. 2007, ApJ, 657, 511
- Allington-Smith et al. (1994) Allington-Smith, J., Breare, M., Ellis, R., Gellatly, D., Glazebrook, K., Jorden, P., Maclean, J., Oates, P., Shaw, G., Tanvir, N., Taylor, K., Taylor, P., Webster, J., & Worswick, S. 1994, PASP, 106, 983
- Bowler et al. (2009) Bowler, B. P., Liu, M. C., & Cushing, M. C. 2009, ApJ, 706, 1114
- Bowler et al. (2010a) Bowler, B. P., Liu, M. C., & Dupuy, T. J. 2010a, ApJ, 710, 45
- Bowler et al. (2010b) Bowler, B. P., Liu, M. C., Dupuy, T. J., & Cushing, M. C. 2010b, ApJ, 723, 850
- Burgasser (2004) Burgasser, A. J. 2004, ApJS, 155, 191
- Burgasser (2007) —. 2007, ApJ, 658, 617
- Burgasser et al. (2006a) Burgasser, A. J., Burrows, A., & Kirkpatrick, J. D. 2006a, ApJ, 639, 1095
- Burgasser et al. (2007) Burgasser, A. J., Cruz, K. L., & Kirkpatrick, J. D. 2007, ApJ, 657, 494
- Burgasser et al. (2006b) Burgasser, A. J., Geballe, T. R., Leggett, S. K., Kirkpatrick, J. D., & Golimowski, D. A. 2006b, ApJ, 637, 1067
- Burgasser et al. (2002) Burgasser, A. J., Kirkpatrick, J. D., Brown, M. E., Reid, I. N., Burrows, A., Liebert, J., Matthews, K., Gizis, J. E., Dahn, C. C., Monet, D. G., Cutri, R. M., & Skrutskie, M. F. 2002, ApJ, 564, 421
- Burgasser et al. (2003a) Burgasser, A. J., Kirkpatrick, J. D., Liebert, J., & Burrows, A. 2003a, ApJ, 594, 510
- Burgasser et al. (2008) Burgasser, A. J., Liu, M. C., Ireland, M. J., Cruz, K. L., & Dupuy, T. J. 2008, ApJ, 681, 579
- Burgasser et al. (2010a) Burgasser, A. J., Looper, D., & Rayner, J. T. 2010a, AJ, 139, 2448
- Burgasser et al. (2003b) Burgasser, A. J., McElwain, M. W., & Kirkpatrick, J. D. 2003b, AJ, 126, 2487
- Burgasser et al. (2004) Burgasser, A. J., McElwain, M. W., Kirkpatrick, J. D., Cruz, K. L., Tinney, C. G., & Reid, I. N. 2004, AJ, 127, 2856
- Burgasser et al. (2010b) Burgasser, A. J., Simcoe, R. A., Bochanski, J. J., Saumon, D., Mamajek, E. E., Cushing, M. C., Marley, M. S., McMurtry, C., Pipher, J. L., & Forrest, W. J. 2010b, ApJ, 725, 1405
- Burgasser et al. (1999) Burgasser, A. J., et al. 1999, ApJ, 522, L65
- Burgasser et al. (2000) —. 2000, ApJ, 531, L57
- Burningham et al. (2010a) Burningham, B., Leggett, S. K., Lucas, P. W., Pinfield, D. J., Smart, R. L., Day-Jones, A. C., Jones, H. R. A., Murray, D., Nickson, E., Tamura, M., Zhang, Z., Lodieu, N., Tinney, C. G., & Zapatero Osorio, M. R. 2010a, MNRAS, 404, 1952
- Burningham et al. (2010b) Burningham, B., Pinfield, D. J., Lucas, P. W., Leggett, S. K., Deacon, N. R., Tamura, M., Tinney, C. G., Lodieu, N., Zhang, Z. H., Huelamo, N., Jones, H. R. A., Murray, D. N., Mortlock, D. J., Patel, M., Barrado Y Navascués, D., Zapatero Osorio, M. R., Ishii, M., Kuzuhara, M., & Smart, R. L. 2010b, MNRAS, 406, 1885
- Burningham et al. (2008) Burningham, B., et al. 2008, MNRAS, 391, 320
- Burningham et al. (2009) —. 2009, MNRAS, 395, 1237
- Burrows et al. (2003) Burrows, A., Sudarsky, D., & Lunine, J. I. 2003, ApJ, 596, 587
- Chiu et al. (2006) Chiu, K., Fan, X., Leggett, S. K., Golimowski, D. A., Zheng, W., Geballe, T. R., Schneider, D. P., & Brinkmann, J. 2006, AJ, 131, 2722
- Currie et al. (2010) Currie, T., Bailey, V., Fabrycky, D., Murray-Clay, R., Rodigas, T., & Hinz, P. 2010, ApJ, 721, L177
- Currie et al. (2011) Currie, T., Burrows, A., Itoh, Y., Matsumura, S., Fukagawa, M., Apai, D., Madhusudhan, N., Hinz, P. M., Rodigas, T. J., Kasper, M., Pyo, T., & Ogino, S. 2011, ApJ, 729, 128
- Cushing et al. (2008) Cushing, M. C., Marley, M. S., Saumon, D., Kelly, B. C., Vacca, W. D., Rayner, J. T., Freedman, R. S., Lodders, K., & Roellig, T. L. 2008, ApJ, 678, 1372
- Cushing et al. (2005) Cushing, M. C., Rayner, J. T., & Vacca, W. D. 2005, ApJ, 623, 1115
- Cushing et al. (2010) Cushing, M. C., Saumon, D., & Marley, M. S. 2010, AJ, 140, 1428
- Cushing et al. (2004) Cushing, M. C., Vacca, W. D., & Rayner, J. T. 2004, PASP, 116, 362
- Delorme et al. (2008a) Delorme, P., Delfosse, X., Albert, L., Artigau, E., Forveille, T., Reylé, C., Allard, F., Homeier, D., Robin, A. C., Willott, C. J., Liu, M. C., & Dupuy, T. J. 2008a, A&A, 482, 961
- Delorme et al. (2008b) Delorme, P., Willott, C. J., Forveille, T., Delfosse, X., Reylé, C., Bertin, E., Albert, L., Artigau, E., Robin, A. C., Allard, F., Doyon, R., & Hill, G. J. 2008b, A&A, 484, 469
- Faherty et al. (2009) Faherty, J. K., Burgasser, A. J., Cruz, K. L., Shara, M. M., Walter, F. M., & Gelino, C. R. 2009, AJ, 137, 1
- Faherty et al. (2010) Faherty, J. K., Burgasser, A. J., West, A. A., Bochanski, J. J., Cruz, K. L., Shara, M. M., & Walter, F. M. 2010, AJ, 139, 176
- Geballe et al. (2002) Geballe, T. R., Knapp, G. R., Leggett, S. K., Fan, X., Golimowski, D. A., Anderson, S., Brinkmann, J., Csabai, I., Gunn, J. E., Hawley, S. L., Hennessy, G., Henry, T. J., Hill, G. J., Hindsley, R. B., Ivezić, Ž., Lupton, R. H., McDaniel, A., Munn, J. A., Narayanan, V. K., Peng, E., Pier, J. R., Rockosi, C. M., Schneider, D. P., Smith, J. A., Strauss, M. A., Tsvetanov, Z. I., Uomoto, A., York, D. G., & Zheng, W. 2002, ApJ, 564, 466
- Gelino et al. (2011) Gelino, C., et al. 2011, ApJ, submitted
- Goldman et al. (2010) Goldman, B., Marsat, S., Henning, T., Clemens, C., & Greiner, J. 2010, MNRAS, 405, 1140
- Golimowski et al. (2004) Golimowski, D. A., et al. 2004, AJ, 127, 3516
- Graff & Freese (1996) Graff, D. S., & Freese, K. 1996, ApJ, 467, L65+
- Griffith & Yelle (1999) Griffith, C. A., & Yelle, R. V. 1999, ApJ, 519, L85
- Hamuy et al. (2006) Hamuy, M., Folatelli, G., Morrell, N. I., Phillips, M. M., Suntzeff, N. B., Persson, S. E., Roth, M., Gonzalez, S., Krzeminski, W., Contreras, C., Freedman, W. L., Murphy, D. C., Madore, B. F., Wyatt, P., Maza, J., Filippenko, A. V., Li, W., & Pinto, P. A. 2006, PASP, 118, 2
- Harrington & Dahn (1980) Harrington, R. S., & Dahn, C. C. 1980, AJ, 85, 454
- Hubeny & Burrows (2007) Hubeny, I., & Burrows, A. 2007, ApJ, 669, 1248
- Janson et al. (2010) Janson, M., Bergfors, C., Goto, M., Brandner, W., & Lafrenière, D. 2010, ApJ, 710, L35
- Kalas et al. (2008) Kalas, P., Graham, J. R., Chiang, E., Fitzgerald, M. P., Clampin, M., Kite, E. S., Stapelfeldt, K., Marois, C., & Krist, J. 2008, Science, 322, 1345
- Kanneganti et al. (2009) Kanneganti, S., Park, C., Skrutskie, M. F., Wilson, J. C., Nelson, M. J., Smith, A. W., & Lam, C. R. 2009, PASP, 121, 885
- Kirkpatrick (2005) Kirkpatrick, J. D. 2005, ARA&A, 43, 195
- Kirkpatrick et al. (2006) Kirkpatrick, J. D., Barman, T. S., Burgasser, A. J., McGovern, M. R., McLean, I. S., Tinney, C. G., & Lowrance, P. J. 2006, ApJ, 639, 1120
- Kirkpatrick et al. (2008) Kirkpatrick, J. D., et al. 2008, ApJ, 689, 1295
- Knapp et al. (2004) Knapp, G. R., Leggett, S. K., Fan, X., Marley, M. S., Geballe, T. R., Golimowski, D. A., Finkbeiner, D., Gunn, J. E., Hennawi, J., Ivezić, Z., Lupton, R. H., Schlegel, D. J., Strauss, M. A., Tsvetanov, Z. I., Chiu, K., Hoversten, E. A., Glazebrook, K., Zheng, W., Hendrickson, M., Williams, C. C., Uomoto, A., Vrba, F. J., Henden, A. A., Luginbuhl, C. B., Guetter, H. H., Munn, J. A., Canzian, B., Schneider, D. P., & Brinkmann, J. 2004, AJ, 127, 3553
- Lawrence et al. (2007) Lawrence, A., et al. 2007, MNRAS, 379, 1599
- Leggett et al. (2007) Leggett, S. K., Marley, M. S., Freedman, R., Saumon, D., Liu, M. C., Geballe, T. R., Golimowski, D. A., & Stephens, D. C. 2007, ApJ, 667, 537
- Leggett et al. (2010) Leggett, S. K., Saumon, D., Burningham, B., Cushing, M. C., Marley, M. S., & Pinfield, D. J. 2010, ApJ, 720, 252
- Linsky (1969) Linsky, J. L. 1969, ApJ, 156, 989
- Liu et al. (2011) Liu, M. C., Delorme, P., Dupuy, T. J., Bowler, B. P., Albert, L., Artigau, E., Reyle, C., Forveille, T., & Delfosse, X. 2011, ArXiv e-prints
- Liu et al. (2007) Liu, M. C., Leggett, S. K., & Chiu, K. 2007, ApJ, 660, 1507
- Lodders (1999) Lodders, K. 1999, ApJ, 519, 793
- Lodders & Fegley (2002) Lodders, K., & Fegley, B. 2002, Icarus, 155, 393
- Lodieu et al. (2007) Lodieu, N., Pinfield, D. J., Leggett, S. K., Jameson, R. F., Mortlock, D. J., Warren, S. J., Burningham, B., Lucas, P. W., Chiu, K., Liu, M. C., Venemans, B. P., McMahon, R. G., Allard, F., Baraffe, I., Y Navascués, D. B., Carraro, G., Casewell, S. L., Chabrier, G., Chappelle, R. J., Clarke, F., Day-Jones, A. C., Deacon, N. R., Dobbie, P. D., Folkes, S. L., Hambly, N. C., Hewett, P. C., Hodgkin, S. T., Jones, H. R. A., Kendall, T. R., Magazzù, A., Martín, E. L., McCaughrean, M. J., Nakajima, T., Pavlenko, Y., Tamura, M., Tinney, C. G., & Zapatero Osorio, M. R. 2007, MNRAS, 379, 1423
- Loh et al. (2004) Loh, E. D., Biel, J. D., Chen, J., Davis, M., Laporte, R., & Loh, O. Y. 2004, in Society of Photo-Optical Instrumentation Engineers (SPIE) Conference Series, Vol. 5492, Society of Photo-Optical Instrumentation Engineers (SPIE) Conference Series, ed. A. F. M. Moorwood & M. Iye, 1644–1652
- Looper et al. (2007) Looper, D. L., Kirkpatrick, J. D., & Burgasser, A. J. 2007, AJ, 134, 1162
- Looper et al. (2008) Looper, D. L., Kirkpatrick, J. D., Cutri, R. M., Barman, T., Burgasser, A. J., Cushing, M. C., Roellig, T., McGovern, M. R., McLean, I. S., Rice, E., Swift, B. J., & Schurr, S. D. 2008, ApJ, 686, 528
- Lucas et al. (2001) Lucas, P. W., Roche, P. F., Allard, F., & Hauschildt, P. H. 2001, MNRAS, 326, 695
- Lucas et al. (2010) Lucas, P. W., Tinney, C. G., Burningham, B., Leggett, S. K., Pinfield, D. J., Smart, R., Jones, H. R. A., Marocco, F., Barber, R. J., Yurchenko, S. N., Tennyson, J., Ishii, M., Tamura, M., Day-Jones, A. C., Adamson, A., Allard, F., & Homeier, D. 2010, MNRAS, 408, L56
- Luhman et al. (2011) Luhman, K. L., Burgasser, A. J., & Bochanski, J. J. 2011, ApJ, 730, L9+
- Madhusudhan et al. (2011) Madhusudhan, N., Burrows, A., & Currie, T. 2011, ArXiv e-prints
- Mainzer et al. (2011) Mainzer, A., Cushing, M. C., Skrutskie, M., Gelino, C. R., Kirkpatrick, J. D., Jarrett, T., Masci, F., Marley, M. S., Saumon, D., Wright, E., Beaton, R., Dietrich, M., Eisenhardt, P., Garnavich, P., Kuhn, O., Leisawitz, D., Marsh, K., McLean, I., Padgett, D., & Rueff, K. 2011, ApJ, 726, 30
- Marley et al. (2002) Marley, M. S., Seager, S., Saumon, D., Lodders, K., Ackerman, A. S., Freedman, R. S., & Fan, X. 2002, ApJ, 568, 335
- Marocco et al. (2010) Marocco, F., Smart, R. L., Jones, H. R. A., Burningham, B., Lattanzi, M. G., Leggett, S. K., Lucas, P. W., Tinney, C. G., Adamson, A., Evans, D. W., Lodieu, N., Murray, D. N., Pinfield, D. J., & Tamura, M. 2010, A&A, 524, A38+
- Marois et al. (2008) Marois, C., Macintosh, B., Barman, T., Zuckerman, B., Song, I., Patience, J., Lafrenière, D., & Doyon, R. 2008, Science, 322, 1348
- Metchev & Hillenbrand (2006) Metchev, S. A., & Hillenbrand, L. A. 2006, ApJ, 651, 1166
- Nakajima et al. (1995) Nakajima, T., Oppenheimer, B. R., Kulkarni, S. R., Golimowski, D. A., Matthews, K., & Durrance, S. T. 1995, Nature, 378, 463
- Oke et al. (1995) Oke, J. B., Cohen, J. G., Carr, M., Cromer, J., Dingizian, A., Harris, F. H., Labrecque, S., Lucinio, R., Schaal, W., Epps, H., & Miller, J. 1995, PASP, 107, 375
- Oppenheimer et al. (1995) Oppenheimer, B. R., Kulkarni, S. R., Matthews, K., & Nakajima, T. 1995, Science, 270, 1478
- Oppenheimer et al. (1998) Oppenheimer, B. R., Kulkarni, S. R., Matthews, K., & van Kerkwijk, M. H. 1998, ApJ, 502, 932
- Perryman et al. (1997) Perryman, M. A. C., Lindegren, L., Kovalevsky, J., Hoeg, E., Bastian, U., Bernacca, P. L., Crézé, M., Donati, F., Grenon, M., van Leeuwen, F., van der Marel, H., Mignard, F., Murray, C. A., Le Poole, R. S., Schrijver, H., Turon, C., Arenou, F., Froeschlé, M., & Petersen, C. S. 1997, A&A, 323, L49
- Rayner et al. (2003) Rayner, J. T., Toomey, D. W., Onaka, P. M., Denault, A. J., Stahlberger, W. E., Vacca, W. D., Cushing, M. C., & Wang, S. 2003, PASP, 115, 362
- Reylé et al. (2010) Reylé, C., Delorme, P., Willott, C. J., Albert, L., Delfosse, X., Forveille, T., Artigau, É., Malo, L., Hill, G. J., & Doyon, R. 2010, A&A, 522, A112+
- Saumon et al. (1994) Saumon, D., Bergeron, P., Lunine, J. I., Hubbard, W. B., & Burrows, A. 1994, ApJ, 424, 333
- Saumon & Marley (2008) Saumon, D., & Marley, M. S. 2008, ApJ, 689, 1327
- Saumon et al. (2006) Saumon, D., Marley, M. S., Cushing, M. C., Leggett, S. K., Roellig, T. L., Lodders, K., & Freedman, R. S. 2006, ApJ, 647, 552
- Scholz (2010a) Scholz, R. 2010a, A&A, 515, A92+
- Scholz (2010b) —. 2010b, A&A, 510, L8+
- Simcoe et al. (2008) Simcoe, R. A., Burgasser, A. J., Bernstein, R. A., Bigelow, B. C., Fishner, J., Forrest, W. J., McMurtry, C., Pipher, J. L., Schechter, P. L., & Smith, M. 2008, in Society of Photo-Optical Instrumentation Engineers (SPIE) Conference Series, Vol. 7014, Society of Photo-Optical Instrumentation Engineers (SPIE) Conference Series
- Simcoe et al. (2010) Simcoe, R. A., Burgasser, A. J., Bochanski, J. J., Schechter, P. L., Bernstein, R. A., Bigelow, B. C., Pipher, J. L., Forrest, W., McMurtry, C., Smith, M. J., & Fishner, J. 2010, in Society of Photo-Optical Instrumentation Engineers (SPIE) Conference Series, Vol. 7735, Society of Photo-Optical Instrumentation Engineers (SPIE) Conference Series
- Simons & Tokunaga (2002) Simons, D. A., & Tokunaga, A. 2002, PASP, 114, 169
- Skrutskie et al. (2006) Skrutskie, M. F., et al. 2006, AJ, 131, 1163
- Stephens et al. (2009) Stephens, D. C., Leggett, S. K., Cushing, M. C., Marley, M. S., Saumon, D., Geballe, T. R., Golimowski, D. A., Fan, X., & Noll, K. S. 2009, ApJ, 702, 154
- Strauss et al. (1999) Strauss, M. A., et al. 1999, ApJ, 522, L61
- Tinney et al. (2003) Tinney, C. G., Burgasser, A. J., & Kirkpatrick, J. D. 2003, AJ, 126, 975
- Tinney et al. (2005) Tinney, C. G., Burgasser, A. J., Kirkpatrick, J. D., & McElwain, M. W. 2005, AJ, 130, 2326
- Tinney et al. (2004) Tinney, C. G., Ryder, S. D., Ellis, S. C., Churilov, V., Dawson, J., Smith, G. A., Waller, L., Whittard, J. D., Haynes, R., Lankshear, A., Barton, J. R., Evans, C. J., Shortridge, K., Farrell, T., & Bailey, J. 2004, in Society of Photo-Optical Instrumentation Engineers (SPIE) Conference Series, Vol. 5492, Society of Photo-Optical Instrumentation Engineers (SPIE) Conference Series, ed. A. F. M. Moorwood & M. Iye, 998–1009
- Tody (1986) Tody, D. 1986, in Society of Photo-Optical Instrumentation Engineers (SPIE) Conference Series, Vol. 627, Society of Photo-Optical Instrumentation Engineers (SPIE) Conference Series, ed. D. L. Crawford, 733–+
- Tokunaga et al. (2002) Tokunaga, A. T., Simons, D. A., & Vacca, W. D. 2002, PASP, 114, 180
- Vacca et al. (2003) Vacca, W. D., Cushing, M. C., & Rayner, J. T. 2003, PASP, 115, 389
- Vrba et al. (2004) Vrba, F. J., Henden, A. A., Luginbuhl, C. B., Guetter, H. H., Munn, J. A., Canzian, B., Burgasser, A. J., Kirkpatrick, J. D., Fan, X., Geballe, T. R., Golimowski, D. A., Knapp, G. R., Leggett, S. K., Schneider, D. P., & Brinkmann, J. 2004, AJ, 127, 2948
- Warren et al. (2007) Warren, S. J., et al. 2007, MNRAS, 381, 1400
- Whitworth & Stamatellos (2006) Whitworth, A. P., & Stamatellos, D. 2006, A&A, 458, 817
- Wilson et al. (2003) Wilson, J. C., Eikenberry, S. S., Henderson, C. P., Hayward, T. L., Carson, J. C., Pirger, B., Barry, D. J., Brandl, B. R., Houck, J. R., Fitzgerald, G. J., & Stolberg, T. M. 2003, in Society of Photo-Optical Instrumentation Engineers (SPIE) Conference Series, Vol. 4841, Society of Photo-Optical Instrumentation Engineers (SPIE) Conference Series, ed. M. Iye & A. F. M. Moorwood, 451–458
- Wright et al. (2010) Wright, E. L., Eisenhardt, P. R. M., Mainzer, A. K., Ressler, M. E., Cutri, R. M., Jarrett, T., Kirkpatrick, J. D., Padgett, D., McMillan, R. S., Skrutskie, M., Stanford, S. A., Cohen, M., Walker, R. G., Mather, J. C., Leisawitz, D., Gautier, T. N., McLean, I., Benford, D., Lonsdale, C. J., Blain, A., Mendez, B., Irace, W. R., Duval, V., Liu, F., Royer, D., Heinrichsen, I., Howard, J., Shannon, M., Kendall, M., Walsh, A. L., Larsen, M., Cardon, J. G., Schick, S., Schwalm, M., Abid, M., Fabinsky, B., Naes, L., & Tsai, C. 2010, AJ, 140, 1868
- York et al. (2000) York, D. G., et al. 2000, AJ, 120, 1579
- Zacharias et al. (2010) Zacharias, N., Finch, C., Girard, T., Hambly, N., Wycoff, G., Zacharias, M. I., Castillo, D., Corbin, T., DiVittorio, M., Dutta, S., Gaume, R., Gauss, S., Germain, M., Hall, D., Hartkopf, W., Hsu, D., Holdenried, E., Makarov, V., Martinez, M., Mason, B., Monet, D., Rafferty, T., Rhodes, A., Siemers, T., Smith, D., Tilleman, T., Urban, S., Wieder, G., Winter, L., & Young, A. 2010, AJ, 139, 2184
- Zuckerman et al. (2004) Zuckerman, B., Song, I., & Bessell, M. S. 2004, ApJ, 613, L65
- Zuckerman et al. (2001) Zuckerman, B., Song, I., & Webb, R. A. 2001, ApJ, 559, 388