A Correlation Between the Ionization State of the Inner Accretion Disk and the Eddington Ratio of Active Galactic Nuclei
Abstract
X-ray reflection features observed from the innermost regions of accretion disks in Active Galactic Nuclei (AGNs) allow important tests of accretion theory. In recent years it has been possible to use the Fe K line and reflection continuum to parametrize the ionization state of the irradiated inner accretion disk. Here, we collect 10 measurements of , the disk ionization parameter, from 8 AGNs with strong evidence for reflection from the inner accretion disk and good black hole mass estimates. We find strong statistical evidence (% confidence) for a nearly linear correlation between and the AGN Eddington ratio. Moreover, such a correlation is predicted by a simple application of -disk accretion theory, albeit with a stronger dependence on the Eddington ratio. The theory shows that there will be intrinsic scatter to any correlation as a result of different black hole spins and radii of reflection. There are several possibilities to soften the predicted dependence on the Eddington ratio to allow a closer agreement with the observed correlation, but the current data does not allow for an unique explanation. The correlation can be used to estimate that MCG–6-30-15 should have a highly ionized inner accretion disk, which would imply a black hole spin of . Additional measurements of from a larger sample of AGNs are needed to confirm the existence of this correlation, and will allow investigation of the accretion disk/corona interaction in the inner regions of accretion disks.
1 Introduction
It has been decades since it was realized that active galactic nuclei (AGNs) must be powered by accretion onto supermassive black holes (Lynden-Bell, 1969; Rees, 1984). Yet, while our theoretical understanding of the underlying physics of accretion disks has evolved tremendously over that time (e.g., Novikov & Thorne, 1973; Shakura & Sunyaev, 1973; Pringle, 1981; Balbus & Hawley, 1998; Balbus, 2003; Hirose et al., 2009), there are few direct measurements of the properties of AGN accretion disks that can be used to test the theories. The difficulty in detecting AGN accretion disks observationally arises naturally: they emit most of their radiation in the ultraviolet and optical, which can be easily absorbed and reprocessed by surrounding material and must also be separated from the starlight from the surrounding galaxy. When estimates of the disk continuum have been observationally determined (typically from the outer part of the disk) they indicate broad agreement with the concept that the accretion disk is an optically thick, thermal emitter with a radially dependent temperature profile (e.g., Kishimoto et al., 2005, 2008). However, the few probes of the accretion disk emission from close to the black hole show signs of significant discrepancies with the theoretical expectation111This should be contrasted with the situation for accretions disks around stellar-mass black holes, whose continuum is emitted at X-ray energies and is, in general, well matched by the theoretical predictions (e.g., Davis et al., 2006). However, stellar mass black holes also present several phenomenological problems (e.g., QPOs) that are yet to be fully explained by accretion theory (see, e.g., Johannsen & Psaltis 2011 and references therein). (e.g., Koratkar & Blaes, 1999; Davis et al., 2007; Morgan et al., 2010). Accretion disk theory also predicts specific changes in the flow properties (e.g., density, temperature) as a function of black hole mass and accretion rate (Shakura & Sunyaev, 1973), but there are currently very few observational tests of these predictions of the theory (e.g., Bonning et al., 2007; Davis et al., 2007; Morgan et al., 2010; Davis & Laor, 2011).
A direct probe of the inner accretion disks of AGNs is through the X-ray emission. All AGNs emit a fraction of their bolometric energy as a hard X-ray power-law (e.g., Mushotzky et al., 1993; Vasudevan & Fabian, 2007). The X-rays are thought to originate in a hot and tenuous magnetically dominated corona that sits above the surface of the disk (Galeev et al., 1979; Haardt & Maraschi, 1991, 1993; Haardt et al., 1994). Studies of this X-ray emission by generations of X-ray observatories discovered that in many AGNs there are spectral features superimposed on the power-law that could be easily explained as reprocessing of the X-rays in nearby cold, dense material (Pounds et al., 1990; Nandra & Pounds, 1994). The strongest of these ‘X-ray reflection’ features are the Fe K emission line at 6.4 keV, the associated Fe K absorption edge at 7.1 keV, and an overall hardening of the spectrum at high energies due to electron scattering of the X-ray photons (Lightman & White, 1988; Guilbert & Rees, 1988; George & Fabian, 1991; Matt et al., 1991). As the inner accretion disk likely subtends a large solid angle as seen from the X-ray source, it may dominate the X-ray reflection spectrum, although, depending on the source, contributions can arise from distant material such as the broad line region, the dusty absorber or the outer accretion disk (Nandra, 2006; Shu et al., 2010). High signal-to-noise X-ray spectral observations of some AGNs find a broadened, asymmetric Fe K line. The shape of this line is strong evidence that the reflecting material is close to the black hole and subject to strong relativistic effects (Tanaka et al., 1995; Fabian et al., 2002; Miller, 2007). Thus, the reflection spectra in these AGNs can probe physical properties of the inner accretion disk that would otherwise be extremely difficult to investigate by consideration of the disk continuum. The highly penetrating X-ray emission can be studied for nearly all AGNs and with very little contamination from the host galaxy. The only difficulty is to identify and model the component of the reflection spectrum that arises from the inner disk, as this will often be a very weak and low contrast feature in the total spectrum (Nandra et al., 2007; Ballantyne, 2010; de la Calle Pérez et al., 2010).
Once identified, the reflection spectrum from the inner accretion disk can constrain the iron abundance of the accreting gas (Ballantyne et al., 2002), the vertical density structure (Nayakshin et al., 2000; Ballantyne et al., 2001b, 2004), and its ionization state, which is the focus of the current paper. The spectral features imprinted on the reflection spectrum are a strong function of the ionization state of the illuminated gas (e.g., Ross & Fabian, 1993; Ross et al., 1999; Ross & Fabian, 2005; García & Kallman, 2010). In particular, the Fe K line transitions from a rest energy of 6.4 keV to 6.7 keV and then to 6.97 keV as the iron ions become progressively more ionized. In addition, the Fe K absorption edge moves to higher energies and Comptonization broadens out the natural width of the spectral features. The ionization of lower Z elements also tends to flatten out the reflection spectrum (Ross & Fabian, 2005; García & Kallman, 2010). All these effects are potentially observable in high quality X-ray spectral data. Indeed, evidence for ionization of the disk surface has been identified in the X-ray spectra of several AGNs (e.g., Ballantyne et al., 2001a; Fabian et al., 2004; Longinotti et al., 2007; Brenneman & Reynolds, 2009; Nardini et al., 2011).
The photoionization of the surface of the inner accretion disk by the X-ray emitting corona can be parametrized by an ionization parameter, , where is the incident X-ray flux and is the hydrogen number density of the disk surface. A measurement of can therefore provide information on the density structure of the disk and/or the illuminating conditions provided by the corona. Models of coronal generation predict that the amount of accretion energy dissipated in the corona may be a function of the accretion rate (Stella & Rosner, 1984; Merloni & Fabian, 2002; Blackman & Pessah, 2009), and observations show that the fraction of the bolometric luminosity released by an AGN in the X-ray band decreases with increasing Eddington ratio (e.g., Wang et al., 2004; Vasudevan & Fabian, 2007). These two results imply there should be a dependence of on the accretion rate (cf., Ballantyne & Ross, 2002), which, if measured, can test how the density structure and corona power varies with accretion rate. Earlier work by Inoue et al. (2007) indicated that increases with accretion rate, but those authors were unable to fit the X-ray data with ionized reflection models to measure at various Eddington ratios.
In this paper we measure the dependence of on AGN accretion rate by compiling the best available results from the literature. The sources were selected to have clear evidence of reflection from the inner accretion disk and robust black hole mass estimates. The next section describes the source selection in detail and presents the results of our experiment which are then discussed in the context of accretion and coronal models in Section 3. Our conclusions our summarized in Section 4.
2 Source Selection and Results
The literature was searched to find the best available observationally determined values of . Sources selected for analysis must pass two criteria: first, the central black hole mass must be estimated either from reverberation mapping, or, if the radius-luminosity relationship (e.g., Kaspi et al., 2005) is used, a careful decomposition of the H line must be performed to obtain an estimate of the virial motion of the broad-line region (BLR) gas. Second, the X-ray spectrum of the object must have strong evidence of reflection from the inner accretion disk (within , where is the gravitational radius of a black hole with mass ) in the form of a broad Fe K line. AGNs where relativistic effects are not needed to describe the line profile are not included for analysis. These two requirements severely restricts the number of possible AGNs that can be included in the sample, but the objects that are included will provide the cleanest test of any relationship between and the Eddington ratio with a minimal amount of observational scatter. Finally, the AGNs must have a measurement of from fitting a relativistically blurred ionized reflection spectrum to the Fe K line and continuum. For consistency, this must be estimated from the ‘reflionx’ model (Ross & Fabian, 2005). After searching through the literature, it was found that 10 observations of 8 different AGNs satisfied the above criteria222Objects with relativistic Fe K lines that failed to make the list because of an uncertain black hole mass include MCG–6-30-15, IRAS 13224-3809, 1H 0707-495 and Swift J2127.4+5654. Radio-loud AGNs with reverberation mapped black hole masses such as 3C 120, 3C 273 and 3C 390.3 were also not included to eliminate confusion due to emission from the relativistic jet. (see Table 1). The – keV bolometric corrections, , are found from the measurements of Vasudevan & Fabian (2009), or, for three of the objects, are estimated by using the observed relationship between and photon index (Zhou & Zhao, 2010).
Figure 1 plots versus the Eddington ratio for the objects listed in Table 1, and shows a clear correlation between the two parameters (the simple linear correlation coefficient is ). The Spearman rank correlation coefficient is and gives a -value of , which corresponds to a % confidence level for 8 degrees of freedom. Thus, the observed correlation has strong statistical significance. However, the detection of the correlation depends on only three objects with , and, as seen in Table 1, those AGNs have only estimates of the bolometric correction. Removing those three objects from the sample eliminates the correlation (); it is therefore crucial to obtain better measurements of bolometric corrections for high accretion rate AGNs in order to confirm the existence of the relationship between and .
To estimate the functional relationship between these quantities, we follow the advice of Isobe et al. (1990) who recommend the ordinary least-squares bisector method. This calculation finds the following, nearly linear, relationship between and the Eddington ratio:
| (1) |
This fit is shown as the dashed line in Fig. 1, and is formally consistent with the slope () and intercept () calculated from a simple least-squares fit. If the observed errors in are included than this line gives a reduced ; this can be reduced to if all the errors in are increased to . However, as discussed below, substantial scatter in this relationship is likely to arise naturally, so a reduced would not be expected.
3 Discussion
3.1 Physical Interpretation
Figure 1 clearly shows that AGNs that are accreting at larger fractions of their Eddington rate exhibit more ionized inner accretion disks. As mention in Sect. 1, such a relationship might be expected depending on how accretion energy is dissipated in the corona at different accretion rates. In this Section, we use simple -disk accretion theory to explore the possible physical origins of this observed relationship.
As the measurements were all chosen to arise from the innermost regions of the accretion disk, radiation pressure will likely dominate the support of the accretion flow. Likewise, relativistic effects will also be non-negligible. Finally, it will also be necessary to include the effects of a non-zero (and potentially variable) fraction of accretion energy dissipated in the corona, . The ionization parameter can be approximated as , where is the mass of a proton, is the total X-ray luminosity incident on the accretion disk which has a gas density , and is the distance from the X-ray source in the corona to the reflecting region of the disk. As there is no complete understanding of the structure of the corona close to the black hole, for simplicity we will assume a geometrically thick corona so that , where is the radial distance along the disk. Theoretical arguments by Blackman & Pessah (2009) show that the survival of a magnetically dominated corona will require large scale magnetic fields, so a thick corona above the inner disk may not be unrealistic (see also Merloni & Fabian 2001). With this assumption, Appendix A shows that for a radiation pressure supported disk,
| (2) |
where is the radiative efficiency of the disk, is the viscosity parameter (Shakura & Sunyaev, 1973), and encompasses the general relativistic effects and are dimensionless functions of , the dimensionless black hole spin, and (e.g., Novikov & Thorne, 1973). This estimation of is nicely independent of the central black hole mass. Initially, we assume constant values of and (Davis & Laor, 2011), so a model curve of versus can be described by only three parameters: , and .
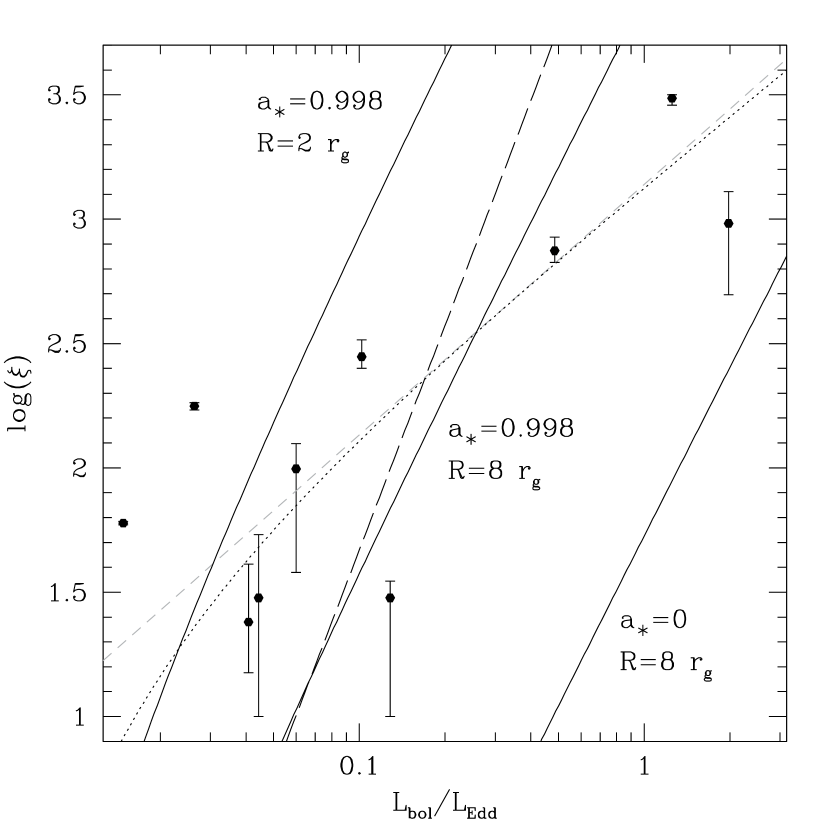
Figure 2 plots several models calculated from equation 2 and compares them against the data and the least-squares bisector fit from Fig. 1. There are three sets of curves for three different , pairs. As described in detail below, the solid lines and the long dashed line differ in the treatment of . Fig. 2 is remarkable in that the simple -disk model of Eq. 2 predicts reasonable values of for realistic values of the parameters; there is no reason for this to be expected a priori. This basic level of agreement provides confidence that Eq. 2 can be used to explore the physical reasons behind the observed correlation between and .
There can be a wide range of expected values of for a given value of depending on the value of the black hole spin and the radius which dominates the reflection signal. As these values will likely vary from object to object, and the latter may vary from observation to observation, a fair amount of natural scatter will occur in the observed relationship. In fact, this scatter may be a significant contribution to the observed slope of the relationship; however, the scatter is not so significant as to destroy the correlation. This fact argues that AGNs within this range of Eddington ratios are not uniformly distributed over and , but are confined to a relatively small range in these parameters. Clearly, more ionized reflection fits in a wider range of AGNs is needed to better understand the intrinsic scatter in this relationship.
Vasudevan & Fabian (2007) make use of their measured AGN X-ray bolometric corrections to estimate that the coronal fraction for low Eddington rate AGNs. The long dashed line in Fig. 2 shows the predicted – relationship from eq. 2 for this value of when and . This line has a slope of , as predicted from eq. 2, much steeper than the measured slope of (eq. 1). However, Vasudevan & Fabian (2007) also found that is lower for high Eddington ratio sources, dropping to . The anti-correlation of with Eddington ratio is a natural consequence of the well established diminishing of relative X-ray power in high luminosity quasars (e.g., Steffen et al., 2006). Models of accretion disk corona predict different dependencies of on the Eddington ratio, with Wang et al. (2004) providing a comparison with observational estimates. The steepest dependence of with is provided by the model of Stella & Rosner (1984) which finds . Inserting this dependence into eq. 2, and normalizing so that at , yields the solid lines in figure 2 which have slopes of , still significantly steeper than the observed slope.
Although the intrinsic scatter is likely to contribute to the mismatch between the observed and predicted slope, it is interesting to consider what other physical mechanisms may be operating that can bring the model closer to the observed correlation. There are numerous possibilities, but, as outlined below, not all are likely physical reasonable.
3.1.1 Coronal Fraction
If then the slope of the model is approximately equal to the observed one. However, this dependence is so strong that, if normalized to at , drops to 1% at an Eddington ratio of only 0.07. Such a strong dependence of would be very difficult to reconcile with the observed X-ray luminosities of luminous quasars.
3.1.2 Gas Density
Perhaps the simplest change to the model is to alter the gas density of the disk. The value of used in calculating is an approximate, vertically-averaged value of the gas density, and may not be entirely accurate for the outer layers of the disk that is being illuminated by the X-rays. Furthermore, the X-ray heating may cause the disk scale height to increase and thus decreasing the density (e.g., Nayakshin et al., 2000; Ballantyne et al., 2001b). As there is more accretion power emitted as X-rays at low Eddington ratios, then its plausible that this density correction could be dependent on . The dotted line in figure 2 shows the , model after reducing the density with a factor that varies as . The reduction in density ranges by a factor of at to for an Eddington ratio of unity.
There are problems with this solution, however. First, it can most easily be applied to low spin black holes. Higher spin black holes, such as the models plotted in figure 2 would require a denser disk at high Eddington ratios to bring the model into agreement with the data. In addition, reflection calculations of disks which do adjust into hydrostatic balance and have low density surfaces predict that ionized Fe K lines are common (Ballantyne & Ross, 2002) unless the disk is very weakly illuminated. It is not clear that this is consistent with the observed variation in coronal fractions, where more accretion power is dissipated in the corona at low Eddington ratios and the ionization parameter is observed to be small. Both these problems may be mitigated if processes within the disk (e.g., photon bubble or Parker instabilities) transported denser material to the surface (Ballantyne et al., 2004; Blaes et al., 2007). More simulations investigating the density structure of accretion disk photospheres are needed to quantify the possible corrections to the disk densities.
3.1.3 Radiative Efficiency
According to equation 2, , so if the radiative efficiency of accretion disks was proportional then, after including the effects of the variable , the slope of the model would be more in line with the observed correlation. Of course, is a measure of the total binding energy available to be radiated away in the accretion flow and thus depends on the black hole spin and the innermost radius of the disk (e.g., Krolik, 1999). The maximal values of are limited to be 0.31 (0.038) for maximally spinning black holes that are co-rotating (counter-rotating) with respect to their accretion disks [see Davis & Laor (2011) and references therein]. Additional physics can alter these expectations, however; for example, magnetohydrodynmical effects may provide an extra torque to the gas within the traditional innermost stable orbit and increase the efficiency above the theoretical upper-limit (e.g., Agol & Krolik, 2000). Alternatively, accretion energy may be advected inwards or used to drive outflows which can reduce the efficiency. Observationally, arguments based on the work of Soltan (1982) have shown that the average efficiency of accreting black holes over their accretion history is (e.g., Yu & Tremaine, 2002; Elvis et al., 2002; Marconi et al., 2004; Barger et al., 2005). Recently, Davis & Laor (2011) estimated for 80 PG quasars and found an average value of (with a wide scatter) and no strong correlation with the Eddington ratio. Indeed, implementing the dependence into equation 2 finds that it can only hold over a factor of in Eddington ratio before reaching the theoretical limits.
Interestingly, Davis & Laor (2011) find a positive correlation between and black hole mass, . Thus, an alternative way to reduce the slope of the – relationship is with . Again, such a strong relationship is not observed (Kollmeier, 2006; Steinhardt & Elvis, 2010; Davis & Laor, 2011), nor is it even hinted at with the data in Table 1 where only a slight negative correlation is possible ().
3.1.4 Disk Viscosity
The models shown in fig. 2 assume a constant , but the slope of the predicted relationship could be reduced to if . Observational estimates of typically find (e.g., King et al., 2007), but numerical simulations of accretion flows typically find values an order of magnitude lower (e.g., Davis et al., 2010). The strong relationship between and the Eddington ratio required to account for the observed – relationship results in either a large fraction of low Eddington AGNs with , or that most rapidly accreting AGN have . As the parameter is at best a parametrization of our ignorance of the accretion process, it is difficult to assess the validity of such a relationship between and accretion rate without guidance from simulations that explore disk viscosity as a function of .
3.1.5 Black Hole Spin
Figure 2 shows that the black hole spin has an important impact on the predicted values of , and that the slope of the predicted curves could be reduced if was a decreasing function of , an idea that has some theoretical justification. In particular, some models of black hole growth predict that only the largest black holes that have stopped rapidly accreting have developed high spins, while the lowest mass black holes which may still undergo rapid accretion will generally have low values of (e.g., Fanidakis et al., 2011). That is, the high Eddington ratio AGNs would be lower mass black holes with small spins, and the low Eddington ratio AGNs would be high mass black holes with large spins. This scenario is also a possible explanation for the correlation between and black hole mass found by Davis & Laor (2011). Although the objects in our sample do not present strong evidence for a correlation between black hole mass and Eddington ratio, we assumed that and searched for an that could reduce the predicted slope to match the observations. The minimum slope found was for and a reflecting radius very close to the innermost stable circular orbit. Thus, a dependence of spin with Eddington ratio cannot, on its own, reproduce the observed correlation between and .
3.1.6 Other Options
There are other physical effects neglected in equation 2 that could influence the observed . For example, if the X-ray source is close to the black hole, gravitational light bending (e.g., Miniutti & Fabian, 2004) will increase the irradiation of the disk and thus increase . If this was more common, or more effective, at smaller (as might be expected given the larger values of ), then this effect could reduce the slope of the model to be closer to the observed value. However, if the disk is more highly illuminated than this would also increase the strength of the reflection spectrum and increase the equivalent width (EW) of the broad Fe K lines. Iron lines with large (i.e., several hundred eV) EWs are rare in Seyfert galaxies (Nandra et al., 2007; de la Calle Pérez et al., 2010) which argues that strong light bending is not a common phenomenon (see also Ballantyne 2010). Alternatively, it is possible some fraction of the accretion energy dissipated in the corona is used to drive an outflow (e.g., Merloni & Fabian, 2002). This would have two important effects for the predicted value of : first, this would reduce the energy available to illuminate the accretion disk, and, second, the X-rays emitting region may be moving rapidly away from or toward the disk and thus significantly decrease or increase the irradiating flux (Beloborodov, 1999). As is likely to depend on Eddington ratio, then it is certainly plausible that such effects may also be stronger over a certain range of . More generally, it is possible (perhaps likely) that all of the effects considered in this section are in play at some level in real AGNs. Measurements of from the inner regions of accretion disk are needed from several more AGNs with reverberation mapped black hole masses to further explore the nature of this correlation.
3.2 Application to MCG–6-30-15
One potentially important application of this correlation is that it may help distinguish between two competing interpretations of an observed X-ray spectrum. For example, MCG–6-30-15 exhibits one of the broadest and strongest Fe K lines ever observed and has been analyzed many times since the line was first detected by ASCA (e.g., Tanaka et al., 1995; Ballantyne & Fabian, 2001; Wilms et al., 2001; Fabian et al., 2002; Ballantyne et al., 2003; Reynolds et al., 2004; Brenneman & Reynolds, 2006; Miniutti et al., 2007). When modeled as one powerful relativistic line, reflection fits to the spectra of MCG–6-30-15 yield and require a large iron abundance (e.g., Brenneman & Reynolds, 2006; Miniutti et al., 2007). However, equally good fits to the spectra can be found if the red wing of the line arises from highly ionized Fe close to the black hole and the neutral 6.4 keV core arises from much larger distances on the disk (Ballantyne & Fabian, 2001; Ballantyne et al., 2003; Reynolds et al., 2004). None of the AGNs in Table 1 show evidence for a strong second reflector from the accretion disk that could bias the measurement of the ionization parameter and the resulting correlation. Thus, this degeneracy is unlikely to be common, but, given the importance of MCG–6-30-15 to the field, it is interesting to use the correlation observed in Fig. 1 to provide additional information on the likely ionization state of the MCG–6-30-15 accretion disk.
Unfortunately, the black hole mass of this source is not well constrained with a current best estimate of M⊙ (McHardy et al., 2005). The flux of MCG–6-30-15 when it was observed in a deep minimum state ( erg cm-2 s-1; Wilms et al. 2001) is used to estimate a lower limit to . As there is no direct measurement of , we utilize the photon index of MCG–6-30-15 in the deep minimum state (; Reynolds et al. 2004) and again make use of the correlation between and described by Zhou & Zhao (2010) which results in . Combining these measurements results in which when inserted into Eq. 1, and taking the extremal values of the slope and intercept, yields . This lower limit suggests that the accretion disk of MCG–6-30-15 is most likely to be significantly ionized.
Interestingly, when the broad Fe K line of MCG–6-30-15 is fit by a highly ionized reflector, the ionization parameter is usually (Ballantyne et al., 2003; Reynolds et al., 2004), and such a highly ionized line is naturally broader due to Comptonization (e.g., Ross et al., 1999). Thus, an ionized accretion disk in MCG–6-30-15 would reduce the value of required to explain the width of the Fe K line (e.g., Reynolds et al., 2004; Brenneman & Reynolds, 2006). However, the fits of Ballantyne et al. (2003) found that the ionized reflector was constrained to a radius of , and therefore a non-zero black hole spin will be necessary. We can be more quantitative by combining the measured and from spectral fits with the predicted – correlation. An ionization parameter of would be larger than expected for the correlation seen in Fig. 1, but scatter due to the various values of and will bring objects above that line. According to Equation 2, if at for Eddington ratios (Miniutti et al., 2007), then . Thus, a rapidly spinning black hole is still necessary for MCG–6-30-15, but a very large value is not required if the inner disk is ionized.
4 Conclusions
In this paper we have presented evidence from the literature that the ionization state of the inner accretion disk in AGNs is correlated with the Eddington ratio of the accretion flow. Very conservative criteria were employed to select the data from the literature; namely, there must be strong evidence for reflection from within , the reflection spectrum must have been fit with the latest ionized disk models, and there must be a high quality estimate of the central black hole mass. Despite these steps, the correlation relies on estimates of the X-ray bolometric corrections for the high Eddington rate sources. Therefore, precise and accurate measurements of bolometric corrections (especially of rapidly accreting AGNs) are needed to both confirm the existence of this correlation and to better define its intrinsic scatter.
The existence of a relationship between and is predicted by simple disk accretion theory, although with a slope that is steeper than what is observed. It is not possible to determine an unique explanation that can bring the two slopes into agreement, although a Eddington ratio dependent decrease in the disk density (possibly related to the changing coronal power) presents the simplest possibility. If the correlation can be better defined by future observations than it may lead to insight into the physics of the energy flow between the disk and X-ray emitting corona.
Finally, we showed that the – correlation will also be useful in distinguishing between different interpretations of AGN X-ray spectra. As an example, given the current estimate of the black hole mass of MCG–6-30-15, the correlation predicts that the accretion disk of MCG–6-30-15 should be significantly ionized with . This result provides evidence that the strong line observed from this object may arise from two distinct reflecting regions with different ionization states, rather than one low- area with a very high Fe abundance. The high values of measured in this interpretation require , reducing the value of the spin necessary to explain the width of the red wing.
Appendix A The Ionization Parameter in a Radiation Pressure Dominated Disk
To estimate the ionization parameter of an accretion disk illuminated at a radius by a X-ray luminosity , we re-write as , assume (see Sect. 3.1), and use the density of a radiation pressure dominated disk provided by (Krolik, 1999):
| (A1) |
where the correction due to a non-zero coronal dissipation fraction has been included from the results of Svennson & Zdziarski (1994). The relativistic corrections are simple, but lengthy, analytic functions of , the dimensionless black hole spin, and the disk radius and can be found elsewhere (e.g., Krolik, 1999).
Finally, it is assumed that that the X-ray luminosity is powered entirely by the fraction of the accretion energy that is dissipated in the corona; i.e., . That is, none of the coronal energy is used to launch an outflow or jet, which is a reasonable assumption given the relatively high Eddington ratios of the objects making up the sample (e.g., Merloni & Fabian, 2002). Combining this assumption with eq. A1 yields equation 2.
Appendix B The Ionization Parameter in a Gas Pressure Dominated Disk with Electron Scattering Opacity
Although not likely applicable to the inner disk reflection observed in the AGNs considered here, for completeness we also derive an estimate for for the case of an illuminated gas pressure dominated disk (with electron scattering opacity). In this case, the gas density is (Krolik, 1999):
| (B1) |
where again the correction due to dissipation in the corona was taken from the work of Svennson & Zdziarski (1994). Then, with the same approximation as before for the production of the ionizing X-rays (i.e., ), the ionization parameter is:
| (B2) |
The high density of a gas pressure dominated disk predicts a very low for supermassive black holes, and with a much slower dependence on the Eddington ratio than the radiation pressure dominated disk.
References
- Agol & Krolik (2000) Agol, E. & Krolik, J.H., 2000, ApJ, 528, 161
- Balbus (2003) Balbus S.A., 2003, ARA&A, 41, 555
- Balbus & Hawley (1998) Balbus S.A., Hawley J.F., 1998, Rev. Mod. Phys., 1998, 70, 1
- Ballantyne & Fabian (2001) Ballantyne, D.R. & Fabian, A.C., 2001, MNRAS, 328, L11
- Ballantyne et al. (2001a) Ballantyne D.R., Iwasawa K., Fabian A.C., 2001a, MNRAS, 323, 506
- Ballantyne et al. (2001b) Ballantyne D.R., Ross R.R., Fabian A.C., 2001b, MNRAS, 327, 10
- Ballantyne et al. (2002) Ballantyne D.R., Fabian A.C., Ross R.R., 2002, MNRAS, 329, L67
- Ballantyne et al. (2003) Ballantyne, D.R., Vaughan, S. & Fabian, A.C., 2003, MNRAS, 342, 239
- Ballantyne et al. (2004) Ballantyne D.R., Turner N.J., Blaes O.M., 2004, ApJ, 603, 436
- Ballantyne & Ross (2002) Ballantyne D.R., Ross R.R., 2002, MNRAS, 332, 777
- Ballantyne (2010) Ballantyne D.R., 2010, ApJ, 708, L1
- Barger et al. (2005) Barger, A.J., Cowie, L.L., Mushotzky, R.F., Yang, Y., Wang, W.-H., Steffen, A.T. & Capak, P., 2005, AJ, 129, 578
- Beloborodov (1999) Beloborodov, A.M., 1999, ApJ, 510, L123
- Blackman & Pessah (2009) Blackman E.G., Pessah M.E., 2009, ApJ, 704, L113
- Blaes et al. (2007) Blaes, O., Hirose, S. & Krolik, J.H., 2007, ApJ, 664, 1057
- Bonning et al. (2007) Bonning E.W., Chang L., Shields G.A., Salviander S., Gebhardt K., 2007, ApJ, 659, 211
- Brenneman & Reynolds (2006) Brenneman L.W., Reynolds C.S., 2006, ApJ, 652, 1028
- Brenneman & Reynolds (2009) Brenneman L.W., Reynolds C.S., 2009, ApJ, 702, 1367
- Davis et al. (2006) Davis S.W., Done C., Blaes O.M., 2006, ApJ, 647, 525
- Davis et al. (2007) Davis S.W., Woo, J.-H., Blaes O.M., ApJ, 668, 682
- Davis et al. (2010) Davis S.W., Stone J.M. & Pessah, M., 2010, ApJ, 713, 52
- Davis & Laor (2011) Davis S.W., Laor A., 2011, ApJ, 728, 98
- de la Calle Pérez et al. (2010) de la Calle Pérez I. et al., 2010, A&A, 524, A50
- Denney et al. (2010) Denney K.D., et al., 2010, ApJ, 721, 715
- Elvis et al. (2002) Elvis, M., Risaliti, G. & Zamorani, G., 2002, ApJ, 565, L75
- Fabian et al. (2002) Fabian A.C., Vaughan S., Nandra K., Iwasawa K., Ballantyne D.R., Lee J.C., De Rosa A., Turner A., Young A.J., 2002, MNRAS, 335, L1
- Fabian et al. (2004) Fabian A.C., Miniutti G., Gallo L., Boller Th., Tanaka Y., Vaughan S., Ross R.R., 2004, MNRAS, 353, 1071
- Fanidakis et al. (2011) Fanidakis, N., Baugh, C.M., Benson, A.J., Bower, R.G., Cole, S., Done, C. & Frenk, C.S., 2011, MNRAS, 410, 53
- Galeev et al. (1979) Galeev A.A., Rosner R., Vaiana G.S., 1979, ApJ, 229, 318
- Gallo (2006) Gallo L.C., 2006, MNRAS, 368, 479
- Gallo et al. (2007) Gallo L.C., Brandt W.N., Costantini E., Fabian A.C., Iwasawa K., Papadakis I.E., 2007, MNRAS, 377, 391
- Gallo et al. (2011) Gallo L.C., Miniutti G., Miller J.M., Brenneman L.W., Fabian A.C., Guainazzi M., Reynolds, C.S., 2011, MNRAS, 411, 607
- García & Kallman (2010) García J., Kallman T.R., 2010, ApJ, 718, 695
- George & Fabian (1991) George I.M., Fabian A.C., 1991, MNRAS, 249, 352
- Guilbert & Rees (1988) Guilbert P.W., Rees M.J., 1988, MNRAS, 233, 475
- Haardt & Maraschi (1991) Haardt F., Maraschi L., 1991, ApJ, 380, L51
- Haardt & Maraschi (1993) Haardt F., Maraschi L., 1993, ApJ, 413, 507
- Haardt et al. (1994) Haardt F., Maraschi L., Ghisellini G., 1994, ApJ, 432, L95
- Hirose et al. (2009) Hirose S., Krolik J.H., Blaes O., 2009, ApJ, 691, 16
- Inoue et al. (2007) Inoue H., Terashima Y., Ho L.C., 2007, ApJ, 662, 860
- Isobe et al. (1990) Isobe, T., Feigelson, E.D., Akritas, M.G. & Babu, G.J., 1990, ApJ, 364, 104
- Johannsen & Psaltis (2011) Johannsen T., Psaltis D., 2011, ApJ, 726, 11
- Kaspi et al. (2005) Kaspi, S., Maoz, D., Netzer, H., Peterson, B.M., Vestergaard, M. & Jannuzi, B.T., 2005, ApJ, 629, 61
- King et al. (2007) King, A.R., Pringle, J.E. & Livio, M., 2007, MNRAS, 376, 1740
- Kishimoto et al. (2005) Kishimoto M., Antonucci R., Blaes O., 2005, MNRAS, 364, 640
- Kishimoto et al. (2008) Kishimoto M., Antonucci R., Blaes O., Lawrence A., Boisson C., Albrecht M. & Leipski C., 2008, Nature, 454, 492
- Kollmeier (2006) Kollmeier, J.A., et al., 2006, ApJ, 648, 128
- Koratkar & Blaes (1999) Koratkar A., Blaes O., 1999, PASP, 111, 1
- Krolik (1999) Krolik, J.H., 1999, Active Galactic Nuclei: From the Central Black Hole to the Galactic Environment (Princeton, NJ: Princeton Univ. Press)
- Lightman & White (1988) Lightman A.P., White T.R., 1988, ApJ, 335, 57
- Longinotti et al. (2007) Longinotti A.L., Sim S.A., Nandra K., Cappi M., 2007, MNRAS, 374, 237
- Lynden-Bell (1969) Lynden-Bell D. 1969, Nature, 223, 690
- Marconi et al. (2004) Marconi, A., Risaliti, G., Gilli, R., Hunt, L.K., Maiolino, R. & Salvati, M., 2004, MNRAS, 351, 169
- Marziani et al. (2010) Marziani P., Sulentic J.W., Negrete C.A., Dultzin D., Zamfir S., Bachev R., 2010, MNRAS, 409, 1033
- Matt et al. (1991) Matt G., Perola G.C., Piro L., 1991, A&A, 247, 25
- McHardy et al. (2005) McHardy, I. M., Gunn, K. F., Uttley, P., & Goad, M. R. 2005, MNRAS, 359, 1469
- Merloni & Fabian (2001) Merloni A., Fabian A.C., 2001, MNRAS, 328, 958
- Merloni & Fabian (2002) Merloni A., Fabian A.C., 2002, MNRAS, 332, 165
- Miller (2007) Miller J.M., 2007, ARA&A, 45, 441
- Miniutti & Fabian (2004) Miniutti, G., & Fabian, A. C. 2004, MNRAS, 349, 1435
- Miniutti et al. (2007) Miniutti, G., et al. 2007, PASJ, 59, 315
- Morgan et al. (2010) Morgan C.W., Kochanek C.S., Morgan N.D., Falco E.E., 2010, ApJ, 712, 1129
- Mushotzky et al. (1993) Mushotzky R.F., Done C., Pounds K.A., 1993, ARA&A, 31, 717
- Nandra (2006) Nandra K., 2006, MNRAS, 368, L62
- Nandra & Pounds (1994) Nandra K., Pounds K.A., 1994, MNRAS, 268, 405
- Nandra et al. (2007) Nandra K., O’Neill P.M., George I.M., Reeves J.N., 2007, MNRAS, 382, 194
- Nardini et al. (2011) Nardini E., Fabian A.C., Reis R.C., Walton D.J., 2011, MNRAS, 410, 1251
- Nayakshin et al. (2000) Nayakshin S., Kazanas D., Kallman T.R., 2000, ApJ, 537, 833
- Novikov & Thorne (1973) Novikov I.D., Thorne K.S., 1973, in De Witt C., De Witt B., eds., Black Holes, Gordan and Breach, 343
- Patrick et al. (2011) Patrick A.R., Reeves J.N., Porquet D., Markowitz A.G., Lobban A.P., Terashima Y., 2011, MNRAS, 411, 2353
- Peterson et al. (2004) Peterson B.M., et al., 2004, ApJ, 613, 682
- Pounds et al. (1990) Pounds K.A., Nandra K., Stewart G.C., George I.M., Fabian A.C., 1990, Nature, 344, 132
- Pringle (1981) Pringle J., 1981, ARA&A, 19, 137
- Rees (1984) Rees M.J., 1984, ARA&A, 22, 471
- Reynolds et al. (2004) Reynolds, C.S., Wilms, J., Begelman, M.C., Staubert, R. & Kendziorra, E., 2004, MNRAS, 349, 1153
- Ross & Fabian (1993) Ross R.R., Fabian A.C., 1993, MNRAS, 261, 74
- Ross et al. (1999) Ross R.R., Fabian A.C., Young A.J., 1999, MNRAS, 306, 461
- Ross & Fabian (2005) Ross R.R., Fabian A.C., 2005, MNRAS, 358, 211
- Shakura & Sunyaev (1973) Shakura N.I., Sunyaev R.A., 1973, A&A, 24, 337
- Shu et al. (2010) Shu X.W., Yaqoob T., Wang J.X., 2010, ApJS, 187, 581
- Soltan (1982) Soltan, A., 1982, MNRAS, 200, 115
- Steffen et al. (2006) Steffen, A.T., Strateva, I., Brandt, W.N., Alexander, D.M., Koekemoer, A.M., Lehmer, B.D., Schneider, D.P. & Vignali, C., 2006, AJ, 131, 2826
- Steinhardt & Elvis (2010) Steinhardt, C.L. & Elvis, M., 2010, MNRAS, 402, 2637
- Stella & Rosner (1984) Stella, L. & Rosner, R., 1984, ApJ, 277, 312
- Svennson & Zdziarski (1994) Svennson, R. & Zdziarski, A.A., 1994, ApJ, 436, 599
- Tanaka et al. (1995) Tanaka Y., et al., 1995, Nature, 375, 659
- Vasudevan & Fabian (2007) Vasudevan R.V., Fabian A.C., 2007, MNRAS, 381, 1235
- Vasudevan & Fabian (2009) Vasudevan R.V., Fabian A.C., 2009, MNRAS, 392, 1124
- Wang et al. (2004) Wang J.-M., Watarai K.-Y., Mineshige S., 2004, ApJ, 607, L107
- Wilms et al. (2001) Wilms, J., Reynolds, C.S., Begelman, M.C., Reeves, J., Molendi, S., Staubert, R. & Kendziorra, E., 2001, MNRAS, 328, L27
- Woo et al. (2010) Woo J.H., et al., 2010, MNRAS, ApJ, 716, 269
- Yu & Tremaine (2002) Yu, Q. & Tremaine, S.D., 2002, MNRAS, 335, 965
- Zhou & Zhao (2010) Zhou X-L., Zhao Y.H., 2010, ApJ, 720, L206
- Zoghbi et al. (2008) Zoghbi A., Fabian A.C., Gallo L.C., 2008, MNRAS, 391, 2003

| Source | Type | Ref. | Ref. | Ref. | Ref. | ||||||
|---|---|---|---|---|---|---|---|---|---|---|---|
| (erg cm s-1) | (erg s-1) | (M⊙) | |||||||||
| Mrk 766 | NLS1 | 0.0129 | 961 | BR09 | N07 | 57 | ZZ10 | W10 | 2 | ||
| NGC 3783 | Sy 1.5 | 0.0097 | 30 | BR09 | N07 | 15 | VF09 | W10 | 0.04 | ||
| NGC 4051 | NLS1 | 0.0023 | 99 | BR09 | N07 | 67 | VF09 | D10 | 0.06 | ||
| Ark 120 | Sy 1 | 0.0327 | 30 | BR09 | N07 | 25 | VF09 | W10 | 0.13 | ||
| Ark 120 | — | — | 280 | N11 | P11 | — | — | — | — | 0.10 | |
| Fairall 9 | Sy 1.2 | 0.047 | 24 | P11 | P11 | 10.5 | VF09 | P04 | 0.04 | ||
| Mrk 79aadata taken from the long Suzaku observation | Sy 1.2 | 0.022 | 177 | G11 | G11 | 10.5 | VF09 | P04 | 0.03 | ||
| Mrk 79bbdata taken from the XMM6 observation | — | — | 60 | G11 | G11 | — | — | — | — | 0.01 | |
| I Zw 1 | NLS1 | 0.0611 | 3060 | G07 | G07 | 76 | ZZ10 | M10 | 1.3 | ||
| Mrk 478c,c,footnotemark: ddGallo (2006) listed the – keV flux, so will be slightly underestimated | NLS1 | 0.079 | 746 | Z08 | G06 | 86 | ZZ10 | M10 | 0.48 |
Note. — Details compiled from the literature of AGNs with high quality black hole masse estimates that also have X-ray spectra that exhibit clear evidence for a relativistic Fe K line and have been fit with the ‘reflionx’ ionized disk model of Ross & Fabian (2005). denotes the intrinsic rest-frame – keV luminosity of the AGN, is the mass of the black hole, and is the estimated bolometric luminosity. The Eddington luminosity, , is defined as erg s-1. References: BR09: Brenneman & Reynolds (2009), N07: Nandra et al. (2007), ZZ10: Zhou & Zhao (2010), W10: Woo et al. (2010), VF09: Vasudevan & Fabian (2009), D10: Denney et al. (2010), P11: Patrick et al. (2011), N11: Nardini et al. (2011), P04: Peterson et al. (2004), G11: Gallo et al. (2011), G07: Gallo et al. (2007), M10: Marziani et al. (2010), Z08: Zoghbi et al. (2008), G06: Gallo (2006).