The Core-Collapse Supernova Rate in Arp 299 Revisited
Abstract
We present a study of the core collapse supernova (CCSN) rate in nuclei A and B1, of the luminous infrared galaxy (LIRG) Arp 299, based on years of Very Large Array (VLA) monitoring of their radio emission at 8.4 GHz. Significant variations in the nuclear radio flux density can be used to identify the CCSN activity in the absence of high-resolution very long baseline interferometry (VLBI) observations. In the case of the B1-nucleus, the small variations in its measured diffuse (synchrotron plus free-free) radio emission are below the fluxes expected from radio supernovae (RSNe), thus making it well-suited to detect RSNe through flux density variability. In fact, we find strong evidence for at least three RSNe this way, which results in a lower limit for the CCSN rate () of yr-1. This value agrees within the uncertainties with the infrared (IR) luminosity based SN rate estimate, and with previously reported radio estimates. In the A-nucleus, we did not detect any significant variability and found a SN detection threshold luminosity of , allowing only the detection of the most luminous RSNe known. Our method is basically blind to normal CCSN explosions occurring within the A-nucleus, which result in too small variations in the nuclear flux density, remaining diluted by the strong diffuse emission of the nucleus itself. Additionally, we have attempted to find near-infrared (NIR) counterparts for the earlier reported RSNe in the Arp 299 nucleus A, by comparing NIR adaptive optics images from the Gemini-N telescope with contemporaneous observations from the European VLBI Network (EVN). However, we were not able to detect NIR counterparts for the reported radio SNe within the innermost regions of nucleus A. While our NIR observations were sensitive to typical CCSNe at 300 mas (or 70 pc projected distance) from the centre of the nucleus A, suffering from extinction up to mag, they were not sensitive to such highly obscured SNe within the innermost nuclear regions where most of the EVN sources were detected.
keywords:
galaxies: individual: NGC 3690:IC 694 – galaxies: starburst – stars: supernovae: general1 Introduction
Galaxies with infrared luminosities L☉, i.e., luminous infrared galaxies (LIRGs) show enhanced activity associated with a starburst and/or an active galactic nucleus (AGN) (Sanders & Mirabel, 1996). These galaxies contain a high concentration of dense molecular gas in their circumnuclear regions; consequently a very active star formation process is ensured, resulting in a large number of core collapse supernovae (CCSNe). However, the detection of the SNe occurring in the nuclear regions of LIRGs is in most cases not feasible at optical wavelengths due to severe dust extinction (see §5). Observations in the near-infrared (NIR) K-band where the extinction is strongly reduced () can be used for their successful detection (e.g., Mattila & Meikle, 2001; Maiolino et al., 2002). However, the tight concentration of the star formation within the innermost nuclear regions of LIRGs (e.g., Soifer et al., 2001) means that the detection of such SNe even at NIR wavelengths in natural seeing conditions is often not feasible. Recent SN search programmes benefiting from the high spatial resolution offered by adaptive optics (AO) observations at NIR wavelengths have already discovered several obscured SNe close to LIRG nuclei. For example, SN 2004ip with a likely high extinction mag (Mattila et al., 2007) was detected at a projected distance of 1.4 arcsec, or 500 pc, from the K-band nucleus of the nearby LIRG, IRAS 182933413. Its core-collapse nature was confirmed by a VLA detection at 8.4 GHz (Pérez-Torres et al., 2007). Two circumnuclear SNe, SN 2004iq and SN 2008cs (Kankare et al., 2008) were detected in the circumnuclear regions of the nearby LIRG IRAS 171381017. SN 2008cs was shown to suffer from a record high extinction of . Its core-collapse nature was again confirmed by a radio detection at 22.4 GHz using VLA (Perez-Torres et al., 2008). SN 2010cu detected at 0.4 arcsec (180 pc) from the K-band nucleus of the nearby LIRG IC 883 (Ryder et al., 2010), has also a likely high extinction. More recently, another probable SN (PSN J13203538+3408222) was detected at 0.8 arcsec (360 pc) from the centre of the K-band nucleus of the same galaxy (Kankare et al., 2011).
Whilst assuming a realistic initial mass function (IMF), the detection of new CCSNe can yield information on the star formation rate (SFR) of the host galaxy for the progenitor stars ( M☉, Smartt et al., 2009), provided that the number of detections over time allows a reasonable statistical estimate. Many of the CCSNe expected to occur in LIRGs will be radio emitters, and their evolution is determined by the circumstellar medium (CSM) in which they are embedded. Despite the expectation of a large number of CCSN events taking place in LIRGs, only a few tens of them have been detected at radio frequencies (free of extinction), either as young supernova remnants (SNRs) or as RSNe in the nuclear regions of e.g., Arp 220 and Arp 299 (Parra et al., 2007; Pérez-Torres et al., 2009, and references therein). The difficulty in their detection is due to the presence of a strong host galaxy background emission. Very long baseline interferometry (VLBI) observations provide high angular resolution and are able to resolve out the diffuse background emission, therefore allowing the detection of RSNe and SNRs in the innermost nuclear regions of nearby LIRGs.
The VLA does not provide us with the needed resolution to resolve SNe in the innermost nuclear regions of LIRGs. However, it is possible to use VLA observations to search for variations in the total nuclear radio flux density, which can be used to probe the RSN activity in LIRGs. Based on the variability of the flux density, we propose a method to estimate CCSN rates () in nearby LIRGs by exploiting the wealth of archival VLA data which are available for a number of LIRGs. Archival VLA data for Arp 299 at 8.4 GHz, covers a period of time suitable to test the proposed method and to allow a meaningful comparison with other predictions.
2 Previous radio and NIR studies of Arp 299
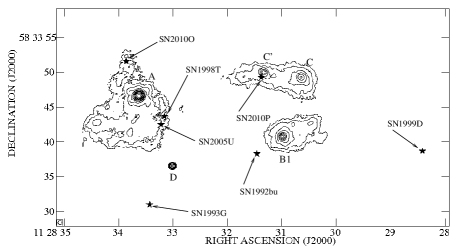
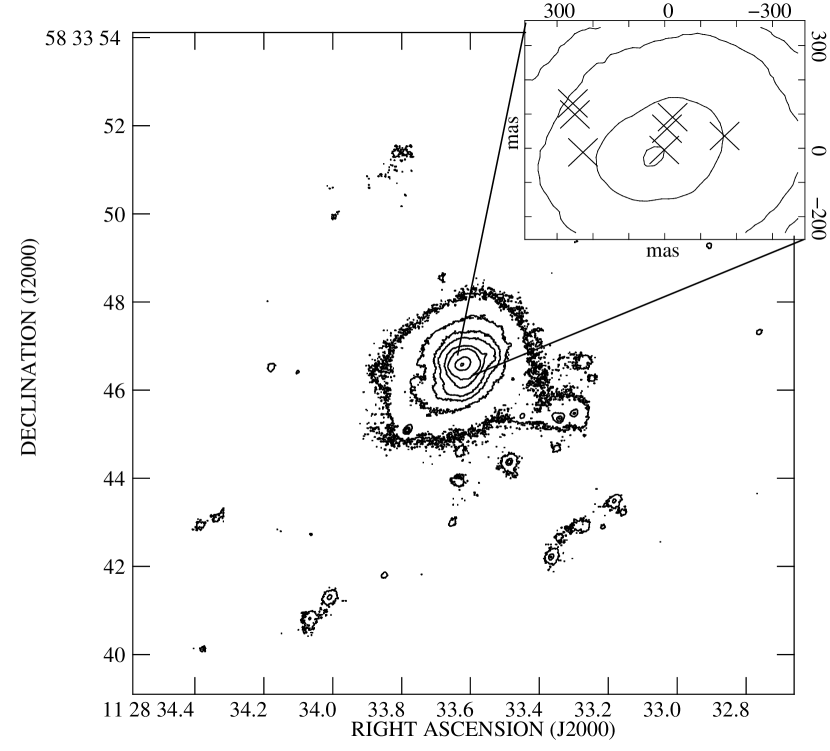
Arp 299 is a system composed of the pair of galaxies IC 694 (east component) and NGC 3690 (west component), whose interaction is inducing a powerful star formation (Alonso-Herrero et al., 2000, and references therein). Four separate cores can be distinguished in VLA radio images of Arp 299 (see Figure 1): A (IC 694), B () plus C (NGC 3690) and C′ (in the overlapping region). Hereafter we will refer to the NGC 3690-nucleus as B1, since this is the brightest core in that galaxy. In the same field of view a probable background source named D is also found, which to our knowledge has not been detected in any radio spectral line observation made towards the system (see e.g., Casoli et al., 1999; Aalto et al., 1997), indicating that its redshift differs from that of Arp 299. In fact, source D was first detected at radio wavelengths by Huang et al. (1990) and identified as a probable SN, but Ulvestad (2009) has found that D has characteristics of a Palomar-Green (PG) quasar. The positions of the cores in Arp 299 and the probable background source D, as measured from the deep combined VLA image at 8.46 GHz (see Figure 1), are listed in Table 1.
| Core | Peak Position | [,] | |
|---|---|---|---|
| (J2000) | (J2000) | (mas) | |
| A | 11 28 33.626 | 58 33 46.65 | 0.2 |
| B1 | 11 28 30.987 | 58 33 40.80 | 1.6 |
| C′ | 11 28 31.332 | 58 33 50.00 | 4.5 |
| C | 11 28 30.648 | 58 33 49.30 | 5.8 |
| D | 11 28 33.013 | 58 33 36.55 | 5.6 |
| (yr-1) | References | Notes | |
|---|---|---|---|
| A | B1 | ||
| 0.65 | 0.12 | Alonso-Herrero et al. (2000) | 111The estimates are based on VLA measurements.,222No errors have been reported for the given rates. |
| 0.5 - 1.0 | 0.1 - 0.2 | Neff et al. (2004) | 111The estimates are based on VLA measurements. |
At a luminosity distance of 44.8 Mpc (Fixsen et al., 1996) for km s-1 Mpc-1, Arp 299 has an infrared (IR) luminosity (–) L☉ (as resulting from scaling the value for the same wavelength interval given by Sanders et al., 2003, to the distance we adopted here), which makes it one of the most luminous LIRGs of the local Universe. Charmandaris et al. (2002) found that IC 694 emits approximately 40% of the total IR luminosity of Arp 299, whereas NGC 3690 accounts for approximately 20%. Making use of these estimates together with the empirical relation between CCSN rate and – for starburst galaxies obtained by Mattila & Meikle (2001):
we have a total CCSN rate of yr-1 for the whole system, and we expect SN rates of yr-1 and yr-1 for A and B1, respectively. These IR luminosity based SN rates are similar for the nucleus A, but higher for nucleus B1, than those determined in previous studies (see Table 2), which bear some dependency on the radio spectral behaviour of the cores. We notice though, that these IR luminosity based SN rate estimates assume no AGN contribution to the IR luminosity. However, we now know that there is likely also some AGN contribution to the IR luminosity of B1 (Alonso-Herrero et al., 2009), and therefore the true SN rate for this nucleus could be lower than what has been estimated above.
Over the past 20 years, Arp 299 has been the target of many SN search campaigns which can also provide important insight into its dominating energy source (AGN and/or starburst). In that period a number of SNe have been detected at optical (Treffers et al., 1993; Li et al., 1998; Qiu et al., 1999; Newton et al., 2010) or NIR (van Buren et al., 1994; Mattila et al., 2005; Mattila & Kankare, 2010) wavelengths (see Table 3) in the circumnuclear regions. All of these SNe have been spectroscopically classified as core-collapse events of either type II or Ib, except SN 1992bu, whose type is unknown. The detection of seven SNe over a period of less than 20 years, already indicates a very high SN rate in the circumnuclear regions of Arp 299. The relatively high fraction of stripped envelope SNe (types Ib/IIb) and their distribution with respect to the host galaxy properties are discussed in Anderson et al. (2011).
| SN | Type | Position |
|---|---|---|
| designation | , (J2000) | |
| 1992bu (NIR)111van Buren et al. 1994 | - | 11 28 31.46, 58 33 38.3111van Buren et al. 1994 |
| 1993G (optical)222Treffers et al. 1993 | IIL333Tsvetkov 1994 | 11 28 33.43, 58 33 31.0444Forti et al. 1993 |
| 1998T (optical)555Li et al. 1998 | Ib555Li et al. 1998 | 11 28 33.16, 58 33 43.7666Yamaoka et al. 1998 |
| 1999D (optical)777Qiu et al. 1999 | II888Jha et al. 1999 | 11 28 28.42, 58 33 38.7999Prosperi 1999 |
| 2005U (NIR)101010Mattila et al. 2005 | IIb111111Modjaz et al. 2005; Leonard & Cenko 2005 | 11 28 33.22, 58 33 42.5101010Mattila et al. 2005 |
| 2010O (optical)121212Newton et al. 2010 | Ib131313Mattila et al. 2010 | 11 28 33.86, 58 33 51.6121212Newton et al. 2010 |
| 2010P (NIR)141414Mattila & Kankare 2010 | Ib/IIb151515Ryder et al. 2010 | 11 28 31.38, 58 33 49.3141414Mattila & Kankare 2010 |
Very high resolution radio studies by Neff et al. (2004); Ulvestad (2009); Pérez-Torres et al. (2009) and Pérez-Torres et al. (2010) have shown that at high angular resolution the brightest cores of the Arp 299 merger (A and B1), consist of a wealth of compact components within the innermost regions of these nuclei.
In 2008, Pérez-Torres et al. started an observing campaign with the EVN to monitor the nuclear region of Arp 299-A. The extended radio emission of Arp 299-A is resolved out with the VLBI beam, thus revealing the existence of a rich cluster of 26 compact radio emitting sources within the 150 pc diameter innermost region. The high brightness temperatures observed for the compact sources are indicative of a non-thermal origin for the observed radio emission, implying that most of the sources are young RSNe and SNRs (Pérez-Torres et al., 2009). Moreover, Pérez-Torres et al. (2010) have recently detected the AGN in the A-nucleus, whose characteristics correspond to a low luminosity AGN (LLAGN). In the western nucleus of Arp 299, B1, only five VLBI components have been detected (Ulvestad, 2009).
However, Arp 299 has been observed with VLBI techniques only since 2003 (Neff et al., 2004), and thus the appearance of new sources in its nuclear regions before 2003 has gone unnoticed. We have therefore carried out a study using the available data in the VLA archive aiming at measuring the in the Arp 299 nuclei through the study of their flux density variability. Our method is particularly efficient in the B1-nucleus, where the radio surface brightness is lower, hence allowing us to detect small variations in the overall nuclear flux density, which can be related to SN activity. In fact, this kind of study has been successfully applied to M82, where a strong radio flare on top of the diffuse emission of the host galaxy, was identified with SN 2008iz (Marchili et al., 2010).
3 VLA archival data
Reduction and analysis
| Date | VLA | Programme | Weighting | rms | |||||
|---|---|---|---|---|---|---|---|---|---|
| config. | (Jy/beam) | (mJy/beam) | (mJy) | (mJy/beam) | (mJy) | ||||
| 1 | 1990-02-24 | A | AH396 | natural | 148.4 | 64.743.24 | 83.664.19 | 7.520.40 | 9.890.52 |
| 2 | 1990-03-04 | A | AH396 | natural | 89.3 | 62.773.14 | 79.463.97 | 7.550.39 | 9.600.49 |
| 3 | 1991-07-05 | A | AS333 | natural | 93.3 | 62.263.11 | 81.874.09 | 8.090.41 | 11.230.57 |
| 4 | 1993-01-28 | BnA | AS333 | natural | 73.4 | 62.323.12 | 81.714.09 | 7.910.40 | 12.290.62 |
| 5 | 1993-05-07 | B | AS333 | uniform | 294.8 | 61.563.09 | 78.943.96 | 7.950.50 | 11.340.64 |
| 6 | 1994-05-16 | BnA | AY064 | natural | 38.6 | 64.203.21 | 82.124.11 | 7.810.39 | 10.390.52 |
| 7 | 1999-10-28 | B | AS568 | uniform | 70.8 | 56.252.81 | 77.213.86 | 7.570.38 | 9.920.50 |
| 8 | 2001-03-19 | B | AN095 | uniform | 37.4 | 63.353.17 | 83.034.15 | 8.380.42 | 12.480.62 |
| 9 | 2002-04-29 | A | AN103 | natural | 207.7 | 63.083.16 | 82.784.14 | 7.140.41 | 10.460.56 |
| 10 | 2002-09-06 | B | TYP04 | uniform | 332.1 | 60.793.06 | 76.373.83 | 7.350.50 | 10.250.61 |
| 11 | 2003-10-17 | BnA | AS779 | uniform | 36.9 | 66.943.35 | 82.544.13 | 7.970.40 | 11.480.57 |
| 12 | 2004-11-02 | A | AC749 | natural | 31.5 | 65.853.29 | 84.374.22 | 7.800.39 | 10.900.55 |
| 13 | 2005-02-08 | BnA | AW641 | uniform | 103.5 | 65.463.27 | 84.584.23 | 8.190.42 | 12.230.62 |
| 14 | 2006-04-15 | A | AC749 | natural | 131.6 | 58.832.94 | 77.393.87 | 15.470.78 | 17.280.87 |
Arp 299 has been observed repeatedly with the VLA over the last decades in X-band (8.46 GHz). However, archival data lack homogeneity in frequency and resolution and do not cover an adequate time period at regular intervals, making the estimates of more challenging.
The X-band VLA observations in A-configuration, provide us with a resolution of a few tenths of an arcsecond, enough to easily distinguish the emission from the different cores in Arp 299, but not to resolve each nucleus. In fact, as we have mentioned in §2, the nuclei A and B1 both consist of several compact sources (Pérez-Torres et al., 2009, and references therein). Therefore, care must be taken while interpreting flux density measurements at VLA resolutions, which do not resolve out each core into their individual sources.
Our aim is to further investigate the available archival data to extract information on the SN activity in Arp 299, despite the difficulties both in extracting and interpreting the information from VLA images. We have analysed high resolution, X-band VLA data from 1990 to 2006 (see Table 4) to study the flux density variations of the Arp 299 nuclei. The VLA data were reduced following standard procedures with the NRAO Astronomical Image Processing System (AIPS). The intensity scale was set by observations of 3C48 in the case of project TYP04, and 3C286 for all the other projects. At X-band, these sources have an adopted flux density around 3.2 and 5.2 Jy, respectively (Baars et al., 1977).
Most of the studied epochs have been previously analysed by Neff et al. (2004) and Ulvestad (2009). The main difference with the previous studies, is that we have estimated the flux densities in a consistent way by extracting them from maps created with matched baselines (in wavelengths) and with the same convolving beam (0.780.73 arcsec at 19°). We chose a common uv-range of 23.6 to 261.9 k for all our maps in order to properly compare among different observing epochs, thus avoiding systematic effects. Such restriction in the uv-range implies a suppression of structures larger than 8.7 arcsec and smaller than 0.8 arcsec. Moreover, to match the resolutions of the different observations, we applied natural weighting to those images with better resolution (those made in the VLA-A configuration) and uniform weighting to images with worse resolution (those made in the VLA-B configuration). For the hybrid BnA observations, we applied a uniform weighting to images having an intrinsically worse resolution than the chosen convolving beam, and a natural weighting to images having a better resolution than this.
We ran a series of phase-only self-calibration iterations in each epoch to achieve a better signal to noise ratio. All the images were centred at 11h28m33s, +58°33′43″, and the AIPS task PBCOR was applied in each one of the final images to correct for the primary beam attenuation.
We estimated the flux densities of the nuclei in each image by enclosing the emission above in a box and fitting a single Gaussian, using the AIPS task IMFIT. In each epoch, such box had an area of pc2 for the A-nucleus, and pc2 for the B1-nucleus, thus covering the circumnuclear regions in each case, where we expect the SNe and the possible AGN activity to take place. The angular size of these regions is such that fitting a single Gaussian is suitable.
Table 4 contains the observing parameters of each epoch and the estimated values obtained always from the last image resulting from the self-calibration process, but corrected by the beam attenuation.
4 Tracing the nuclear activity in Arp 299 through flux density variations
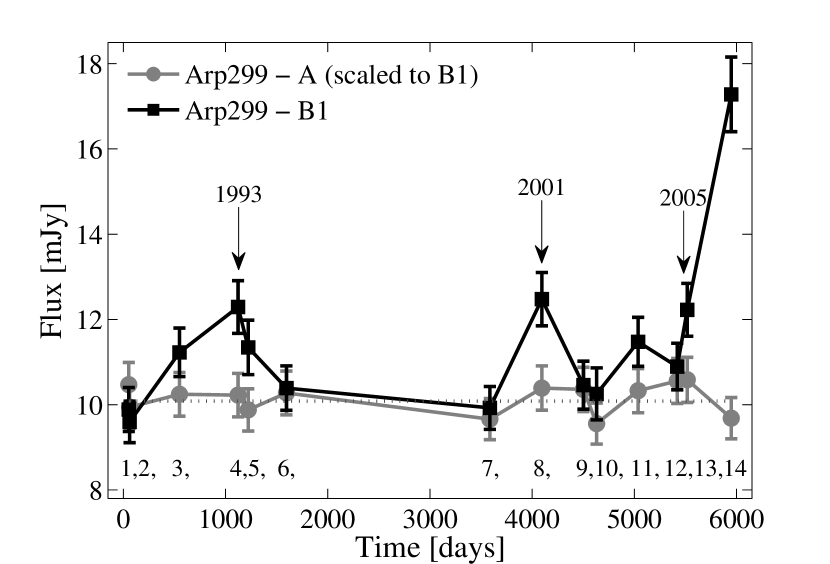
Figure 2 shows the light curves of nuclei A and B1, scaled to the same flux density level (the one of B1) to allow comparison. We note that the B1-nucleus exhibits conspicuous flux density variations. In contrast, the A-nucleus does not show systematic variations and remains relatively constant throughout the period of time comprised in our study, taking into account the observational uncertainties. We have also attested that the use of different phase calibrators has no influence on the flux density variations we see in B1. Furthermore, as we show in Figure 2, the flux density variations of nucleus B1 are not correlated with those of nucleus A, and we have checked that the same is also true with the other cores present in the region, i.e., C, C′ and D.
To quantify the flux density variations we see in nucleus B1, we have made an iterative selection of the lowest data points to obtain a baseline value for B1, and compared each epoch’s flux density with respect to the obtained baseline value.
As a starting point, we define an initial baseline value for the B1-nucleus flux densities given by , where is the mean of the 14 values and is the standard error of the mean. We then determined the deviation of the flux density in each epoch () from the baseline value, with
The same was done for nucleus A. In the next step we excluded the epochs having and proceeded to calculate a new baseline value. We followed this iterative process until no more epochs could be removed by another iteration, thus leading to a robust baseline value.
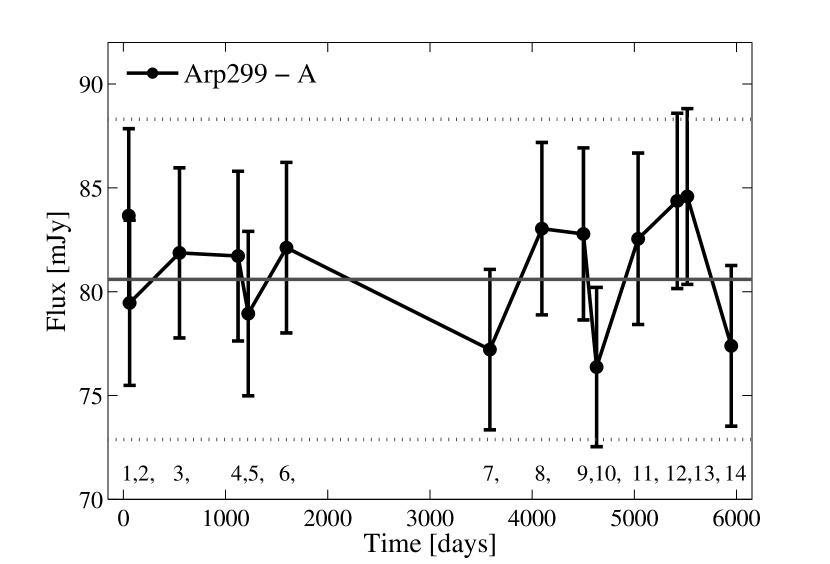
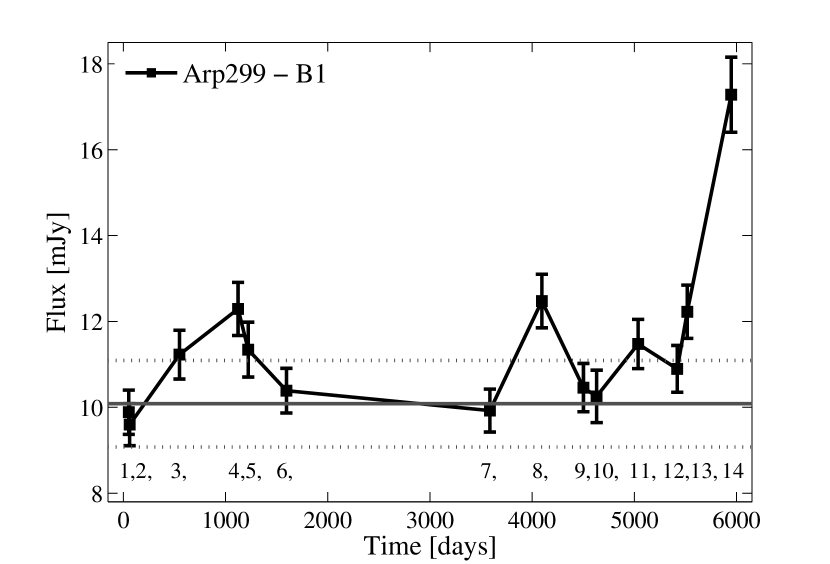
After the third iteration, we find that the flux densities of the B1-nucleus on epochs 1, 2, 6, 7, 9 and 10, are representative of a quiescent state. Thus, considering the fluxes of these epochs, we obtain a final baseline value of mJy for B1. For nucleus A, only epochs 13 and 12 were found to be above three times the standard error of the mean after the second iteration, and we have consequently obtained a baseline value of mJy for A. Taking the ratio of the final A and B1 nuclei baselines values, we obtain a scaling factor for A of , that allows comparison with B1 (see Figure 2).
To attest the significance in the variability of each epoch in each nucleus, we calculated again the deviation of each epoch but this time using the standard deviation, of the final baseline for each nucleus: mJy and mJy. We find that the flux densities of all the epochs in the A-nucleus show no significant deviations from the mean value (). For the B1 nucleus, epochs 3, 4, 5, 8, 11, 13 and 14 (following the numeration from Table 4) are all above , and of these, epochs 4, 8, 13 and 14 are also above . Epoch 12, not being part of the baseline, has a variation slightly below , and hence it lacks of significance according to our detection threshold. Epochs 3 and 5 appear to be connected with the variation present in epoch 4, so we consider all these three epochs as having the same origin. Epoch 11 has less significant variability on its own and seems to share a similar behaviour with the epoch 11 in A (see Figures 2 and 2), so its significance is further reduced due to a possible systematic effect in that epoch.
4.1 Flux density variability of the A-nucleus
Tracing the SN activity of nucleus A through its radio flux density variations, is not feasible. This is because the flux density of the core A at these angular scales is not dominated by the individual SNe, but by the diffuse emission of the strong starburst therein, thus resulting in the relative quiescence of the total flux density (see Figure 2).
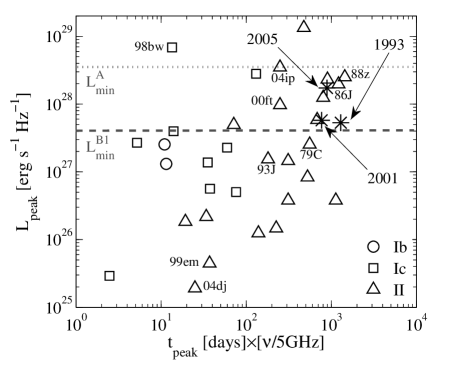
We note that typical RSN at the distance of Arp 299 have flux densities comparable to the given uncertainties in the nuclear flux density (see column 7 of Table 4), and thus to the obtained standard deviation, , in our variability test. Hence, it was not possible to detect SNe in the A-nucleus using this method. Furthermore, the minimum flux density for an event to be robustly detected with above the mean, would be mJy. At the distance of Arp 299, such flux density implies at the peak, which is uncommon for normal CCSNe (see Figure 3). With our method, we are able to detect only very bright SN events (such as powerful type IIn or 98bw-like events), which do not seem to be common in the A-nucleus. Indeed, the luminosities for the SN candidates found by Pérez-Torres et al. (2009), range between and (typical of type IIb, IIP and IIL SNe), and are thus well below our detection limit. Thus, in the absence of VLBI observations, the only feasible alternative to detect new SNe in nucleus A is by means of NIR observations (see §5).
Pérez-Torres et al. (2010) identified a compact source as the core of a LLAGN in Arp 299-A. Its flux density at 5 GHz has remained below mJy in observations carried out in 8 April 2008, 5 December 2008 (Pérez-Torres et al., 2009) and in 7-8 June 2009 (Pérez-Torres et al., 2010). In fact, typical LLAGNs display at most flux density variations times the average flux density (see Figure 2 from Nagar et al., 2002). Even if the LLAGN doubles its radio luminosity at a given time, we would not be able to detect such a burst in nucleus A since our flux density uncertainties are higher than 2 mJy in all the epochs (see Table 4).
4.2 The nature of the radio variability of nucleus B1
As mentioned above, epochs 4, 8, 13 and 14 show conspicuous variability above (see Figure 2). Following the same reasoning as for the A-nucleus, we have also explored the possibility of explaining the flux density variations in the B1-nucleus being due to AGN outbursts. The presence of a LLAGN in the B1-nucleus is well supported by the detection of H2O megamaser emission (Tarchi et al., 2011, and references therein) and hard X-ray component (e.g., Ballo et al., 2004; González-Martín et al., 2009). Further evidence for a LLAGN in B1 comes from the study of mid-infrared (MIR) high-excitation emission lines (Alonso-Herrero et al., 2009). Hence, one of the five VLBI components reported by Ulvestad (2009) (without considering that one corresponding to the 2005 event) is a candidate for being the LLAGN. Each one of these sources has a flux density mJy at both 8.4 and 2.3 GHz, typical for LLAGN. In the event that one of these sources is the AGN, and even if it were to display the highest inter-year variability that has ever been observed from LLAGN (Nagar et al., 2002), the corresponding burst will have a flux density , thus being below our detection limit. Therefore, we find no evidence for any of the detected events to be linked to AGN activity.
We consider next the possibility of explaining the nuclear variability in 1993, 2001 and 2005 (epochs 3–5, 8 and 13–14) as resulting from supernova explosions. Note that the scarcity of data available makes it challenging to properly determine the physical parameters that describe the variability we have detected. Nevertheless, we can identify certain properties in each event by examining their rise and fall in the light curve (Figures 2 and 2). Moreover, if we plot the peak spectral luminosity versus the time after the explosion date to reach the peak (as was done for SN2000ft by Alberdi et al., 2006), we will find that the events considered here, have typical values for moderately luminous type Ib/c and II SNe (see Figure 3).
| Event | |||
|---|---|---|---|
| (mJy) | (1027 ) | (years) | |
| 1993 | 2.210.66 | 5.311.58 | 2 |
| 2001 | 2.400.66 | 5.761.58 | 1.3 |
| 2005 | 7.200.90 | 17.292.16 | 1.5 |
A couple of assumptions must be made. First of all, we consider the peak flux density of the events () as the difference between the flux density at the peak epoch (as seen in Figures 2 and 2), and the characteristic baseline value of the B1-nucleus ( mJy), which we consider as the flux density of the nucleus in its quiescent state. Secondly, we take half the time between the rise and fall in the light curve as the time it takes for each of the putative SNe to reach their peak after the explosion date (). Since each event is poorly sampled we can, as a coarse approach, consider their peak flux densities only as lower limits, and their time to reach the peak as upper limits. We summarize these two assumptions for each putative SN event in Table 5.
From Table 5, we see that the peak flux densities of the B1-nucleus corresponding to the 1993 and 2001 events, are above 2.2 mJy. At the distance of Arp 299 these flux densities correspond to luminosities of the order of a few times , which are typical for type Ib/c or moderately luminous type II SNe, as we can also see in Figure 3. The 2005 event is more luminous than the others and similar to the most luminous type II RSNe observed, e.g., SN 1986J and SN 1988Z. In the following, we discuss each event separately:
-
•
1993 event (epochs 3–5). This event exhibits an extremely slow rise and relatively fast fall. Typical RSNe do not display such behaviour. If a single SN is responsible for the increase in flux, it must have reached its peak between epochs 3 and 4 (thus having a flux density peak higher than that of epoch 4). A change of the circumstellar medium (CSM) profile could explain the changing slope in its optically thin phase. In this case, we assume that the putative SN has exploded some time after epoch 2 and has reached its peak some time between epochs 3 and 4, therefore being characterised by years and . These values for and are expected from moderately luminous type Ib/c or type II SNe, as we see in Figure 3.
-
•
2001 event (epoch 8). This event is characterised by 1.3 years (obtained by taking half of the time between epochs 7 and 9) and . This corresponds most likely to a type Ib/c or a moderately luminous type II SN (following the same criteria as before).
-
•
2005 event (epochs 13th–14th). This event corresponds to the appearance of a new compact source (SN) in the innermost nuclear region of B1, as detected with VLBI observations by Ulvestad (2009). The VLA observations we present here, cover just the beginning of the rise of this event, therefore allowing us to solely estimate lower limits to its peak luminosity and time to reach the peak (see Table 5). Yet, we can still place this event among the most luminous RSNe known to date (Figure 3).
Unfortunately, Arp 299 was not observed with the VLA at X-band between 1994 and 1999 and we cannot search for new SN explosions in the B1-nucleus during that period. Hence, we divide our analysis in two periods: the first one from February 1990 to May 1994 (hereafter P1), and the second from October 1999 to April 2006 (P2). This is equivalent to one period of 4.2 yr and another of 6.5 yr.
Event 1993 in P1, as well as events 2001 and 2005 in P2, can all be explained by RSNe. We note that the RSN type of each event is poorly determined due to the coarse and uneven sampling of the light curve. Only a more frequent sampling could provide the necessary information to characterise each event, as was done for SN 2008iz in M82 Marchili et al. (2010). We could solely state that due to the substantial difference in lifetime of type Ib/c and bright type II SNe, our events are likely to be type II SNe rather than type Ib/c. Nevertheless, the mere identification of events to have a CCSN origin, allows us to estimate the CCSN rate.
4.3 The CCSN rate in nucleus B1
We now want to obtain an estimate for the over the years (P1P2) comprised in our study. In order to do this, we assume that the SN events detected in B1 are independent and occur at a constant rate over time, thus obeying Poisson statistics. Consequently, the uncertainty on this number is .
In the case of P1, with one RSN (1993 event), we have yr-1. For P2, where there are two detections (2001 and 2005 events), we have yr-1. We then calculate a total for the 11 years comprised in our study by taking the average of the P1 and P2 estimates, which yields a final yr-1.
Our variability test leads us to a estimate which, within the uncertainties, agrees with the IR luminosity based SN rate estimate, as well as with previous radio-based estimates (see Table 2). We remark, however, that our estimate can only represent a lower limit due to our detection threshold. Event 1993 is only slightly above such limit, and we see from Figure 3 that fainter (as well as more rapidly evolving) SNe than the one responsible for the 1993 event, are deemed to remain as non-detections through this variability test. We probably miss most type Ib/c and all type IIP SNe, which represent about 36% (Li et al., 2011) and 59% (Smartt et al., 2009), respectively, of all CCSNe in a volume-limited sample (see Figure 3). Thus, the total should be significantly higher than our estimate, unless the IMF is a top-heavy one favouring the production of the most massive stars, and the surrounding environment is dense enough, so that a large fraction of the SN explosions will turn into bright radio sources. For instance, Chevalier & Fransson (2001) have shown that the high molecular cloud densities in the nuclear regions of galaxies undergoing bursts of star formation (e.g., M82), can account for the high radio luminosity of the SNRs therein. This is also the case for the luminous RSNe in Arp 220, which Parra et al. (2007) have found to be consistent with powerful type IIn SNe interacting with their dense CSM. In fact, the rate of appearance of the luminous RSNe in Arp 220 agrees with the rate of SNe per year found by Lonsdale et al. (2006), which implies a SFR high enough to power the entire of the galaxy. Therefore, if the gas densities surrounding the SNe in Arp 299-B1 are high enough, our estimate could be close to the true CCSN rate. This result is not surprising if we consider that already from the EVN observations of the A-nucleus, Pérez-Torres et al. (2009) found that its might be much higher than previous estimates, thus suggesting that a top-heavy IMF could describe better the observations of the nuclear starburst in Arp 299-A. We might well be facing the same situation here for the B1-nucleus. In fact, a recent study of the properties of the sample of optical/NIR detected SNe in the circumnuclear regions of Arp 299, also indicates an IMF possibly biassed toward high mass stars in the system (Anderson et al., 2011).
However, the population of SNe within the innermost pc of the nuclei of Arp 299 can be quite different from the one within 1–4 kpc distances from the nuclei of Arp 299 that Anderson et al. have studied, due to the difference in the ambient conditions, which could lead to different IMFs (see e.g. Chevalier & Fransson, 2001). Therefore, in the future the combined use of high spatial resolution radio and near-IR observations in the detection and study of the population of SNe within the LIRG innermost nuclear regions is crucial in order to better constrain their star formation properties.
4.4 Caveats and limitations of our variability test
We have presented a variability test that covers a period of years (P1 P2), with 14 data points. This corresponds to a typical sampling rate of 1.3 observations per year, and a typical time interval between observations of months (considering P1 and P2 separately); although we acknowledge that the sampling is very uneven.
The typical time interval between observations in our study makes the detection of type Ib/c SNe difficult, as they decay fast at radio wavelengths, having short lifetimes that range between a few days, up to a few months (see e.g., Weiler et al., 2002). It is thus impossible to resolve individual type Ib/c SNe occurring within an 11 months period. However, it is not impossible to detect them, if we are fortunate enough to have an observation at around the time of their luminosity peak. This is of course not very likely and our detection threshold (see Figure 3) makes our test blind to practically all type Ib/c SNe (as we have discussed in §4.3), for the given sample.
For type II SNe the situation is different. Although a coarse and uneven sampling does not allow an identification of the SN subtype (IIP, IIL, IIb, IIn), both the sensitivity and the frequency of our sampling, favour the detection of bright and long-lasting events. For instance, SN 2000ft in a LIRG host galaxy (NGC 7469) at 70 Mpc distance, with a peak luminosity of almost , was clearly visible in VLA observations over a period of 4 years (Pérez-Torres et al., 2009). Furthermore, an event like SN 2000ft, could be covered by four of our observations (with a typical separation of months). In fact, having at least three observations covering the light curve, would be required for its minimum sampling. This is fulfilled in the case of the B1-nucleus for long-lasting events. However, in the case of nucleus A the identification of RSNe is more challenging than in the case of B1 due to our current sampling characteristics, in addition to the sensitivity threshold which allows only the detection of very bright events. According to IR luminosity based estimates, the SN rate of nucleus A ( yr-1) is about twice that of B1. A sampling rate of 1.3 observations per year is clearly not optimal to probe the RSNe activity in nucleus A, for which we could often have overlapping events.
5 Searching for NIR counterparts of radio supernovae in Arp 299-A
NIR observations towards nuclei A and B1 were carried out with the Gemini-North Telescope in the K-band () under the program “Altair Study of Supernovae in Luminous Infrared Galaxies” (P.I.: S. Ryder). Our NIR observations of Arp 299-B1 will be reported elsewhere and here we concentrate on the analysis of the NIR data of nucleus A.
In the previous section we have estimated the radio SN rate for the B1-nucleus and pointed out that SN detections in the A-nucleus—unless extremely radio luminous SNe, like SN 1998bw—are feasible only by means of VLBI observations, at radio wavelengths, or by NIR observations with high resolution. We then consider the EVN observations carried out in April and December 2008 by Pérez-Torres et al. (2009), revealing young RSN candidates within the nucleus A. Aiming at finding the NIR counterparts for these objects, we analysed our contemporaneous (June 2008) NIR adaptive optics (AO) Gemini-N observations.
We used the Near-InfraRed Imager (NIRI) with the ALTAIR Laser Guide Star AO system (0.022 arcsec/pixel, FWHM0.1 arcsec) for the two observations (see Table 6) in this study. The obtained images were reduced using the NIRI package in IRAF V2.14. Before median combining the target images, we subtracted the inherent horizontal noise pattern of the NIRI images.
| UT date | Program | Exposure Time (s) |
|---|---|---|
| 2008 Jun 20.3 | GN-2008A-Q-38 | 830 |
| 2010 May 04.8 | GN-2010A-Q-40 | 830 |
The World Coordinate System (WCS) for the NIRI images with a small field of view ( arcsec) was obtained in an iterative way. We first calibrated the WCS of an SDSS i-band image using 28 point-like sources from the 2MASS catalogue. Having a total of 51 2MASS sources in the SDSS field, we rejected 23 which were either elongated, too faint, too close to another object to be blended, and/or located on corrupted pixels regions of the images.
The SDSS i-band image was then transformed to an HST ACS J-band image (obtained as already calibrated from the HST science archive) using nine common sources between the two images. As a final step, we transformed the HST image to the images of the A-nucleus obtained with the Gemini-N telescope. For doing this, we used 20 sources. In all the steps we used a simple geometric transformation for the coordinates, which included shifts in x and y as well as the same scaling factors and rotation in x and y. The propagation of uncertainties between the different alignment steps yielded a total RMS of approximately 0.1 arcsec (see Table 7).
| Transformation | RMS (arcsec) |
|---|---|
| WCS of SDSS | 0.090 |
| SDSS to HST | 0.056 |
| HST to Gemini-N | 0.023 |
| Combined uncertainty | 0.1085 |
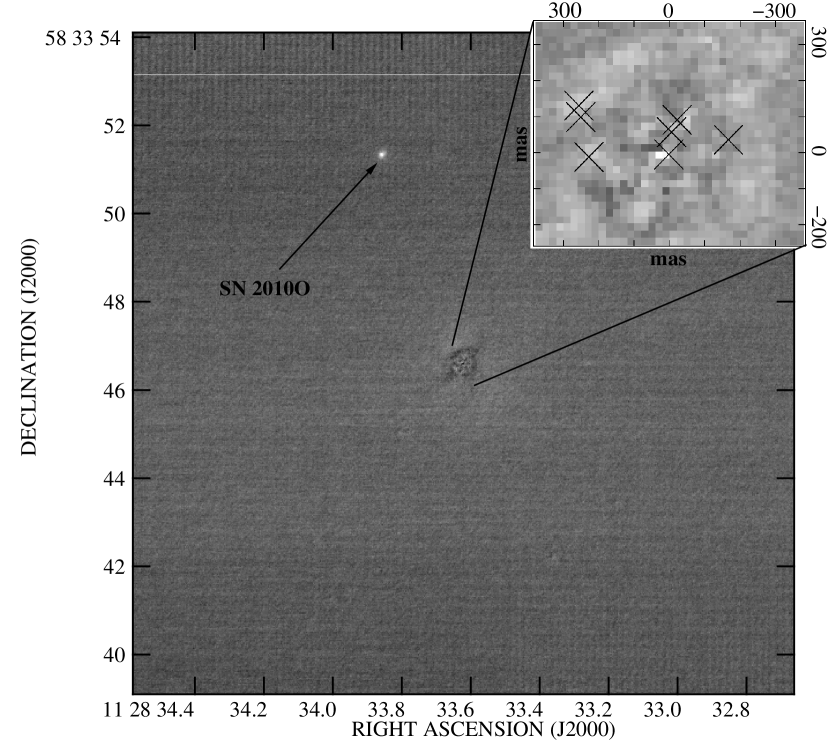
The centroid position (J2000) of nucleus A as measured in the WCS calibrated Gemini-N image using IRAF is 11h28m3362, 58°33′466 (see deep image in Figure 4). The distance between the NIR A-nucleus and its radio counterpart (see Table 1) is 0.103 arcsec, so that both positions are coincident within 1.
5.1 SN detection in NIR images
We have used a difference imaging technique based on the Optimal Image Subtraction (OIS) code (Alard & Lupton, 1998), and already demonstrated to work in SN detection in NIR AO images of LIRGs (Mattila et al., 2007). Having transformed the image from the epoch of interest (20 June 2008) to our reference image from 2010 May 4, we then selected 19 regions around suitable bright objects for deriving a convolution kernel that is later used to match the point-spread function (PSF) of our reference image to the PSF of the other image before performing the image subtraction. To obtain a successful subtraction, we had to include also the nucleus itself in these regions, given its outstanding brightness compared to the other objects in the image.
The FWHM of the A-nucleus is about 0.4 arcsec in our Gemini-N images. To obtain a satisfactory subtraction result we used arcsec for the size of the regions involved in the kernel solution. This is large enough to cover well the diffraction limited core of the PSF (whereas the much wider PSF wings are hidden in the noise for most of the sources present in our images). Regions substantially smaller than this did not result in a smooth subtraction for the regions around the bright nucleus. As a result of this, the detection of SNe falling within the innermost mas radius region is not feasible using these techniques (see Figure 4).
EVN radio images by Pérez-Torres et al. (2009) have approximately 10 times better resolution than that of our NIR AO observations. Thus, the resolution of these NIR observations is not high enough, such that we could expect to be able to detect objects as deep in the LIRG nucleus as in the EVN observations. In addition, SN detections in the NIR domain might also be hindered by the high extinction towards the SNe. However, not all the CCSNe produce radio emission strong enough to be detectable at the distance of the nearest LIRGs. Hence, we have investigated the limiting magnitude for our NIR SN detection ability at different distances from the centre of the nucleus A.
5.2 SN detection threshold in the A-nucleus
We have simulated SNe of different magnitudes at different distances from the centre of the nucleus A in our 2008 June 20 image using the IRAF MKOBJECTS task. Unfortunately, there are no bright field stars in our Gemini-N images (FOV arcsec) that can be used to model the complicated PSF. Therefore, for the fake supernovae a moffat profile with a beta parameter of 2.5 and FWHM of arcsec was used. We found this to give a reasonable match with the diffraction limited part of the PSF whereas for the faint sources the much wider PSF wings disappear within the noise.
After the matching and subtraction of the reference image for each simulation, we checked if the simulated source could be detected significantly (more than ) above the subtraction residuals within the nuclear regions. The level of the noise introduced by the subtraction residuals was determined as the standard deviation of the aperture sums (using a small radius of arcsec) for 49 apertures placed in a grid covering the innermost arcsec nuclear region. We obtained a photometric calibration for our Gemini-N images, with too small a FOV to include any 2MASS stars, making use of the HST photometry for several compact circumnuclear super star clusters (A1–A6) reported by Alonso-Herrero et al. (2000) and converted to the standard K-band. We estimated our SN detection threshold by simulating (one at a time) and recovering eight artificial SNe of a given magnitude, distributed at different locations, at a mas distance from the centre of the nucleus A (or pc projected distance). By repeating the simulation for a range of magnitudes, we found a limiting magnitude of 18.5 (estimating our calibration to be accurate to mag) for our SN detection. Inside this radius our method was not sensitive for the detection of highly obscured SNe. Note that the limiting magnitude we have found is similar to the magnitude of SN 2004ip discovered with the VLT/NACO in IRAS 182933413 (Mattila et al., 2007).
We tested our SN detection ability also in the circumnuclear regions where no strong image subtraction residuals are present. For this the level of noise was first determined as the standard deviation of aperture fluxes for 45 apertures ( arcsec radius, – arcsec sky annulus) placed along a circumference at 1 arcsec distance from the centre of the nucleus A. Again, by simulating and recovering 12 artificial SNe of a given magnitude distributed at different locations along the same circumference, we found a limiting magnitude of .
From the template light curves for ordinary CCSNe provided by Mattila & Meikle 2001, we adopt and a decline rate of mag/day after the peak. At the distance of Arp 299, this corresponds to at the maximum light. We would therefore be able to detect such a SN suffering from a visual extinction of up to (similar to the extinction found in our study for SN 2008cs in the circumnuclear regions of a LIRG) at mas from the centre of nucleus A, still at three months from the maximum light. In the case of a slowly declining (SNe 1979C and 1998S-like) supernova, for which , the apparent magnitude at the distance of Arp 299 becomes at the maximum light. Thus the visual extinction towards such a SN could be as high as about 30 magnitudes and still detectable at mas from the centre of the nucleus A, three months after the maximum. At a larger distance ( arcsec or pc projected distance) from the centre of the nucleus, our observations were sensitive to an ordinary CCSN with , or slowly declining CCSN with over 40.
At radio frequencies there is no dust extinction, and a supernova will appear bright when the interaction between the SN ejecta and the CSM is strong enough, i.e., when the CSM is dense enough. However, at NIR wavelengths, all types of supernova events should be visible as long as the visual extinction is not too high. Therefore, supernovae in the less extinguished circumnuclear regions could be more easily detected at NIR wavelengths than at radio frequencies, while the opposite is true when dealing with objects within the innermost nuclear regions.
6 Discussion and summary
We have used VLA archival data to estimate the radio SN rate in the nearby LIRG Arp 299. The wealth of data available for Arp 299 in the VLA archive, makes this galaxy a unique target to perform such studies.
We have used the variability of the nuclear radio flux density to probe the RSN activity in the absence of high-angular resolution VLBI observations. The radio flux densities of the nuclei A and B1 within Arp 299, result from the contribution of several compact sources located in the innermost nuclear regions, along with diffuse emission. In the case of nucleus A, we see that its flux density remains constant within the observational uncertainties throughout the time interval we have studied here. This is consistent with Ulvestad (2009) claim that for this nucleus, the integrated flux density of the compact sources within the nucleus, is only about 20% of the total flux density seen at lower resolution. The rest is diffuse emission of the galaxy itself.
Nevertheless, in the case of the B1-nucleus, small variations in flux density due to new supernovae can be distinguished from the total nuclear flux density at VLA resolution, or the SNe can even dominate it, as seen in the case of the 2005 event. In fact, we have been able to indirectly detect three radio luminous SNe within the B1-nucleus, thus estimating a radio SN rate for B1 of yr-1. This estimate is in good agreement with the IR luminosity based SN rate estimate, and also with values obtained through other methods at radio wavelengths. The remarkable difference between our estimate and those obtained in other studies is that here, we have estimated the SN rate by directly identifying the RSN activity within the B1-nucleus, which is not possible at other wavelengths. Note that the fact that any putative AGN is extremely weak (as suggested by VLBI observations), allow us to interpret flux density variations as being due to (recently) exploded SNe and marginally trace their light curve evolution. We note that also Marchili et al. (2010) were able to identify and characterise SN 2008iz, within the nuclear regions of the nearby starburst galaxy M82, by carefully removing the diffuse nuclear emission and fitting the resultant SN light curve.
Although our flux density variation method is not very sensitive in the case of bright nucleus such as Arp 299-A, where the diffuse emission dominates the overall radio flux density, it is well suited to be applied to sources like Arp 299-B1, which at a distance of 44.8 Mpc has a luminosity around , thus being bright enough to provide a high RSN rate, but faint enough to enable their detection through flux density variations.
The detection of new SNe in Arp 299-A through this method (based on VLA measurements) is a challenging task: i) given the expected IR luminosity based SN rate, a fine sampling of the light curve is needed; ii) due to the brightness of the nucleus, new RSNe should have to become 5 detections.
Moreover, in the case of the A-nucleus, the expected typical RSN flux densities are comparable with the uncertainties in the nuclear flux density, making the SN detection impossible, unless very bright SNe (such as powerful type IIn or 1998bw-like events) occur. To overcome this situation, we have also tested the possibility of using high-resolution NIR AO observations for the detection of SNe within the innermost nuclear regions of Arp 299-A. However, we were unable to detect any new SNe. Our estimated limiting magnitude for the SN detection at mas (or 70 pc projected distance) from the centre of the nucleus A would allow the detection of typical CCSNe suffering from extinctions of up to mag. At a larger offset from the nucleus (of 1 arcsec, or 200 pc projected distance) our observations were sensitive to typical CCSNe with up to mag.
The VLA epochs included in our sample were observed for different purposes and thus have different quality (i.e., sensitivity and resolution). Hence, a variability test that yields proper SN identifications through a correct light curve sampling has not been possible. The ideal case would be to have a specific observing program which provides homogeneity in the observed frequency, resolution, and having a regular time span between observations of the same source. The EVLA represents a very good instrument to achieve these goals. However, its changing configuration represents a changing resolution through the year, and thus a finer sampling that allows the identification of type Ib/c SNe is again compromised. The upcoming eMERLIN, with a very high sensitivity and resolution, provides the best option to carry out this kind of studies.
Our work has emphasized the importance of extinction-free measurements of the SN activity within the innermost nuclear regions of LIRGs. The SNe in the innermost nuclear regions of Arp 299 have been practically missed by the optical and NIR studies due to the high extinction therein and the lack of sufficient angular resolution. We have shown that at radio frequencies, with relatively high-angular resolution, it is possible to detect SNe buried deep in the LIRG nucleus. Determining the complete CCSN rates in local LIRGs is of great importance also for interpreting the result of the CCSN searches at higher redshifts used to trace the SFRs as a function of redshift.
Acknowledgements
The authors thank Rob Beswick and Kaj Wiik for useful comments and discussions. We acknowledge the careful review of the anonymous referee whose comments have significantly improved our paper. CRC, AA and MAPT are thankful to the Spanish MICINN for support through grant AYA2009-13036-CO2-01. SM acknowledges financial support from the Academy of Finland (project: 8120503). EK acknowledges financial support from the Finnish Academy of Science and Letters (Vilho, Yrjö and Kalle Väisälä Foundation). This paper is based on observations with the Very Large Array (VLA) of the National Radio Astronomy Observatory (NRAO)—the NRAO is a facility of the National Science Foundation operated under cooperative agreement by Associated Universities, Inc.—, and on observations obtained at the Gemini Observatory, which is operated by the Association of Universities for Research in Astronomy, Inc., under a cooperative agreement with the NSF on behalf of the Gemini partnership: the National Science Foundation (United States), the Science and Technology Facilities Council (United Kingdom), the National Research Council (Canada), CONICYT (Chile), the Australian Research Council (Australia), Ministério da Ciência e Tecnologia (Brazil) and Ministerio de Ciencia, Tecnología e Innovación Productiva (Argentina).
References
- Aalto et al. (1997) Aalto S., Radford S. J. E., Scoville N. Z., Sargent A. I., 1997, ApJ, 475, L107+
- Alard & Lupton (1998) Alard C., Lupton R. H., 1998, ApJ, 503, 325
- Alberdi et al. (2006) Alberdi A., Colina L., Torrelles J. M., Panagia N., Wilson A. S., Garrington S. T., 2006, ApJ, 638, 938
- Alonso-Herrero et al. (2009) Alonso-Herrero A., Rieke G. H., Colina L., Pereira-Santaella M., García-Marín M., Smith J., Brandl B., Charmandaris V., Armus L., 2009, ApJ, 697, 660
- Alonso-Herrero et al. (2000) Alonso-Herrero A., Rieke G. H., Rieke M. J., Scoville N. Z., 2000, ApJ, 532, 845
- Anderson et al. (2011) Anderson J. P., Habergham S. M., James P. A., 2011, MNRAS, 000, 00
- Baars et al. (1977) Baars J. W. M., Genzel R., Pauliny-Toth I. I. K., Witzel A., 1977, A&A, 61, 99
- Ballo et al. (2004) Ballo L., Braito V., Della Ceca R., Maraschi L., Tavecchio F., Dadina M., 2004, ApJ, 600, 634
- Casoli et al. (1999) Casoli F., Willaime M., Viallefond F., Gerin M., 1999, A&A, 346, 663
- Charmandaris et al. (2002) Charmandaris V., Stacey G. J., Gull G., 2002, ApJ, 571, 282
- Chevalier & Fransson (2001) Chevalier R. A., Fransson C., 2001, ApJ, 558, L27
- Fixsen et al. (1996) Fixsen D. J., Cheng E. S., Gales J. M., Mather J. C., Shafer R. A., Wright E. L., 1996, ApJ, 473, 576
- Forti et al. (1993) Forti G., Boattini A., Tombelli M., Herbst W., Vinton G., 1993, IAU Circ., 5719, 3
- González-Martín et al. (2009) González-Martín O., Masegosa J., Márquez I., Guainazzi M., Jiménez-Bailón E., 2009, A&A, 506, 1107
- Huang et al. (1990) Huang Z. P., Condon J. J., Yin Q. F., Thuan T. X., 1990, IAU Circ., 4988, 1
- Jha et al. (1999) Jha S., Garnavich P., Challis P., Kirshner R., Calkins M., Koranyi D., 1999, IAU Circ., 7089, 2
- Kankare et al. (2011) Kankare E., Mattila S., Ryder S., 2011, The Astronomer’s Telegram, 3245,
- Kankare et al. (2008) Kankare E., Mattila S., Ryder S., Pérez-Torres M., Alberdi A., Romero-Canizales C., Díaz-Santos T., Väisänen P., Efstathiou A., Alonso-Herrero A., Colina L., Kotilainen J., 2008, ApJ, 689, L97
- Leonard & Cenko (2005) Leonard D. C., Cenko S. B., 2005, The Astronomer’s Telegram, 431, 1
- Li et al. (2011) Li W., Chornock R., Leaman J., Filippenko A. V., Poznanski D., Wang X., Ganeshalingam M., Mannucci F., 2011, MNRAS, pp 317–+
- Li et al. (1998) Li W., Li C., Wan Z., Filippenko A. V., Moran E. C., 1998, IAU Circ., 6830, 1
- Lonsdale et al. (2006) Lonsdale C. J., Diamond P. J., Thrall H., Smith H. E., Lonsdale C. J., 2006, ApJ, 647, 185
- Maiolino et al. (2002) Maiolino R., Vanzi L., Mannucci F., Cresci G., Ghinassi F., Della Valle M., 2002, A&A, 389, 84
- Marchili et al. (2010) Marchili N., Martí-Vidal I., Brunthaler A., Krichbaum T. P., Müller P., Liu X., Song H., Bach U., Beswick R., Zensus J. A., 2010, A&A, 509, A47+
- Mattila & Kankare (2010) Mattila S., Kankare E., 2010, Central Bureau Electronic Telegrams, 2145, 1
- Mattila et al. (2010) Mattila S., Kankare E., Datson J., Pastorello A., 2010, Central Bureau Electronic Telegrams, 2149, 1
- Mattila & Meikle (2001) Mattila S., Meikle W. P. S., 2001, MNRAS, 324, 325
- Mattila et al. (2005) Mattila S., Monard L. A. G., Li W., 2005, IAU Circ., 8473, 2
- Mattila et al. (2007) Mattila S., Väisänen P., Farrah D., Efstathiou A., Meikle W. P. S., Dahlen T., Fransson C., Lira P., Lundqvist P., Östlin G., Ryder S., Sollerman J., 2007, ApJ, 659, L9
- Modjaz et al. (2005) Modjaz M., Kirshner R., Challis P., Berlind P., 2005, IAU Circ., 8475, 2
- Nagar et al. (2002) Nagar N. M., Falcke H., Wilson A. S., Ulvestad J. S., 2002, A&A, 392, 53
- Neff et al. (2004) Neff S. G., Ulvestad J. S., Teng S. H., 2004, ApJ, 611, 186
- Newton et al. (2010) Newton J., Puckett T., Orff T., 2010, Central Bureau Electronic Telegrams, 2144, 2
- Parra et al. (2007) Parra R., Conway J. E., Diamond P. J., Thrall H., Lonsdale C. J., Lonsdale C. J., Smith H. E., 2007, ApJ, 659, 314
- Perez-Torres et al. (2008) Perez-Torres M., Romero C., Alberdi A., Colina L., Alonso-Herrero A., Diaz Santos T., Mattila S., Kankare E., Ryder S., 2008, Central Bureau Electronic Telegrams, 1392, 2
- Pérez-Torres et al. (2009) Pérez-Torres M. A., Alberdi A., Colina L., Torrelles J. M., Panagia N., Wilson A., Kankare E., Mattila S., 2009, MNRAS, 399, 1641
- Pérez-Torres et al. (2010) Pérez-Torres M. A., Alberdi A., Romero-Cañizales C., Bondi M., 2010, A&A, 519, L5+
- Pérez-Torres et al. (2007) Pérez-Torres M. A., Mattila S., Alberdi A., Colina L., Torrelles J. M., Väisänen P., Ryder S., Panagia N., Wilson A., 2007, ApJ, 671, L21
- Pérez-Torres et al. (2009) Pérez-Torres M. A., Romero-Cañizales C., Alberdi A., Polatidis A., 2009, A&A, 507, L17
- Prosperi (1999) Prosperi E., 1999, IAU Circ., 7094, 2
- Qiu et al. (1999) Qiu Y. L., Qiao Q. Y., Hu J. Y., Li W., 1999, IAU Circ., 7088, 2
- Ryder et al. (2010) Ryder S., Kankare E., Mattila S., 2010, Central Bureau Electronic Telegrams, 2286, 1
- Ryder et al. (2010) Ryder S., Mattila S., Kankare E., Perez-Torres M., 2010, Central Bureau Electronic Telegrams, 2189, 1
- Sanders et al. (2003) Sanders D. B., Mazzarella J. M., Kim D., Surace J. A., Soifer B. T., 2003, AJ, 126, 1607
- Sanders & Mirabel (1996) Sanders D. B., Mirabel I. F., 1996, Annual Review of Astron and Astrophys, 34, 749
- Smartt et al. (2009) Smartt S. J., Eldridge J. J., Crockett R. M., Maund J. R., 2009, MNRAS, 395, 1409
- Soifer et al. (2001) Soifer B. T., Neugebauer G., Matthews K., Egami E., Weinberger A. J., Ressler M., Scoville N. Z., Stolovy S. R., Condon J. J., Becklin E. E., 2001, AJ, 122, 1213
- Tarchi et al. (2011) Tarchi A., Castangia P., Henkel C., Surcis G., Menten K. M., 2011, A&A, 525, A91+
- Treffers et al. (1993) Treffers R. R., Leibundgut B., Filippenko A. V., Richmond M. W., 1993, IAU Circ., 5718, 1
- Tsvetkov (1994) Tsvetkov D. Y., 1994, Astronomy Letters, 20, 374
- Ulvestad (2009) Ulvestad J. S., 2009, AJ, 138, 1529
- van Buren et al. (1994) van Buren D., Jarrett T., Terebey S., Beichman C., Shure M., Kaminski C., 1994, IAU Circ., 5960, 2
- Weiler et al. (2002) Weiler K. W., Panagia N., Montes M. J., Sramek R. A., 2002, Annual Review of Astron and Astrophys, 40, 387
- Yamaoka et al. (1998) Yamaoka H., Kato T., Filippenko A. V., van Dyk S. D., Yamamoto M., Balam D., Hornoch K., Plsek M., 1998, IAU Circ., 6859, 1