The M81 Group Dwarf Irregular Galaxy DDO 165. II. Connecting Recent Star Formation with ISM Structures and Kinematics111Based on observations made with the NASA/ESA Hubble Space Telescope, obtained from the Data Archive at the Space Telescope Science Institute, which is operated by the Association of Universities for Research in Astronomy, Inc., under NASA contract NAS 5-26555.
Abstract
We compare the stellar populations and complex neutral gas dynamics of the M81 group dIrr galaxy DDO 165 using data from the HST and the VLA. Paper I identified two kinematically distinct H I components, multiple localized high velocity gas features, and eight H I holes and shells (the largest of which spans 2.2 1.1 kpc). Using the spatial and temporal information from the stellar populations in DDO 165, we compare the patterns of star formation over the past 500 Myr with the H I dynamics. We extract localized star formation histories within 6 of the 8 H I holes identified in Paper I, as well as 23 other regions that sample a range of stellar densities and neutral gas properties. From population synthesis modeling, we derive the energy outputs (from stellar winds and supernovae) of the stellar populations within these regions over the last 100 Myr, and compare with refined estimates of the energies required to create the H I holes. In all cases, we find that “feedback” is energetically capable of creating the observed structures in the ISM. Numerous regions with significant energy inputs from feedback lack coherent H I structures but show prominent localized high velocity gas features; this feedback signature is a natural product of temporally and spatially distributed star formation. In DDO 165, the extended period of heightened star formation activity (lasting more than 1 Gyr) is energetically capable of creating the observed holes and high velocity gas features in the neutral ISM.
1 Introduction
As stars evolve, the energies from stellar winds and supernova (SN) explosions (hereafter collectively referred to as “feedback”) are released into the surrounding interstellar material. The physics of this interaction is complex, with dependencies on (at least) the local neutral and molecular gas density and porosity, the local and total gravitational potential depth and shape, the intensity and duration of massive star formation (SF), and the metal content of the parent cloud. In a simplistic scenario, a single massive star forms and evolves, unleashing a characteristic energy of 1051 erg per SN event (Burrows, 2000). A fraction of this energy is converted into bulk motion of the surrounding material. This energy can be compared with the amount of energy required to move that same gas mass a certain distance within a given gravitational potential. If the feedback energy exceeds the requisite formation energy, then stellar evolution is capable of creating structures in the interstellar medium (ISM).
Scaling this simple single-star scenario up to bursts of SF, the conditions for the creation of macroscopic ISM features could be idealized in the case of an intense and rapid SF event (Mac Low & Ferrara, 1999). This would result in the simultaneous and coherent injection of feedback energy from multiple stars. One would expect to find coherent ISM structures, such as H I holes and shells, with remnant stellar clusters within; those cluster ages would in principle be similar to the age of the ISM feature that surrounds it.
Recent results have challenged this simplistic model. In systems littered with coherent H I structures (e.g., Holmberg II; see discussion in Weisz et al. 2009b), there are few instances of high surface brightness remnant clusters (see also Rhode et al. 1999). However, deep Hubble Space Telescope (HST) imaging reveals young stellar populations within all H I features; energy estimates based on spatially resolved star formation history (SFH) analyses show that the energy requirements for the creation of those ISM features is easily met by stellar winds and supernovae. Importantly, this energy is derived from SF spanning hundreds of Myr and encompassing multiple episodes of SF within a given region. A new scenario supported by recent work is one where the present-day morphology and dynamics of a given galaxy are the results of the cumulative SF over at least the past few hundred Myr.
The properties of the stellar populations in DDO 165 make it a particularly important test case for this model of the SF-ISM interaction. As the color HST image in Figure 1 shows, DDO 165 contains rich populations of luminous stars, both blue and red. The global color magnitude diagram (CMD; see Figure 2) derived from HST data shows that the system has been in a burst phase (defined as the SF rate at recent times exceeding the average past rate by more than factor of two) for more than 1 Gyr (see details in McQuinn et al., 2010). This easily exceeds the dynamical timescale (710 40 Myr) and is among the longest starburst episodes known to date in any dwarf galaxy. The recent (up to 500 Myr) SFH shows significant variations on timescales 50 Myr, including a precipitous drop in SF activity within the past 25 Myr (see detailed discussion below). Further, Bastian et al. (2011) find that DDO 165 has a long characteristic timescale for structure evolution in its stellar populations (at least 350 Myr; see further discussion below); once formed, stellar associations remain coherent for a large fraction of a dynamical timescale.
The neutral ISM dynamics of DDO 165 (see Cannon et al. 2011; hereafter Paper I) are equally intriguing in the context of the feedback model. The H I morphology is dominated by a giant H I hole (diameter 2.2 1.1 kpc) that is slightly offset from the center of the stellar distribution. Seven other H I holes are cataloged in Paper I; some of these have measurable expansion velocities, while others are static at the present time. The H I gas is concentrated in two kinematically distinct features: a southern, main component and a northern component that contains 15% of the total H I mass. Based on the H I data alone, we can exclude many potential origins for this kinematic discontinuity (e.g., coherent solid-body rotation; superposed or counter-rotating disks; turbulence), but both infall (i.e., interaction) and outflow (i.e., “blowout”) models remain viable. The southern H I component harbors multiple localized high velocity features, each of which spans up to 60 km s-1 in velocity space but is no larger than the H I beam width (430 pc).
Taken together, these peculiar properties of DDO 165 make it a promising laboratory for examining the effects of feedback on the surrounding interstellar material. To that end, the present work investigates the stellar populations throughout DDO 165, exploiting the spatially resolved HST data to study those populations associated with each of the features identified in the H I analysis of Paper I. In a broad sense, we seek to understand if spatially and temporally extended SF is capable of creating giant H I holes, high velocity gas features, and kinematically distinct gas components.
2 Observations and Data Reduction
DDO 165 was observed with the Very Large Array444The National Radio Astronomy Observatory (NRAO) is a facility of the National Science Foundation operated under cooperative agreement by Associated Universities, Inc. (VLA) in the H I spectral line during three observing sessions between November, 2006 and November, 2007 for program AC842 (P.I. Cannon). The treatment of these data, including reductions, handling and analyses, are described fully in Paper I.
DDO 165 was observed with the HST on March 17, 2006, as part of observing program GO-10605 (P.I. Skillman). The treatment and reduction of these images are discussed in detail in Weisz et al. (2008). Over 144,000 stars are measured using the DOLPHOT package (Dolphin, 2000); the 50% completeness levels are m28.0 (M0.3) and m27.2 (M1.1).
3 The Stellar Populations of DDO 165
3.1 Global Color-Magnitude Diagram
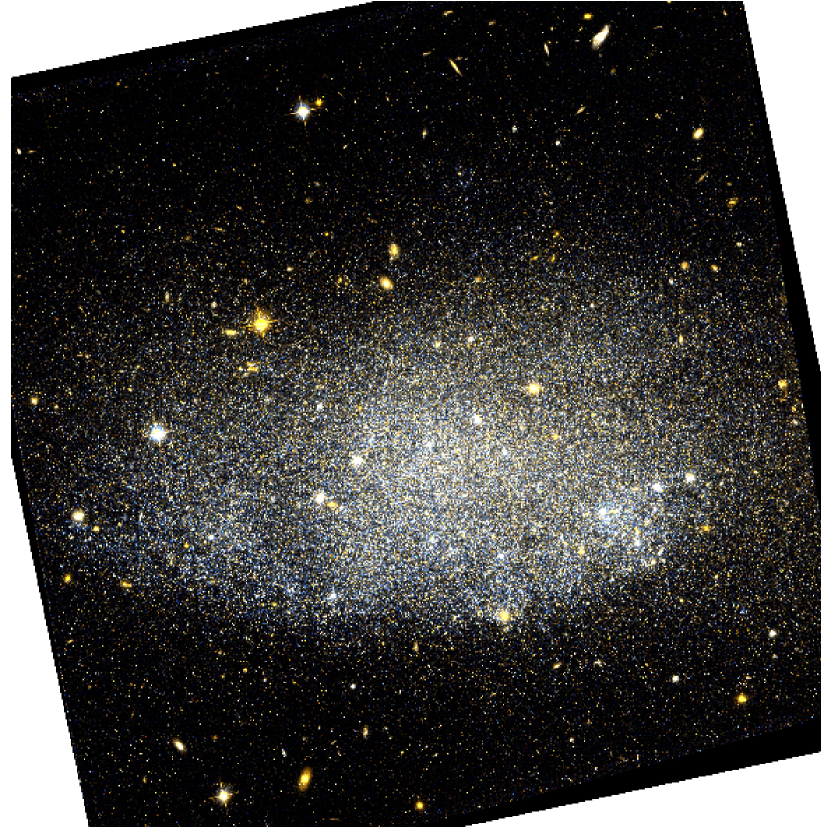
Figure 1 shows a color representation of the HST/ACS field of view of DDO 165. All of the high surface brightness stellar populations are covered by this single pointing. Note the pronounced truncation of the young stellar population in the southern region of the system (see also further discussion in § 4.1). The brightest objects in the field are Galactic foreground stars; other compact high surface brightness objects are stellar clusters within DDO 165 (see further discussion in § 3.3.3 below) or background galaxies.
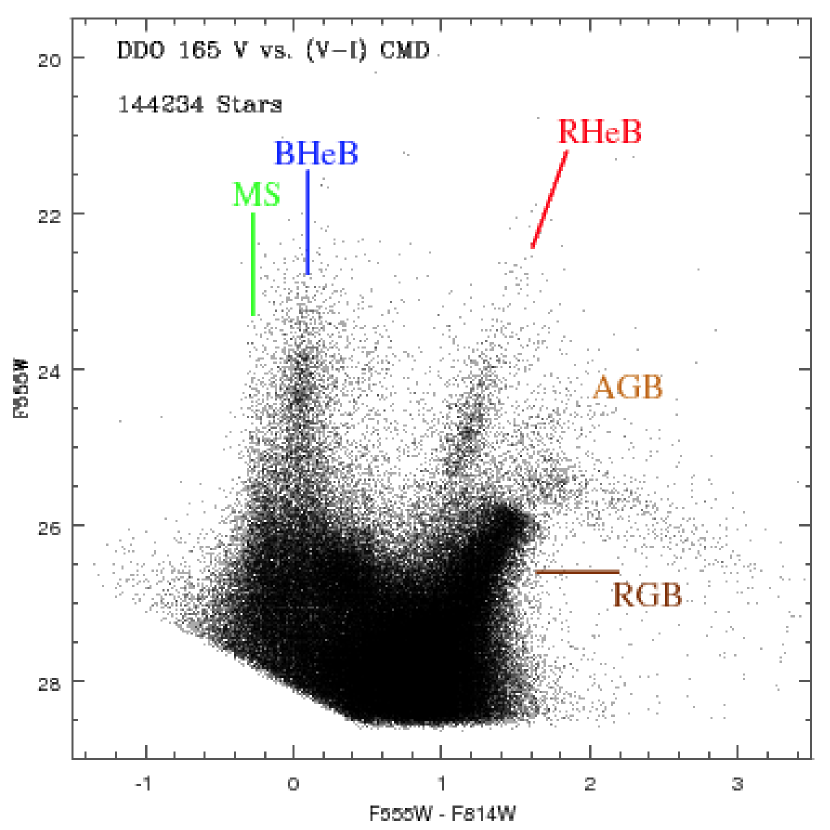
The V vs. (VI) CMD of all 144,234 stars within the HST/ACS field of view is shown in Figure 2. Five prominent stellar evolution phases are indicated: the main sequence (MS), the blue helium burning sequence (BHeB), the red helium burning sequence (RHeB), the asymptotic giant branch (AGB), and the red giant branch (RGB). Note the strengths of the BHeB and RHeB sequences compared to the MS. The BHeB is 2 magnitudes brighter than the MS at a given stellar age; thus, the prominence of the helium burning sequences suggests stronger SF in the recent past than at the current time.
In this work, we focus on the BHeB stars because of their unique relationship between age and absolute magnitude. As discussed in detail in Dohm-Palmer et al. (1997) and multiple works since then, the ages of BHeB stars increase as the absolute magnitude increases. Further, the age gradient becomes shallower for increasingly faint BHeB stars, resulting in degraded temporal resolution at larger look back times; for example, 10 Myr resolution is available back to 100 Myr, but 50 Myr time bins are required when going back to 500 Myr. The BHeB merges with the red clump at ages 600 Gyr; at larger lookback times, other regions of the CMD must be used. In the present work we concentrate on the most recent 500 Myr, during which the SFH is quite robust. The observed CMDs are discussed here and in § 3.2; these CMDs are modeled using maximum likelihood techniques to extract the intensity of SF over the last 500 Myr in § 3.3.
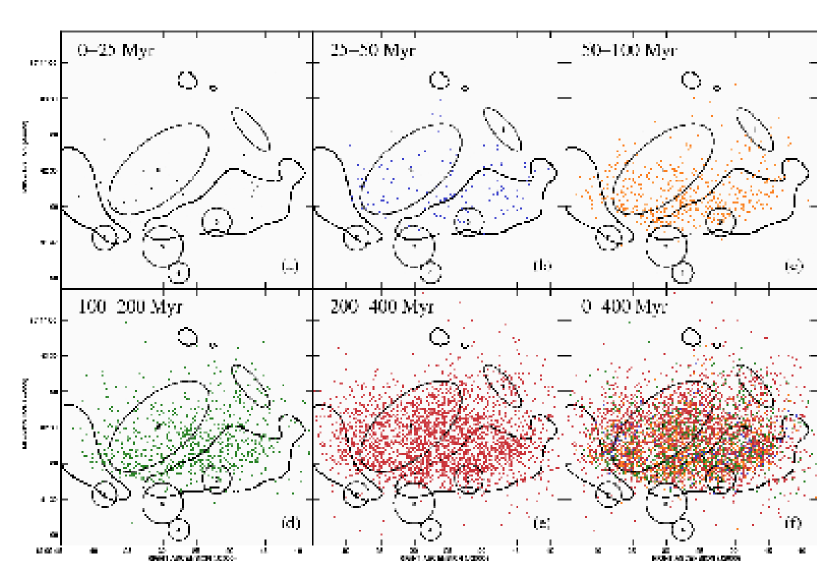
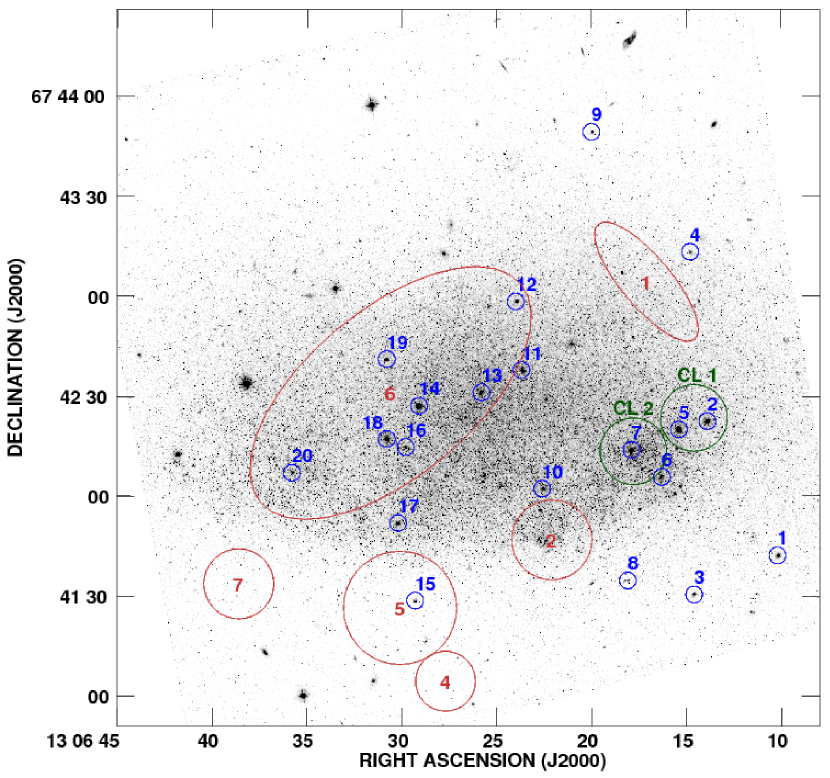
We begin to explore the rich information in the global CMDs by extracting the ages of BHeB stars in 5 coarse age bins: 0-25 Myr (though note that the BHeB sequence is insensitive to ages 10 Myr), 25-50 Myr, 50-100 Myr, 100-200 Myr, and 200-400 Myr. Since the positions of these stars are known, we can then plot the location of BHeB stars in each age bin to allow a simple snapshot of the patterns of SF within DDO 165 over the last few hundred Myr. Figure 3 shows this plot; the positions of BHeB stars of various ages are color-coded for clarity. Overlaid in black on each panel is the H I column density contour at the 1021 cm-2 level, as well as the locations of the six H I holes identified in Paper I that fall completely within the HST/ACS field of view (see more detailed discussion below).
Two important general features of the SF patterns in DDO 165 are apparent from Figure 3. First, the total number of BHeB stars rapidly increases when considering successively older age bins. 276 BHeB stars are measured in the 25-50 Myr time frame; this increases to 1,100 stars with ages between 50 and 100 Myr. This is partially due to IMF effects, but is also suggestive of a substantial SF event during the past 100 Myr, with more stars forming per unit area around 100 Myr ago than at the present time. Second, in all epochs older than 100 Myr, SF pervades the entire disk of DDO 165. This supports the spatially and temporally extended burst scenario described above. Figure 3 demonstrates that DDO 165 has a complex history of SF even over the most recent 500 Myr.
From Figure 2, the tip of the red giant branch (TRGB) occurs at mI 24.25 0.1. Assuming MI = 4.00.10 at the TRGB (Lee et al., 1993; Madore & Freedman, 1995; Bellazzini et al., 2001) and E(BV) 0.024 mag (Schlegel et al., 1998), the distance of DDO 165 derived from our HST data is in good agreement with the value found by Karachentsev et al. (2002) and adopted in Paper I, D 4.47 0.2 Mpc. We thus retain their distance estimate throughout the present work.
3.2 Color-Magnitude Diagrams of Stars in Selected Regions
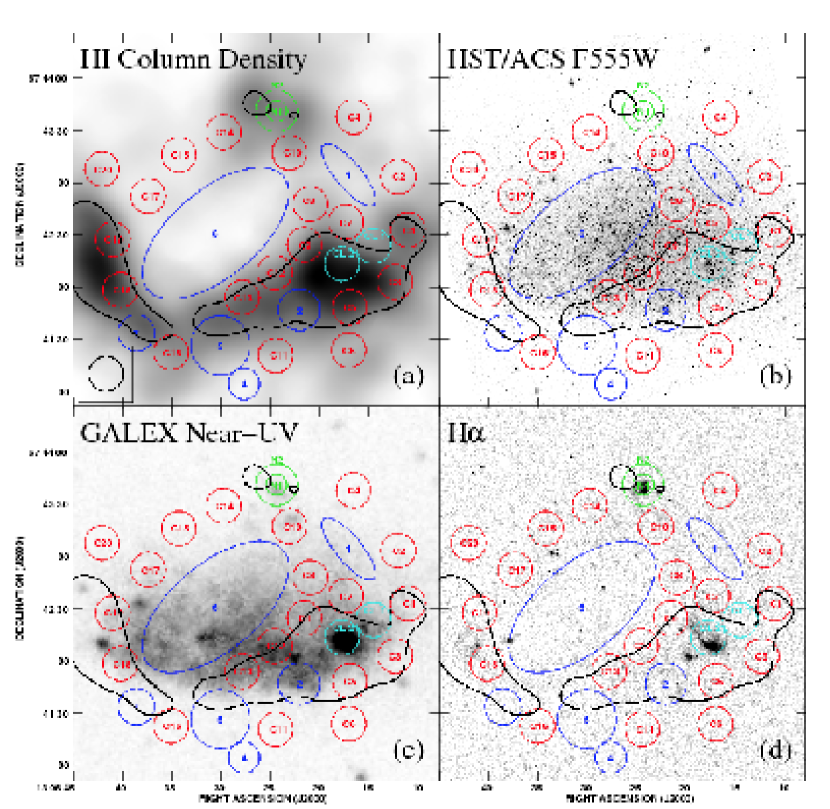
Figure 4 shows four images corresponding to the HST/ACS field of view: H I column density (see Paper I), HST V-band, GALEX near-UV (Gil de Paz et al., 2007), and continuum-subtracted H (see Paper I and Kennicutt et al. 2008). Overlaid on each panel is the H I column density contour at the 1021 cm-2 level. The largest H I column density (in the SW) is coincident with a high surface brightness stellar cluster in the UV image, as well as with the brightest H-emitting region. The H I peak in the SE region also has coincident UV and diffuse H emission. The northern H I feature is coincident with a compact H ii region and with a stellar association visible in both the HST and the GALEX images.
Paper I identified eight holes in the H I distribution of DDO 165 using radius-velocity and/or position-velocity analyses. Figure 4 shows six of those regions in blue, using the same numbering scheme as Paper I (Holes 3 and 8 from Paper I fall completely or partially outside the HST/ACS field of view); Table 1 summarizes the properties of these structures from Paper I. We seek to probe the SFHs of the stellar populations within these regions and to compare them with the SFHs extracted in other areas of DDO 165.
For comparison, we extracted the SFHs of 23 other regions within DDO 165. As shown in Figure 4, these regions sample a wide range of stellar and H I surface densities, H and UV surface brightnesses, and localized H I dynamics (compare with Paper I). We explicitly study the stellar populations associated with the northern H I component (shown in green in Figure 4 as “N1” and “N2”, and referred to as “Northern 1” and “Northern 2” below) and with two regions containing slightly resolved stellar clusters (shown in cyan in Figure 4 as “CL 1” and “CL 2”, and referred to as “Cluster 1” and “Cluster 2” below). Exterior to these regions and the H I holes, we then selected 20 control fields (shown in red in Figure 4 as “C1”–“C20”, and referred to as “Control 1” through “Control 20” below). All regions except for Northern 1 and Northern 2 have a diameter of 20″ (the size of the H I beam used in this analysis; 20″ 430 pc at our adopted distance); this choice is necessarily a compromise between region size and number of stars in the resulting CMDs. The 20″ size provides of order 1,000 stars in each CMD (sometimes many more) while allowing us to study a sizeable number of regions within DDO 165. The sizes of regions Northern 1 (12″ diameter) and Northern 2 (24″ diameter) are guided by eye to encompass the stellar association in the HST image.
Table 2 summarizes the names, positions and sizes of each of these regions. We extracted the photometry for those stars that lie within each region; the number of stars in each region, shown in Table 2, ranges from 261 (Northern 1) to 28,439 (Hole 6). These stars are used to construct the CMDs of each individual region shown in Figures 5 (H I holes, cluster regions, northern region), 6 (Control 1–10), and 7 (Control 11–20). The RGB is easily identified in all panels; the blue plume region, however, shows pronounced variations from one region to the next. These variations imply significant variations as a function of time of the locations of active SF throughout DDO 165.
3.3 Recent Star Formation Histories
The global and local CMDs described in § 3.1 and § 3.2 are modeled to obtain a best-fit SFH using a sophisticated maximum likelihood approach. We refer the reader to Dolphin (2002) for details, and provide a brief synopsis of the technique here. The stellar evolution models of Marigo et al. (2008) are used to construct synthetic CMDs, which are compared with the observed CMDs using a maximum likelihood approach. Given the large number of factors that contribute to the CMD of a composite stellar population (e.g., initial mass function, chemical evolution and SFR as functions of time, binary fraction, distance, crowding, foreground and differential extinction, and photometric completeness limits), certain properties are held fixed in the fitting routines. As in Weisz et al. (2008), for this analysis of DDO 165, the binary fraction (0.35), the IMF properties (standard power-law, x = 2.30, from 0.1 to 100 M⊙), the distance (4.47 Mpc), the foreground extinction (AF555W = 0.080; Schlegel et al. 1998), and the photometric completeness limits (mF555W = 28.0, mF814W = 27.2) are held constant. The program is then allowed to search other parameters to obtain the best fit, including internal extinction, metallicity per time bin, and the SF rate (SFR) per time bin. The metallicity is constrained to increase monotonically with time.
The results of this fitting routine provide the rate of SF and the chemical evolution as functions of time. As mentioned above, here we concentrate on the most recent 500 Myr, during which we have maximum temporal resolution via the well-populated BHeB sequence, and during which the chemical evolution of DDO 165 is minimal (e.g., Weisz et al. 2008 finds a change of 0.1 dex in metallicity between 0 and 1 Gyr). Errors on the SFR as a function of time are quantified by adding the systematic uncertainties from the stellar evolution isochrones and the statistical uncertainties from Monte Carlo tests in quadrature. Extensive discussion of the error budgets can be found in Dolphin (2002) and Weisz et al. (2008).
3.3.1 The Global Recent Star Formation History
Applying the CMD fitting routines described above to the global CMD shown in Figure 2 yields the SFH shown in Figure 8. Note that the time binning is nonlinear, with finer temporal resolution available for young stars in the upper BHeB and MS. The errors plotted include both systematic and statistical uncertainties.
As noted above and discussed in detail in McQuinn et al. (2010), DDO 165 hosts one of the longest-duration starbursts known to date (1 Gyr). Figure 8 verifies this temporally extended burst by comparing the recent SFR with SFR (dashed line), the average SFR of the entire galaxy averaged from 0 to 14 Gyr. Note that the SFR is higher throughout the most recent 500 Myr compared to the lifetime average SFR, indicating an ongoing starburst event.
Certain interesting features of the global SFH are apparent. First, the SFR varies by a factor of 2 during the last 500 Myr: during the intervals from 100 Myr to 25 Myr, and again between 400 and 300 Myr, the SFR is significantly higher than the average over the last 500 Myr. Second, the SFR drops significantly between 25 Myr and the present time; this is in agreement with the lack of bright H emission in DDO 165 (see discussion in Paper I and Figure 4). The stars that populate these recent time bins are the most luminous BHeB and MS stars; if they were present in large numbers in DDO 165, they would be prominent in the global CMD. The lower SFR over the last 25 Myr is thus interpreted as a significant decrease in the total SFR in DDO 165. Whether this current drop in SFR corresponds to the ultimate truncation of the Gyr-length burst is not discernible from these data.
3.3.2 Recent Star Formation Histories: Localized or Global Events?
Figures 9, 10, and 11 present the SFHs of the selected regions in DDO 165 shown in Figure 4 and discussed in § 3.2; each region is normalized to show SFR per unit time per unit area. The normalized recent SFHs span an intensity range of 3 over the last 500 Myr in these regions. There are clear variations in normalized SFRs from one field to the next: some regions have constant SFRs over the last 500 Myr (e.g., Hole 1, Control 5), while others have dramatic variations in their SFRs during certain intervals (e.g., Northern 1, Hole 2, Cluster 2, Control 12, Control 13). Comparing with the multiwavelength properties shown in Figure 4, the localized SFHs within DDO 165 arise from a wide variety of local conditions.
Two important time intervals are apparent from the localized SFHs: 400-300 Myr and 100-25 Myr. These epochs are identified as periods of enhanced local normalized SFR compared to the 500 Myr average. In the more ancient event, the global SFR increases by 50% compared to the 500 Myr average. A corresponding increase in normalized SFR is seen in H I Holes 1 and 6, Cluster 1, and Control 1, 2, 5, 8, 9, 11, 12, 13, and 17. These regions are distributed over a large fraction of the stellar body of DDO 165, indicating that a global SF event took place during this period. The second period of enhanced SF is 100-25 Myr; the global SFR again increases by 50%. A corresponding elevated SFR is seen in regions located throughout DDO 165: Holes 2, 5, and 6, Clusters 1 and 2, the northern H I component (Northern 1 and Northern 2), and Control 1, 3, 5, 7, 8, 10, 12, 13, 17, 18 and 19. The fact that this more recent SF event occurred in widespread regions of the galaxy (compare, for example, the locations and SFHs of Northern 1, Control 1 and 18) suggests a second global SF event. The rapid truncation of the global SFR, as well as the decrease in most normalized SFRs, suggests that this event ended as quickly as it began.
We note with interest that the 400-300 Myr interval identified in this SFH analysis agrees with two other relevant timescales for DDO 165. The first is the well-known three-body tidal interaction between M 81, M 82, and NGC 3077 that occurred 300 Myr ago (van der Hulst, 1979; Yun et al., 1994). However, since no direct evidence is seen in our H I data for a recent tidal interaction (see Paper I), nor does any kinematic model of the M 81 group suggest that DDO 165 was directly involved in the M 81 - M 82 - NGC 3077 interaction (e.g., Thomasson & Donner, 1993), this timescale may be coincidence. The second and perhaps more important timescale is tevo, the time required to remove evidence of correlated stellar structure. Bastian et al. (2011) has analyzed the evolution of stellar structures in various M 81 group dwarf galaxies, and finds that stellar structures survive for at least 350 Myr in DDO 165. The long tevo for DDO 165 (compare to 80 Myr for the SMC and 100 Myr for NGC 2366; see Gieles et al. 2008 and Bastian et al. 2011) guarantees that the recent SFHs within the various regions of the galaxy can be reliably compared with the current H I properties of the same regions; we discuss this point further in § 4.3 below.
3.3.3 Comparison to Individual Star Clusters
We have identified 20 individual stellar clusters to examine any temporal consistencies with the SFHs of the fields presented so far. The clusters were identified by inspection of a F555W/F814W color HST image. The masses and ages of the clusters tabulated in Table 3 were determined from fitting broadband BVRI ground-based photometry to single stellar population models (Bertelli et al., 1994; Marigo et al., 2008). The BVRI data are part of the Spitzer Infrared Nearby Galaxies Survey (SINGS; Kennicutt et al. 2003); images were acquired with the KPNO 2.1-m telescope.
Figure 12 shows the spatial relationship of these individual clusters to the H I holes and Cluster regions identified above. Note that we use lower case “c” labels for individual clusters in Table 3. Holes 5 and 6 both contain stellar clusters, as do the regions Cluster 1 and Cluster 2. Conversely, there are 4 holes that do not contain readily identifiable clusters. Also of interest is that the strongest emission in H and UV comes from the region inhabited by the individual clusters c2, c5, c6, and c7.
Next we examine the cluster age properties in relation to the global SFH of DDO 165 over the last 500 Myr. Figure 13 shows the global SFH (identical to the SFH shown in Figure 8), overplotted with the masses and ages of individual stellar clusters. The most notable feature is the temporal concentration of clusters (c7, c9, c10, c13, c16, c17, and c19) near 100 Myr. This age corresponds to the increase in global SFR at the onset of the 100-25 Myr SF event discussed above. Note also that the 7 clusters with ages of 100 Myr are scattered throughout the entire disk of DDO 165. Taken together, these properties suggest that the formation of stellar clusters is directly linked to the increase in global SFR in DDO 165.
Based on the results for DDO 165 presented here, the connection between H I holes and stellar clusters appears to be somewhat ambiguous: H I structures are identified both with and without interior stellar clusters. However, it is important to note that all of the observed clusters have ages 90 Myr (see Table 3). This suggests that we are observing only those associations that have survived the well-documented “infant mortality” phase (e.g., Lada & Lada 2003; Fall et al. 2005; Chandar et al. 2006; and references therein). If the clustered SF in DDO 165 has proceeded in a manner similar to that observed in other systems, it seems probable that many young clusters have been destroyed within the past 100 Myr.
It is interesting to note that the relation between total SFR (clusters plus field stars) and cluster formation rate during periods of heightened SF activity appears to be linear in log-log space (Goddard et al., 2010; Silva-Villa & Larsen, 2010). To date, this relation has been described in the literature for 10 galaxies, none of which are dwarfs. The results above for DDO 165 appear to agree with this log-log linear relationship between total SFR and cluster formation rate. Further work to solidify this realtion in low-mass galaxies would be very instructive.
4 Probing the Stellar-ISM Interaction in DDO 165
4.1 Patterns of Recent Star Formation Versus H I
The preceding discussion highlights that SF has pervaded the disk of DDO 165 over the past 500 Myr. Figure 3 shows that over this time interval, the BHeB stars are distributed more or less uniformly throughout the inner H I disk. However, note that the truncated stellar surface brightness of the southern regions (compare with the figures presented in Paper I) remains coherent in the BHeB populations at all age intervals. This result, together with the characteristic tevo 350 Myr derived in Bastian et al. (2011), motivates our comparison of the patterns of SF over the last 500 Myr with the current H I morphology and dynamics. Although the H I data lack temporal information, the arguments for the dynamical simplicity of dwarfs (e.g., lack of internal shear, long dynamical timescales) presented in Paper I, and the predicted survival timescales of H I holes from simulations (100-600 Myr; Recchi & Hensler 2006), suggest that the comparison of recent SF and present-day H I properties are physically motivated in low-mass systems.
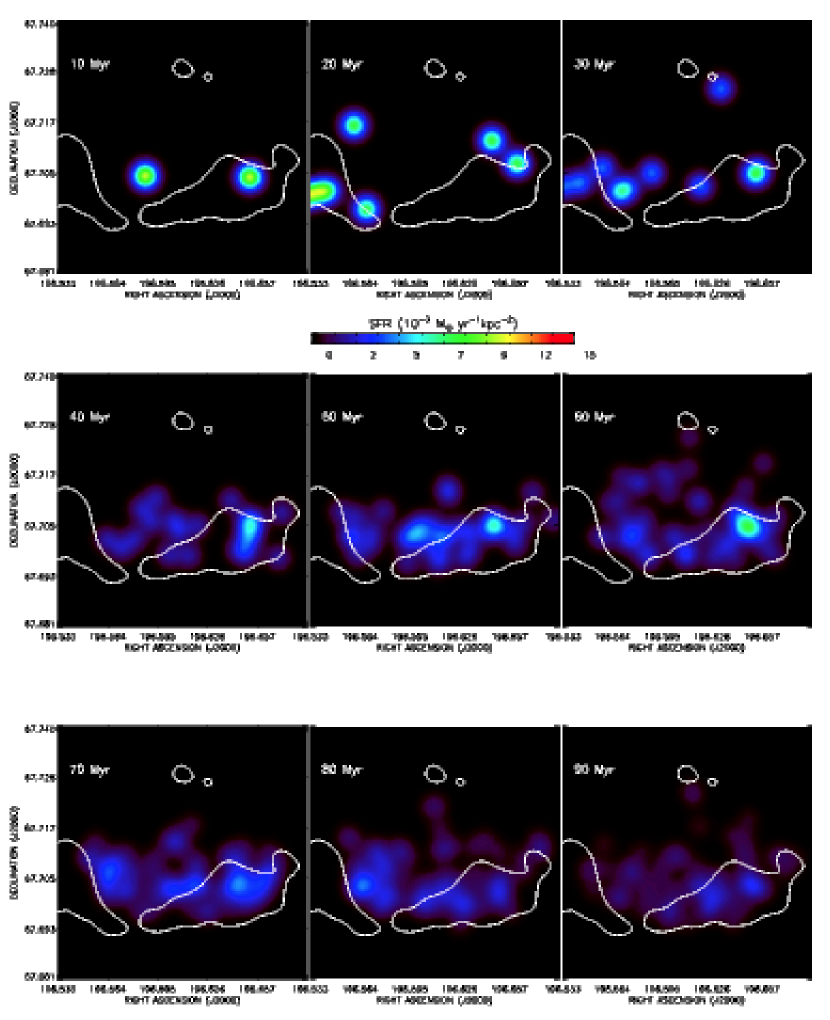
We take advantage of the fine temporal and physical resolution in our HST data by presenting movies of the normalized SFR. These movies were created using a procedure similar to that described in Dohm-Palmer et al. (1997) and applied by Weisz et al. (2009b); we refer the reader to the latter work for detailed discussion. The first step is to create a series of stellar density maps on a specified grid size. Knowing the physical coordinates and ages of the BHeB stars, they are binned into 5 Myr intervals and gridded in Right Ascension and Declination. These images are then smoothed spatially by a 17″ Gaussian kernel (most directly comparable to the 20″ H I beam size from Paper I) and then normalized by dividing by the total number of counts.
The second step is to create a SFH on the same temporal grid. The global SFH is binned with different time resolutions to account for the degraded resolution with SFH look back time: 10 Myr for the 0-100 Myr interval, 20 Myr for the 0-200 Myr interval, and 50 Myr for the 0-500 Myr interval. These are linearly interpolated onto the same temporal grid as the stellar density maps (5 Myr). The multiplicative product of the stellar density maps and the SFH is divided by the physical area of the field of view, thus resulting in a series of images representing SFR per unit area, each separated by 5 Myr.
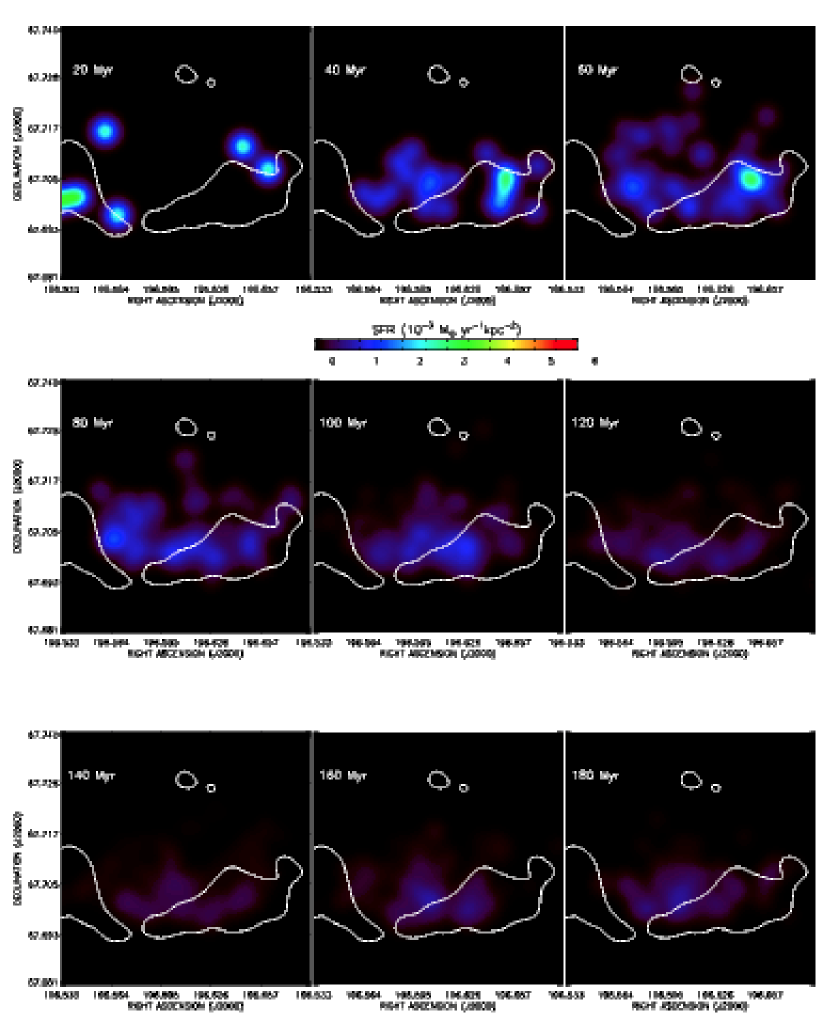
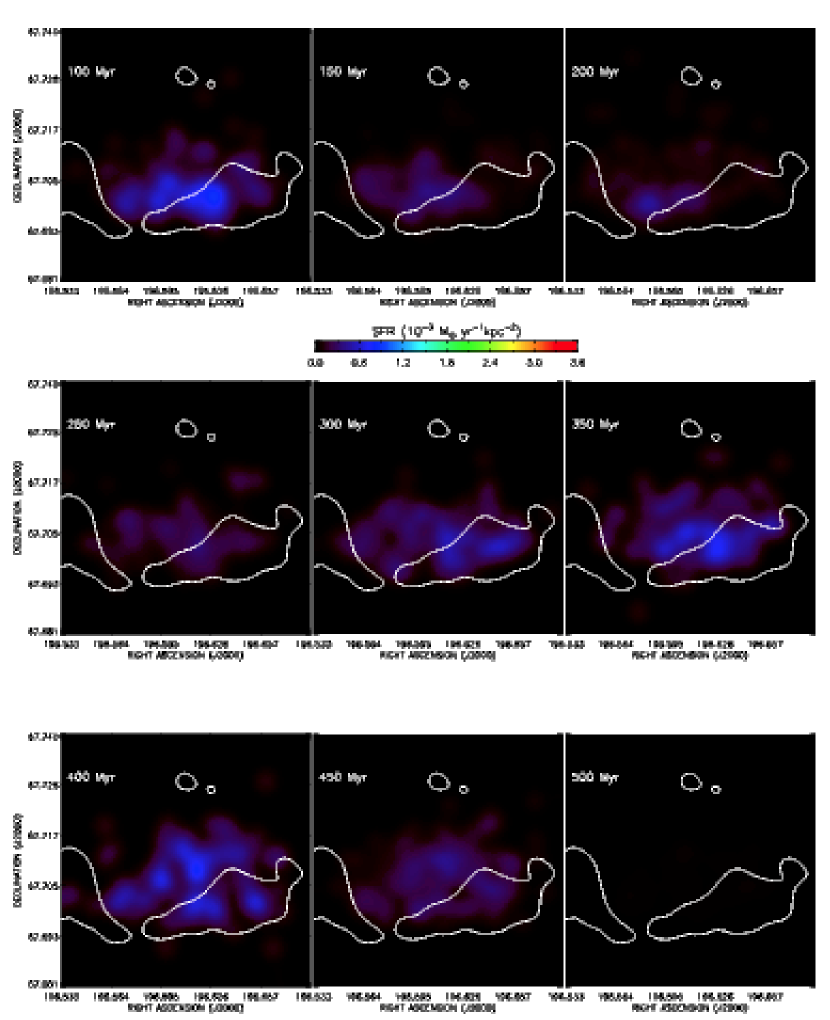
The resulting movies (available in the electronic version of the journal) show the intensity of SF as a function of time and of position, to lookback times of 100 Myr, 200 Myr, and 500 Myr, respectively. Note that while each movie has the same time step (5 Myr), the movies extending to larger lookback times were created by interpolation over larger time intervals and thus have a higher relative uncertainty from one time step to the next. For clarity, each movie contains the same H I 1021 cm-2 column density contour as shown in Figure 4. Figures 14, 15 and 16 show selected still frames from the movies. It is important to emphasize that these movies and images show a SFR per unit area; high SFRs can arise from low-level SF distributed over large areas, or from high-level SF in a small region. Using the heightened period of SF around 100 Myr (see Figure 8) as a guide, the SFRs per unit area in the movies near this lookback time are at modest levels but occur over a substantial portion of the system.
The movies highlight various important features of the recent evolution of this intriguing system. First, the starburst in DDO 165 is a global event; throughout the last 500 Myr the SF has been ongoing throughout most of the stellar component. Second, the period of heightened global SFR rate from 400-300 Myr is apparent as distributed SF throughout the system and centered on the current stellar distribution; the elevated global SFR from 100-25 Myr is manifested as somewhat more localized regions of SF (preferentially located in the southern region) superposed on distributed lower-level SF. Third, there is little SF exterior to the 1021 cm-2 column density contour. This is especially evident in the southern region as the aforementioned truncation of the stellar population. Finally, comparing with Figure 3 shows that SF inside the giant H I hole has spanned the entire 500 Myr interval (although only a small number of stars with ages 25 Myr are present).
In addition to the H I holes and shells discussed above, Paper I identified a wealth of high-velocity gas within DDO 165. Most of this gas is located inside of the southern 1021 cm-2 contours shown in the movies and in Figures 14, 15, and 16. A careful examination of the spatial distribution of BHeB stars in these regions (Figure 3), the normalized SFHs of these regions (e.g., Clusters 1 and 2, Hole 2, Control 7, 9, 12, 13, 18), and the SFR per unit area movies shows that there has been significant SF in the southern H I component at locations coincident with the present-day high velocity neutral gas. In agreement with Paper I, extended SF events appear capable of creating incoherent but high velocity motion of the surrounding interstellar material. We note that coherent H I structures smaller than our physical resolution limit (160 pc using our highest resolution H I cubes) may be present in DDO 165.
4.2 The Energies of H I Holes
Paper I identified 8 holes and shells in the neutral ISM of DDO 165. Of those 8 structures, 5 were found to have kinematic expansion signatures. Table 1 summarizes the properties of the H I holes that lie within the HST field of view. For the three kinematically expanding structures in Table 1, Paper I made the the simplistic assumption that each structure is created by a single blast. A coarse estimate of the energy required to create the expanding H I structure was then calculated via
| (1) |
where Ehole is the energy needed to create the expanding structure in erg, n0 is the H I volume density before the creation of the hole (Paper I assumes n0=0.1 cm-3), d is the diameter of the shell in parsecs, and vexp is the observed expansion velocity in km s-1. These Ehole values are tabulated in Table 4 (columns 2, 3, and 4).
As discussed in Paper I, this calculation is overly simplistic for a number of reasons; we now attempt a more realistic and physically motivated derivation of the energy requirements for the observed H I structures by modeling the mass surface density and the H I volume density. For kinematically expanding structures, the velocity and physical size are easily measured; the volume density, however, is difficult to measure directly and we thus rely on a mass model approach to obtain the behavior of n0 as a function of position. For a disk of H I gas, the column density (NHI), volume density (n0) and disk scale height (h) are related via
| (2) |
Since the velocity field of DDO 165 is so peculiar, Paper I was not able to achieve an unambiguous rotation curve fit, which could have been used to determine the scale height of the galaxy. We thus rely on infrared photometry to produce a stellar mass model of DDO 165. Note that such a model implicitly assumes that the bulk of the infrared luminosity arises from the stellar populations older than the MS or BHeB stars; this population is assumed to retain the same mass distribution both before and after a SF event.
We used the IRAC 3.6 m images acquired with the Spitzer Space Telescope as part of SINGS (Kennicutt et al. 2003; see also Walter et al. 2007) to derive our stellar mass model (see discussion in Oh et al. 2008 and application in Weisz et al. 2009b). After removing obvious foreground stars, the 3.6 m image (which also shows the truncation of the stellar population in the southern region of the system; see Figure 4 of Walter et al. 2007) was spatially smoothed to 7.5″ resolution (our highest H I angular resolution element) and then fitted with ellipses of constant surface brightness. The best-fit solution yielded a central position of (,) = (13:06:24.7, 67:42:33.2), an ellipticity of 0.5, and a position angle of 90∘. The radially averaged 3.6 m surface brightness profile is shown in Figure 17; the surface brightness declines with radius, falling from 21 mag arcsec-2 to 23 mag arcsec-2 within 3 kpc.
The H I scale height of an isothermal disk is related to the velocity dispersion of the gas and the mass surface density. As derived in Kellman (1970) and applied in Kim et al. (1999) and Weisz et al. (2009b),
| (3) |
where is the H I velocity dispersion in km s-1, is the mass density profile in M⊙ pc-2, and h is the H I disk scale height in pc. Using the same central position, ellipticity and position angle used to derive the stellar surface brightness profile, we extracted radially averaged values of H I column density and velocity dispersion. These plots are shown in Figure 17. The rise in H I velocity dispersion in the central 0.5 kpc, and the prominent low column densities in the same region, are the results of the giant H I hole. We note that the observed velocity dispersions may not be appropriate for calculating the scale height of the gas prior to the onset of SF; we thus also perform energy calculations with assumed velocity dispersions similar to those seen in the quiescent regions of nearby dwarf galaxies (see further detailed discussion below).
Figure 18 shows radial profiles of derived properties derived from observed properties shown in Figure 17 and using the equations above. The top panel of Figure 18 shows the mass surface density in units of M⊙ pc-2, derived from the 3.6 m surface brightness profile by assuming a 3.6 m mass to light ratio of 0.5 (similar to other dIrr systems; see de Blok et al. 2008) and applying the techniques used in Oh et al. (2008) and Weisz et al. (2009b). The middle panel of Figure 18 shows the H I scale height, h, as a function of radius, derived using the radial values of and . The shape of the H I scale height as a function of radius is qualitatively similar to the profile derived for the M 81 group dwarf Holmberg II in Weisz et al. (2009b) using a similar approach; however, the scale height in the outer disk of DDO 165 is a factor of 3 larger than for Holmberg II. The red line shows the polynomial fit to this curve, which we use to obtain the value of h at any given radius.
Finally, the bottom panel of Figure 18 shows the midplane H I volume density as a function of radius, derived using the radial values of NHI and h. The giant H I hole is prominent at radii 1 kpc. Moving outward toward r 1 kpc, the scale height remains essentially constant, is decreasing, falls to a more or less constant value, and the H I column density rises. These properties conspire to create a maximum in the H I volume density at r 1 kpc. The volume density then falls smoothly moving further outward through the disk; the increasing scale height implies lower H I volume densities at these large radii.
Three fits to the radial plot of H I volume density are shown in Figure 18. The red line shows the functional fit including all data points. Since there was H I gas inside this structure when the BHeB stars were formed, our derivation of the energy requirements for the formation of this hole would be an underestimate if we used the present-day volume density. Thus, we include two other fits to the n0 curve: the function shown in blue is fitted to the data beyond 1 kpc and is forced to plateau to a constant volume density in the inner disk; the function in green is also fitted to the data beyond 1 kpc using a Gaussian function that rises to slightly larger n0 values in the inner disk. While these fits do not explicitly conserve H I mass, we stress that the volume density enters the energy calculation as n; the choice between these three curves produces significant differences in energy only in the inner regions of the galaxy (i.e., where the red and blue/green curves differ substantially).
The radial behavior of H I volume density now allows us to estimate the creation energies for the H I holes. We begin by considering those 3 holes with measured expansion velocities (2, 5, 7). Knowing these velocities and the sizes of the holes (radius for circular structures, geometric radius for elliptical structures), we simply insert the volume density values at the appropriate galactocentric radius (Figure 18) into Equation 1. The results are shown in Table 4; for each hole, we estimate the requisite creation energy assuming four values of the H I volume density. The simplistic constant n0 approach (as in Paper I) is shown in columns 3 and 4; the polynomial fit approach is shown in columns 5 and 6; the best fit line at r 1 kpc and plateau to constant n0 at r = 0 approach is shown in columns 7 and 8; the best fit Gaussian profile at r 1 kpc approach is shown in columns 9 and 10.
Three important insights arise from an examination of Table 4 and Figure 18. The first is that the most significant differences in volume density occur between the simplistic n0 = 0.1 cm-2 assumption (close to the value at r 1 kpc) and the outer disk regions. This implies that estimates of the energy requirements for a hole in the outer disk will be significantly lower using the mass model approach discussed above than using the assumed value from Paper I. Hole 7 shows this effect quite clearly, as the requisite energies differ by a factor of two. The second insight is that for all holes at radii beyond 1 kpc, the functional fits in Figure 18 use the same data and thus produce essentially identical n0 values and energy requirements. The final important feature of Table 4 is that the creation of each of these kinematically expanding structures requires of order 1051 erg. This estimate is similar to the energy requirements for the smaller holes in Holmberg II found by Weisz et al. (2009b).
We next consider those holes that show no signs of kinematic expansion, rendering a direct application of Equation 1 difficult. These kinematically static structures are usually assumed to have either blown out of the disk or to have re-established pressure equilibrium with the surrounding ISM. The latter effect will occur when the average bulk velocity of a shell equals the average velocity dispersion over a given region. Thus, if we assume coherent motion at an average velocity equal to that velocity dispersion, we can estimate the energy requirements for the structure. We stress that such estimates are uncertain at the 50% level or more; nonetheless these numbers are useful when compared to the mechanical energy injected by the evolving massive star populations (see below).
In an attempt to bracket the potential extrema in the assumed velocity ranges, we consider three different values for the putative expansion velocities of the kinematically stalled structures. First, we assume a value of 7 km s-1 for any stalled hole, as adopted by the analyses in The HI Nearby Galaxies Survey (THINGS; Walter et al. 2008). Next, we can adopt one of two different values for the velocity dispersion: averaged over the entire hole structure, or averaged over the entire galaxy. As expected, the global value (8.5 5.0 km s-1, regardless of angular resolution) is lower than in localized regions ( 11-12 km s-1).
The energy estimates for the stalled structures are summarized in Table 5. Column 2 gives the assumed expansion velocity for each hole; the remaining columns contain the same information as those in Table 4: constant n0 in columns 3 and 4; the best-fit polynomial function in columns 5 and 6; the best fit function plateaus to constant n0 in columns 7 and 8; the best fit Gaussian in columns 9 and 10. The table repeats these calculations for each assumed Vexp value. Similar trends are seen for these stalled holes as described above: the largest differences at a chosen velocity occur between holes in the outer disk and holes at the maximum n0 value; energy estimates for holes in the outer disk are independent of the adopted n0 value. Further, for the smaller H I holes in Table 5 (1, 4) the estimated creation energies are similar to those found for the expanding features in Table 4. Note by comparing the energy estimates for a given hole that the V dependence results in a factor of 2 variance in the derived energy budget.
The giant H I hole (Hole 6) stands out prominently in Table 5. As expected, the characteristic creation energy of this structure is roughly two orders of magnitude larger than the other holes. Further, this characteristic energy of 1053 erg is similar to those derived for other giant H I structures in dwarf galaxies (e.g., Walter & Brinks 1999; Weisz et al. 2009b; Warren et al. 2011).
The information in Tables 4 and 5 allows us to estimate kinematic ages for each of these structures; these ages are given in Table 6. For the expanding holes (Table 4) this number is simply the geometrical mean radius divided by the measured expansion velocity (assumed to be constant). Note that these ages are explicitly upper limits since the expansion velocity was higher immediately after the hole was created. For the stalled structures, we adopt the global velocity dispersion as being representative of the current expansion velocity and use it in subsequent discussion. This is motivated by two considerations. First, the global value provides energy estimates near the middle of the ranges shown in Table 5. Second, the galaxy-averaged velocity dispersion sets the characteristic ISM pressure and thus determines in large part when an expanding H I structure will stall. The kinematic ages tabulated in Table 6 range from 22 to 89 Myr. This time interval corresponds to the period of heightened SFR between 25-100 Myr discussed above; it also sets the characteristic timescale of 100 Myr over which we will compare the energy outputs from stellar evolution with the energy requirements from the H I data.
In the discussion that follows we adopt the energy estimates derived using the Gaussian profile for H I volume density of all H I holes. For expanding holes, Vexp is an observed quantity. As justified above for the stalled holes, we hereafter set Vexp 8.5 km s-1, i.e., equivalent to for the entire galaxy. These assumptions lead to the EHole values in column 3 of Table 6. While the relative errors on these values are difficult to estimate, we stress that our calculations should be considered uncertain at the 50% level (at minimum); the scatter in EHole estimates from Tables 4 and 5 can also be used to guide interpretation. We emphasize that the specific EHole values are less important than the order of magnitude estimates; § 4.3 shows that the feedback energies from the stellar populations inside each hole exceed these EHole estimates, usually by more than an order of magnitude.
4.3 The Energies of Recent Star Formation
The global and localized SFHs presented above allow us to calculate the integrated mass of the stars formed as a function of time; this is simply the product of average SFR and time bin width. With the assumption of a fully populated universal Salpeter IMF, this total stellar mass implies a certain number of massive stars that will result in SNe and therefore deposit mechanical energy into the surrounding ISM. The amount of feedback energy resulting from the evolution of these massive stars can thus be quantified using our SFHs and models of the energy outputs of SF episodes. To this end, we apply the STARBURST99 models (Leitherer et al., 1999) to each of the SFHs described in § 3 above. Specifically, we perform a simulation of a 106 M⊙ instantaneous burst of SF, scaled to the integrated mass in each SFH, using the same relevant parameters as discussed in § 3.3. It is assumed that each star more massive than 8 M⊙ explodes as a SN (Salaris & Cassisi, 2005; Smartt, 2009). We make no correction for the contributions of Type Ia SNe to the feedback energy budget. These events occur over a range of timescales (Matteucci et al., 2006) and may occur in regions that are already partially evacuated; for both reasons, the actual feedback energy from stellar evolution in a given region can be considered to be a lower limit. The STARBURST99 models are sampled every 5 Myr in order to create profiles of the feedback energy resulting from SF as a function of time.
Our HST imaging provides detailed information on the energy budget as a function of time; however, we are cognizant of the uncertainties introduced as a result of random stellar diffusion. As stars move within a galaxy, they will disperse away from their formation sites; this effect becomes important as stars venture into and out of given areas of consideration within a galaxy. While the results presented by Bastian et al. (2011) suggest a long period of coherence of stellar structure within DDO 165 (see discussion above), we conservatively limit our consideration of the input energies within a given region to 100 Myr. By considering only this recent interval, we can minimize the uncertainties resulting from stars diffusing into or out of a given region. By way of example, the control fields have physical radii of 220 pc at the adopted distance. A 2 km s-1 net velocity will move this distance in 100 Myr; however, the relaxation dynamics are likely complex and the actual crossing time will depend on many paramaters (local stellar and gas density, burst mass and age, etc.). For the larger H I holes we observe in DDO 165 (especially #6, with a minor axis of 1.1 kpc), the effects of diffusion out of the region will be smaller yet.
The results of our energy calculations over the most recent 100 Myr are shown in Figures Figures 19, 20, and 21. A comparison of these profiles with the normalized SFH plots (Figures 9 through 11) demonstrates several interesting points. First, total feedback energies over the last 100 Myr fall in the 1051–1054 erg range. Further, the energy input into each of these regions is temporally extended; the canonical assumption of an instantaneous injection of feedback energy during the formation of a stellar cluster is a simplification compared to the extended energy profiles. Note that these profiles could be extended to larger lookback times (with appropriate caveats), increasing the total energy feedback budgets.
The cumulative energy profiles shown in Figures 19 through 21 allow us to quantify the amount of energy resulting from recent SF on any timescale of interest between 0 and 100 Myr. These energies can then be directly compared with the energy requirements for creating the H I structures (see discussion in § 4.2 above). Recall that Table 6 shows the adopted kinematic ages of the H I structures (column 2), as well as the requisite energies to create them (column 3). It is now straightforward to find the amount of energy produced by SF and stellar evolution over the adopted kinematic ages of the structures: one simply reads the value of energy at the appropriate age in the panels of Figure 19. To guide interpretation, that figure shows the kinematic age of the structure by a vertical line. Column 4 of Table 6 tabulates ESF, the total energy input by stellar evolution over the adopted kinematic age of the H I structure.
Note by examining the SFHs and energy profiles of H I Holes 4 (stalled structure) and 7 (expanding structure) that an estimate of ESF is not possible for these features: no recent SF has occurred within the kinematic ages of these holes. This might not be surprising for Hole 4: it is located in a region of low H I column density and low stellar density. Hole 7 is much more difficult to interpret; it contains dense neutral gas (overlapping the 1021 cm-2 contour) and is expanding at 9 km s-1. However, it hosts only low-level SF over the past 500 Myr.
For the other four H I structures, the energy derived from SF over the kinematic age is larger than the energy required to create the structure. We term the ratio EHole/ESF the “feedback efficiency”. The efficiency is relatively high for hole 1 (40%) but low for the giant H I hole (1%); these efficiencies are similar to those found for holes in Holmberg II by Weisz et al. (2009b). For these H I structures, recent stellar evolution provides sufficient energies within the kinematic ages of the hole in order to create them. We note that ESF EHole for any of the energy estimates in Tables 4 or 5, even when selecting the highest EHole values. The assumption of 100% efficiency is implicit; smaller values of efficiency produce smaller energy excesses, but retain sufficient cumulative energy inputs to create the observed structures.
As noted above, we can only estimate the kinematic ages of structures that are expanding at the present time. As such, a second timescale of interest is the amount of time required for the energy from SF to equal the energy required to create the structure. We hereafter refer to this characteristic timescale as teq, the time when ESF EHole (assuming 100% efficiency); we tabulate the values of teq in column 6 of Table 6. This time interval is very brief for those structures with SF in the last 50 Myr: the time required is less than 30 Myr in all cases. For those structures without recent SF (Holes 4 and 7), this interval is much longer: 130 Myr for Hole 7 and 330 Myr for Hole 4. These extended intervals should be treated with caution; as noted above, on timescales longer than 100 Myr, random stellar motions of a few km s-1 can move stars both into and out of areas of the size we consider here.
We can envision a second and related source of uncertainty in the interpretation of the energy timescales. Consider a concentrated region of SF that imparts energy into the surrounding ISM and creates an expanding structure; as the hole diameter increases, it can cover a much larger area than the SF that created it. If there were any recent SF in this surrounding area, then the energy budget increases, although that energy did not specifically contribute to the creation of the H I hole. In this sense the energy estimates of our structures may be overestimates. However, it seems likely that large contributions from concentrated SF would create H I structures of their own; as the two structures merge they create a single structure. Further, we make no corrections for the energy contributions from Type Ia SNe (see discussion above), arguing for the derived energies being underestimated. With these uncertainties in mind for Holes 4 and 7, we note that teq is insensitive to the adopted EHole value: again selecting the largest EHole values from Tables 4 and 5 only changes teq for Holes 1 (teq 35 Myr), 4 (teq 400 Myr), and 6 (teq 25 Myr).
A direct comparison of the energies from SF with the energies of the surrounding gas is by definition limited to the H I holes only. However, following the discussion above, we can consider the feedback energies injected over only the most recent 100 Myr in any region within DDO 165. We thus tabulate in Table 7 the feedback energies from SF after 25, 50 and 100 Myr in each of the regions shown in Figure 4. This allows a comparison of the energies from recent SF in different regions throughout the galaxy in a straightforward manner.
Multiple interesting trends are seen in the data presented in Table 7. First, most regions have accumulated of order 1052 erg of energy by 25 Myr and of order 1053 erg of energy by 100 Myr. This enforces the importance of temporally extended SF on the surrounding ISM (e.g., McQuinn et al., 2010). Second, the regions with ongoing SF within the most recent intervals stand out prominently: for example, Cluster 2 has the largest ESF value at 25 Myr (2.8 1053 erg), exceeding even the feedback energy within the much larger giant H I hole. Remarkably, this substantial energy budget has failed to produce a coherent H I structure at our spatial and velocity resolution (see further discussion below). Third, the increase in the cumulative ESF values between 25 and 100 Myr (when ESF at 25 Myr is not zero) is at least an order of magnitude for many (but not all) regions. This again suggests that the stellar-ISM interaction operates over timescales much longer than the lifetimes of massive stars. Finally, and perhaps most importantly, the control fields have similar energy budgets on these timescales as do the H I holes. Taken at face value, the data in Table 7 suggest that abundant feedback energy is injected throughout the disk of DDO 165; coherent H I structures form in some regions but not others.
5 Star Formation As An Evolutionary Catalyst
The above discussion has demonstrated that significant feedback energy is produced by stellar evolution processes in regions throughout DDO 165 that span a large range of physical parameter space. In the discussion that follows, we discuss the stellar feedback hypothesis as applied to both the H I holes and the regions located throughout the system. While alternatives to the feedback hypothesis do exist (e.g., high velocity cloud impacts, disk instabilities, turbulence, ram pressure stripping; Sánchez-Salcedo 2002 and references therein), our data are optimal for examining the energies of stellar evolution and of H I structures. Multiple recent works have applied similar techniques in studying the feedback mechanism in nearby galaxies (e.g., Weisz et al., 2009b; Bagetakos et al., 2011); we refer the reader to the references in those works (as well as in Paper I) concerning potential alternative creation mechanisms.
5.1 Regions With Coherent H I Structure
5.1.1 H I Holes
We now address a deceivingly simple question: are the observed H I holes the results of SF that occurred in the past 100 Myr? We consider each structure individually to address this question. Three holes are stalled (1, 4, 6) and three are expanding (2, 5, 7).
Hole 2 can be considered the clearest example of feedback energy creating an H I hole in DDO 165. The high stellar density and dramatic increase in SFR during the 100-25 Myr interval produce a rapid deposit of mechanical energy into the surrounding ISM. The result is the most rapidly expanding structure identified in this study.
Holes 4 and 7 have no SF within the most recent 100 Myr, and thus represent challenges to the hypothesis of creation via SF feedback. Sufficient stellar feedback energies are only injected over longer timescales (teq 330 Myr for Hole 4 and 130 Myr for Hole 7; see Table 6). If these structures can remain coherent over timescales of hundreds of Myr (e.g., Recchi & Hensler 2006), then the creation of these structures by stellar evolution processes poses no apparent difficulties. The location of Hole 4 in the outer disk and the low surrounding H I surface densities might argue in favor of such a long-lived coherent structure. However, the location of Hole 7 poses a significant issue: given the global velocity dispersion value ( 8.5 km s-1), the crossing time of that structure is of order 25 Myr. This implies that the surrounding gas will re-establish pressure equilibrium on similar timescales. Further, the expanding nature of the structure is challenging to reconcile with the lack of recent SF over the most recent 100 Myr. We interpret these structures as evidence against a recent (100 Myr) feedback origin; however, feedback on longer timescales remains a viable mechanism.
Holes 1 and 5 present a similar juxtaposition; 5 is expanding while 1 is stalled. Both structures have ESF EHole, implying that SF is energetically capable of producing the holes. Hole 1 has a higher normalized SFR level and a higher stellar density than Hole 5. Hole 5, on the other hand, has experienced a recent period of slightly elevated SFR (100-25 Myr); this can be interpreted as a potential link between recent SF and hole creation.
The giant H I hole is perhaps the most challenging structure to interpret in DDO 165. The energies derived from SF are clearly energetically capable of removing the H I gas from within. However, the size of the structure, the low column densities within, and the presence of recent SF cloud this simplistic interpretation. In order for stars to have formed recently, the structure must either have retained interior local H I overdensities beyond our resolution limit or have expanded to its present size extremely rapidly (within 50 Myr, implying Vexp 25 km s-1, easily detectable at our velocity resolution). Alternatively, it is possible that the elevated SFR in the 400-300 Myr interval caused the ISM to become highly fragmented (such as in IC 2574 and Ho II; see Weisz et al. 2009a, 2009b); the feedback energy injected by the more recent SF then fully evacuated the remaining gas.
Taken as a group, we conclude that the coherent H I holes identified in Paper I can be created by stellar evolution processes, so long as the structures can remain coherent over 100 Myr timescales. Stated equivalently, our data are in agreement with a model where a mixed age and spatially distributed stellar population produces SNe separated by tens or hundreds of Myr. The cumulative energy outputs of these populations of stars are responsible for the creation of the H I holes. This is in agreement with the conclusions of Weisz et al. (2009b) based on a larger sample of holes in the M 81 group dwarf Holmberg II, as well as with the conclusions of Warren et al. (2011) for a collection of dIrr galaxies with giant H I holes.
5.1.2 The Kinematically Distinct Northern Region
We now consider the origin of the kinematic discontinuity between the northern and southern H I components. As Paper I shows, these components are static with respect to one another along the line of sight. Is this separation the result of macroscopic motion of H I gas due to SF (i.e., outflow) or is it the pristine infall of an H I cloud? Paper I uses arguments based on the H I data alone to eliminate various potential origins for the northern cloud (including superposed or counter-rotating disks, a coherently rotating disk, and turbulence). However, based on the H I data alone, we cannot differentiate between infall and outflow origins for the northern component.
Our energy analysis based on the recent SFH provides tentative evidence for the outflow scenario. As shown in Figure 22, within the last 500 Myr (roughly half of the burst duration; see McQuinn et al. 2010), the stars within DDO 165 have injected 1056 erg of energy into the ISM. This cumulative energy budget is in principle capable of moving the 1.65 107 M⊙ associated with the northern component (see Paper I) 1 kpc out of the total gravitational well of DDO 165. We estimate the required energy via a simple gravitational potential energy calculation:
| (4) |
where 8.56 1037 is a constant that incorporates G and conversion factors, Mnorth is the mass of the northern H I component in M⊙, Mdyn is the total mass of the DDO 165 system in M⊙, and R is the separation between the northern H I component and the center of the gravitational potential well. Assuming M 1.65 107 M⊙, M 109 M⊙ (i.e., 10 times larger than the total H I mass), and R 1 kpc, this yields E 1056 erg. We stress, however, that this calculation requires the assumption of various parameters that are not observationally constrained; some of the most important will be total depth and shape of the gravitational potential, and potential relative motion of the northern and southern components out of our line of sight (recall that the inclination of the system remains unconstrained) or at projected velocities lower than our spectral resolution limit. Our stellar energies thus favor the outflow hypothesis, but we treat this conclusion with caution.
The outflow interpretation is strengthened considerably by the nebular spectroscopy presented in Croxall et al. (2009). There, two slit positions targeted the highest surface brightness H regions; these positions ([13:06:16.42, 67:42:08.4] and [13:06:24.52, 67:43:41.2]) correspond to Cluster 2 in the main body and Northern 1/Northern 2, respectively. The derived oxygen abundances of these two regions are identical within the errors (12 log(O/H) 7.79 0.20 and 7.81 0.20). This supports the outflow interpretation based on the well-known chemical uniformity seen in most dwarf galaxies (see Kobulnicky & Skillman 1996, 1997, Kobulnicky et al. 1997, and references therein). If the northern cloud were pristine infalling material, it would be highly unlikely to share the same gas-phase metal abundance as the southern H I component. If the northern component became kinematically distinct as a result of SF ongoing over the past 500 Myr, then the identical abundances are to be expected.
5.2 Regions Without Coherent H I Structure
While the evidence in §5.1.1 argues in favor of a stellar feedback origin for the H I holes, we are left with an equally challenging question: why are coherent H I structures created in some regions, but not in others with essentially identical physical characteristics? Stated equivalently, why do we not observe H I holes associated with some of the more active regions studied here? Consider, in this context, a comparison of Hole 2 and Control 13. They share similar average H I column densities, UV surface brightnesses, and stellar densities. Their CMDs are similar, with strong BHeB and RHeB loci; their SFHs share the same qualitative shapes and normalized SFR values. They both have elevated SFRs in the 100-25 Myr interval. While the recent SF episode is stronger in Hole 2 than in Control 13, Hole 2 covers a slightly larger physical area. Control 13 does not create a coherent H I structure, but Hole 2 does.
Given the global burst of SF that DDO 165 has undergone in the last 1 Gyr (see McQuinn et al. 2010), and the energies available from stellar evolution processes in the regions studied here, it may in fact seem surprising that so few coherent H I structures are detected in DDO 165. To explain this, we propose an alternative interpretation, where the ongoing SF (which changes strength as a function of time, position and thus physical characteristics) is capable of creating incoherent but bulk motion of the interstellar material surrounding localized SFR peaks. This provides a simple explanation for the prevalence of the localized high velocity H I gas motions that permeate the southern H I component (see Paper I). When SF is spatially concentrated and temporally extended, it is capable of creating macroscopic H I holes and shells. When SF permeates large regions with variations in intensity (e.g., throughout the southern H I component, where relatively few H I holes are found compared to the number of control and cluster regions), the output energies serve to create incoherent but high velocity motions of the H I gas when seen at the physical resolution of these data. This suggests that, in addition to the classical H I holes and shells, localized high velocity gas motions can be interpreted as a signature of stellar feedback. This is in agreement with the modeling results of Joung & Mac Low (2006) and Joung et al. (2009), where the local velocity dispersion increases as a result of elevated SFRs. Further simulations of the interaction of spatially and extended SF on the surrounding ISM, with various assumptions on the efficiency and mechanisms of coupling between the energy and the gas, would be very valuable.
We conclude that regions with significant SF activity that lack coherent H I structures are a natural product of temporally and spatially distributed SF. This is based on multiple observed and theoretical properties of the ISM. First and most obviously, coherent H I motions smaller than our resolution limit (160 pc) cannot be discerned in these data. Second, spatially extended SF episodes can have both creative and destructive effects on coherent H I structures. An examination of the movies discussed in § 4.1 shows numerous examples of nearby regions of elevated normalized SF rates; coherent motions from one may encounter opposing motions from another. Third, the porosity of the ISM is challenging to measure at the present time (e.g., Heckman et al., 2001) and is unknown prior to the onset of SF in any given region. Feedback energy deposited into a porous region will more efficiently escape than in a uniform surrounding medium (e.g., Kunth et al., 1998). Finally, the position of the SF region with respect to the galactic midplane is an important parameter in the evolution of expanding structures from SF sites (e.g., Mac Low & Ferrara, 1999). Taken as a whole, these arguments favor a complex scenario for the deposition of feedback energy into the surrounding ISM; the efficiency of this process will depend on many factors (e.g., the intensity, duration and distribution of massive star formation, the metal content of the parent cloud, the local and total gravitational potential depth and shape, the local neutral and molecular gas density, the ISM porosity, position with respect to galactic midplane, etc.), leading naturally to both coherent H I holes and to incoherent motion of the interstellar material.
6 Conclusions
We have presented a comparison of the recent SFH in DDO 165 with the complex neutral gas morphology and kinematics. Using HST imaging we construct CMDs that allow us to isolate the age-sensitive helium burning stars. We exploit the fine temporal resolution back to 500 Myr in order to create both global and localized SFHs of selected regions within DDO 165. By comparison with synthesis models and stellar evolution isochrones, these SFHs can be used to derive the amount of energy unleashed by evolving stars into their immediate surroundings as a function of time.
The global SFH of DDO 165 reveals interesting evolutionary characteristics. Compared to the lifetime average SFR (1.3 10-2 M⊙ yr-1), the average SFR over the last 500 Myr is elevated by a factor of 3. This verifies the remarkably long burst of SF that DDO 165 has undergone (1 Gyr; see McQuinn et al. 2010). Two intervals of heightened SFR occur between look back times of 400-300 Myr and 100-25 Myr. The SFR drops precipitously in the most recent 25 Myr, consistent with the system’s “post-starburst” classification (Lee et al., 2009). It is important to understand how the significant feedback from this extended starburst episode has impacted the ISM of DDO 165.
Of specific interest are the H I holes identified in Paper I; our spatially resolved HST data allow us to examine the stellar populations within these structures and to quantify their SFHs and feedback energy budgets. In addition to these H I holes, we study the stellar populations in 2 regions containing stellar clusters, one region associated with the kinematically distinct northern H I cloud (with associated stellar cluster), and 20 control fields that sample a wide variety of optical and UV surface brightnesses, stellar densities, and H I surface densities. Many of these control fields sample regions containing high velocity gas features (from Paper I). We are thus able to quantitatively examine the localized effects of massive star evolution.
The most dramatic ISM feature in DDO 165 is a giant H I hole that encompasses 20% of all of the measured stars within the galaxy. This structure spans 2.2 1.1 kpc and requires 1053 erg of energy in order to create it. Our HST data reveal that the stellar populations inside of this structure are energetically capable of creating this structure; in less than 20 Myr there is sufficient feedback energy to meet this requirement. Extending to a lookback time of 100 Myr, there is nearly 100 times more feedback energy produced by evolving stars than are required to create this structure. Applying an identical analysis to the stars within each of the other holes leads to the same conclusion: feedback energies exceed the requisite creation energies, often by large amounts.
The other localized regions studied within DDO 165 (i.e., the “Cluster”, “Northern”, and “Control” fields) have comparable cumulative feedback energies as the H I holes. No coherent H I holes or shells are observed in these regions; this complicates the stellar feedback interpretation for the creation of HI holes. We thus propose an alternative interpretation, where ongoing SF is capable of creating incoherent but bulk motion of the interstellar material surrounding localized SFR peaks. This provides a simple explanation for the prevalence of the localized high velocity H I gas motions that permeate the southern H I component (see Paper I). When SF is spatially concentrated and temporally extended, it is capable of creating macroscopic H I holes and shells. When SF permeates large regions with variations in intensity, the output energies serve to create incoherent but high velocity motions of the H I gas. We conclude that regions with significant SF activity that lack coherent H I structures are a natural product of temporally and spatially distributed SF.
Perhaps as remarkable as the giant H I hole and the high velocity gas features is the kinematically distinct nature of the northern H I complex. As demonstrated in Paper I, this region is static along the line of sight with respect to the main body of DDO 165. The northern complex contains 15% of the total H I mass in the system; column densities exceed 1021 cm-2 and young stars are associated with this gas cloud. Using H I data alone, both an infall and an outflow origin for this kinematic discontinuity remain viable. The energies available from our SFH analysis, as well as the chemical homogeneity found by Croxall et al. (2009), favor a scenario where the northern complex has a feedback-triggered outflow origin, with in situ SF proceeding in the ejected gas. Stated equivalently, the 1056 erg of feedback energy produced over the last 500 Myr by the ongoing starburst is energetically capable of creating the giant H I hole, ejecting the northern gas cloud away from the center of the system, and inducing incoherent but high velocity motion of a large fraction of the neutral gas.
The giant H I hole in DDO 165 is similar to the ones found in the M 81 group dwarfs M81 dwA and Ho I, studied in detail by Warren et al. (2011). As that work and the present results indicate, feedback from recent SF is energetically capable of producing each of these kpc-size structures. DDO 165 and Ho I have neutral gas masses in the 108 M⊙ range; a characteristic cumulative feedback energy of 1055 deposited on 100 Myr timescales is capable of creating kpc-size H I holes. The neutral gas mass and cumulative feedback energy in M81 dwA are each an order of magnitude lower over the same characteristic time interval. While our SFH analysis allows us to conclude that SF can create such giant H I structures, we are left puzzled as to why it does not do so in other M 81 group dwarf galaxies with similar normalized SFRs and neutral gas masses. The creation of giant H I structures appears to be efficient in galaxies less massive than 109 M⊙ that host temporally extended SF events that include a significant fraction (perhaps 30% or more) of all stars in the system.
DDO 165 is an extreme example of how feedback drives the evolution of dwarf galaxies. The Gyr-long burst clearly indicates that low-mass galaxies are capable of vigorous SF over timescales much longer than the canonical instantaneous burst. The resulting energy outputs from such long SF episodes are sufficient to induce significant bulk motions in the surrounding ISM. The signatures of feedback in DDO 165 are diverse, including coherent and incoherent gas motions. DDO 165 serves as a poignant reminder that a remarkably active past can be unlocked by probing the SFHs of nearby galaxies.
References
- Bagetakos et al. (2011) Bagetakos, I., Brinks, E., Walter, F., de Blok, W. J. G., Usero, A., Leroy, A. K., Rich, J. W., & Kennicutt, R. C. 2011, AJ, 141, 23
- Bastian et al. (2011) Bastian, N., Weisz, D.R., Skillman, E.D., McQuinn, K.B.W., Dolphin, A.E., Gutermuth, R.A., Cannon, J. M., Ercolano, B., Gieles, M., Kennicutt, R. C., Lee, J. C., & Walter, F. 2011, MNRAS, in press (ArXiV/1010.1837)
- Bellazzini et al. (2001) Bellazzini, M., Ferraro, F. R., & Pancino, E. 2001, ApJ, 556, 635
- Bertelli et al. (1994) Bertelli, G., Bressan, A., Chiosi, C., Fagotto, F., & Nasi, E. 1994, A&AS, 106, 275
- Burrows (2000) Burrows, A. 2000, Nature, 403, 727
- Cannon et al. (2011) Cannon, J. M., et al. 2011, ApJ, in press (Paper I)
- Chandar et al. (2006) Chandar, R., Fall, S. M., & Whitmore, B. C. 2006, ApJ, 650, L111
- Chevalier (1974) Chevalier, R. A. 1974, ApJ, 188, 501
- Croxall et al. (2009) Croxall, K. V., van Zee, L., Lee, H., Skillman, E. D., Lee, J. C., Côté, S., Kennicutt, R. C., & Miller, B. W. 2009, ApJ, 705, 723
- de Blok et al. (2008) de Blok, W. J. G., Walter, F., Brinks, E., Trachternach, C., Oh, S.-H., & Kennicutt, R. C. 2008, AJ, 136, 2648
- Dohm-Palmer et al. (1997) Dohm-Palmer, R. C., et al. 1997, AJ, 114, 2527
- Dolphin (2000) Dolphin, A. E. 2000, PASP, 112, 1383
- Dolphin (2002) Dolphin, A. E. 2002, MNRAS, 332, 91
- Fall et al. (2005) Fall, S. M., Chandar, R., & Whitmore, B. C. 2005, ApJ, 631, L133
- Gieles et al. (2008) Gieles, M., Bastian, N., & Ercolano, B. 2008, MNRAS, 391, L93
- Gil de Paz et al. (2007) Gil de Paz, A., et al. 2007, ApJS, 173, 185
- Goddard et al. (2010) Goddard, Q. E., Bastian, N., & Kennicutt, R. C. 2010, MNRAS, 405, 857
- Heckman et al. (2001) Heckman, T. M., Sembach, K. R., Meurer, G. R., Leitherer, C., Calzetti, D., & Martin, C. L. 2001, ApJ, 558, 56
- Joung & Mac Low (2006) Joung, M. K. R., & Mac Low, M.-M. 2006, ApJ, 653, 1266
- Joung et al. (2009) Joung, M. R., Mac Low, M.-M., & Bryan, G. L. 2009, ApJ, 704, 137
- Karachentsev et al. (2002) Karachentsev, I. D., et al. 2002, A&A, 383, 125
- Kellman (1970) Kellman, S. 1970, Ph.D. thesis, Univ. California, Berkeley
- Kennicutt et al. (2003) Kennicutt, R. C., Jr., et al. 2003, PASP, 115, 928
- Kennicutt et al. (2008) Kennicutt, R. C., Jr., Lee, J. C., Funes, S. J., José G., Sakai, S., & Akiyama, S. 2008, ApJS, 178, 247
- Kim et al. (1999) Kim, S., Dopita, M. A., Staveley-Smith, L., & Bessell, M. S. 1999, AJ, 118, 2797
- Kobulnicky & Skillman (1996) Kobulnicky, H. A., & Skillman, E. D. 1996, ApJ, 471, 211
- Kobulnicky & Skillman (1997) Kobulnicky, H. A., & Skillman, E. D. 1997, ApJ, 489, 636
- Kobulnicky et al. (1997) Kobulnicky, H. A., Skillman, E. D., Roy, J.-R., Walsh, J. R., & Rosa, M. R. 1997, ApJ, 477, 679
- Kunth et al. (1998) Kunth, D., Mas-Hesse, J. M., Terlevich, E., Terlevich, R., Lequeux, J., & Fall, S. M. 1998, A&A, 334, 11
- Lada & Lada (2003) Lada, C. J., & Lada, E. A. 2003, ARA&A, 41, 57
- Lee et al. (1993) Lee, M. G., Freedman, W. L., & Madore, B. F. 1993, ApJ, 417, 553
- Lee et al. (2009) Lee, J. C., Kennicutt, R. C., Funes, J. G. S. J., Sakai, S., & Akiyama, S. 2009, ApJ, 692, 1305
- Leitherer et al. (1999) Leitherer, C., et al. 1999, ApJS, 123, 3
- Mac Low & Ferrara (1999) Mac Low, M.-M., & Ferrara, A. 1999, ApJ, 513, 142
- Madore & Freedman (1995) Madore, B. F. & Freedman, W. L. 1995, AJ, 109, 1645
- Marigo et al. (2008) Marigo, P., Girardi, L., Bressan, A., Groenewegen, M. A. T., Silva, L., & Granato, G. L. 2008, A&A, 482, 883
- Matteucci et al. (2006) Matteucci, F., Panagia, N., Pipino, A., Mannucci, F., Recchi, S., & Della Valle, M. 2006, MNRAS, 372, 265
- McQuinn et al. (2010) McQuinn, K. B. W., et al. 2010, ApJ, 724, 49
- Oh et al. (2008) Oh, S.-H., de Blok, W. J. G., Walter, F., Brinks, E., & Kennicutt, R. C. 2008, AJ, 136, 2761
- Recchi & Hensler (2006) Recchi, S., & Hensler, G. 2006, A&A, 445, L39
- Rhode et al. (1999) Rhode, K. L., Salzer, J. J., Westpfahl, D. J., & Radice, L. A. 1999, AJ, 118, 323
- Salaris & Cassisi (2005) Salaris, M., & Cassisi, S. 2005, Evolution of Stars and Stellar Populations, by Maurizio Salaris, Santi Cassisi, pp. 400. ISBN 0-470-09220-3. Wiley-VCH , December 2005.
- Sánchez-Salcedo (2002) Sánchez-Salcedo, F. J. 2002, Revista Mexicana de Astronomia y Astrofisica, 38, 39
- Schlegel et al. (1998) Schlegel, D. J., Finkbeiner, D. P., & Davis, M. 1998, ApJ, 500, 525
- Silva-Villa & Larsen (2010) Silva-Villa, E., & Larsen, S. S. 2010, A&A, 516, A10
- Smartt (2009) Smartt, S. J. 2009, ARA&A, 47, 63
- Thomasson & Donner (1993) Thomasson, M., & Donner, K. J. 1993, A&A, 272, 153
- van der Hulst (1979) van der Hulst, J. M. 1979, A&A, 75, 97
- Walter & Brinks (1999) Walter, F., & Brinks, E. 1999, AJ, 118, 273
- Walter et al. (2007) Walter, F., et al. 2007, ApJ, 661, 102
- Walter et al. (2008) Walter, F., Brinks, E., de Blok, W. J. G., Bigiel, F., Kennicutt, R. C., Thornley, M. D., & Leroy, A. 2008, AJ, 136, 2563
- Warren et al. (2011) Warren, S. R., Weisz, D. R., Skillman, E. D., Cannon, J. M., Dalcanton, J. J, Dolphin, A. E., Kennicutt, R. C., Koribalski, B., Ott, J., Stilp, A. M., Van Dyk, S. D., Walter, F., & West, A. A. 2011, ApJ, submitted
- Weisz et al. (2008) Weisz, D. R., et al. 2008, ApJ, 689, 160
- Weisz et al. (2009a) Weisz, D. R., Skillman, E. D., Cannon, J. M., Walter, F., Brinks, E., Ott, J., & Dolphin, A. E. 2009a, ApJ, 691, L59
- Weisz et al. (2009b) Weisz, D. R., Skillman, E. D., Cannon, J. M., Dolphin, A. E., Kennicutt, R. C., Jr.,Lee, J., & Walter, F. 2009b, ApJ, 704, 1538
- Yun et al. (1994) Yun, M. S., Ho, P. T. P., & Lo, K. Y. 1994, Nature, 372, 530
| Number | Diameter | Geometric | Galactocentric | Vexp | Kinematic Age | ||
|---|---|---|---|---|---|---|---|
| (J2000)aaThe right ascension and declination of the center of the holes. The error of these values is 3″. Units of right ascension are hours, minutes, and seconds, and units of declination are degrees, arcminutes and arcseconds. | (J2000)aaThe right ascension and declination of the center of the holes. The error of these values is 3″. Units of right ascension are hours, minutes, and seconds, and units of declination are degrees, arcminutes and arcseconds. | (pc)bbThe diameter of the hole in pc. If the hole is elliptical then the major and minor axis diameters, and the major axis position angle (east of north), are also listed. The hole diameters listed have an error of 100 pc | Mean RadiusccThe radius of a circle with area equivalent to that of the ellipse; this radius is used in energy calculations. (pc) | RadiusddRadial distance from the assumed center of the H I distribution (, = 13:06:24.7, 67:42:33.2). (kpc) | (km s-1)eeExpansion velocity of the hole, when it can be measured, with an error of 2 km s-1. | (Myr)ffThe calculated ages for the holes are upper limits as we assumed the expansion velocity to be constant throughout its evolution. | |
| 1 | 13:06:17.1 | 67:43:04.4 | 975 325, 40° | 281 | 1.16 | - | - |
| 2 | 13:06:22.1 | 67:41:46.9 | 520 | 260 | 1.05 | 11 | 23.0 |
| 4 | 13:06:27.7 | 67:41:04.5 | 390 | 195 | 1.96 | - | - |
| 5 | 13:06:30.1 | 67:41:26.5 | 737 | 369 | 1.59 | 7 | 51.2 |
| 6 | 13:06:30.6 | 67:42:31.0 | 2210 1084, 130° | 774 | 0.73 | - | - |
| 7 | 13:06:38.6 | 67:41:33.7 | 455 | 228 | 2.14 | 9 | 24.6 |
| Identification | Diameter | Number of Stars | ||
|---|---|---|---|---|
| (J2000) | (J2000) | (arcsec) | in CMD | |
| H I Hole 1 | 13:06:17.1 | 67:43:04.4 | 4515, 40° | 2888 |
| H I Hole 2 | 13:06:22.1 | 67:41:46.9 | 24 | 2690 |
| H I Hole 4 | 13:06:27.7 | 67:41:04.5 | 18 | 310 |
| H I Hole 5 | 13:06:30.1 | 67:41:26.5 | 34 | 2126 |
| H I Hole 6 | 13:06:30.6 | 67:42:31.0 | 10250, 310° | 28439 |
| H I Hole 7 | 13:06:38.6 | 67:41:33.7 | 21 | 701 |
| Cluster 1 (CL 1) | 13:06:14.6 | 67:42:23.5 | 20 | 2307 |
| Cluster 2 (CL 2) | 13:06:17.8 | 67:42:13.5 | 20 | 2321 |
| Northern 1 (N1) | 13:06:24.4 | 67:43:41.2 | 12 | 261 |
| Northern 2 (N2) | 13:06:24.4 | 67:43:41.2 | 24 | 957 |
| Control Region 1 (C1) | 13:06:11.1 | 67:42:32.9 | 20 | 1901 |
| Control Region 2 (C2) | 13:06:12.1 | 67:43:03.4 | 20 | 1274 |
| Control Region 3 (C3) | 13:06:12.4 | 67:42:02.8 | 20 | 1631 |
| Control Region 4 (C4) | 13:06:16.6 | 67:43:38.0 | 20 | 615 |
| Control Region 5 (C5) | 13:06:17.0 | 67:41:48.4 | 20 | 1573 |
| Control Region 6 (C6) | 13:06:17.1 | 67:41:23.7 | 20 | 2224 |
| Control Region 7 (C7) | 13:06:17.4 | 67:42:37.4 | 20 | 681 |
| Control Region 8 (C8) | 13:06:21.0 | 67:42:47.9 | 20 | 2056 |
| Control Region 9 (C9) | 13:06:21.6 | 67:42:24.5 | 20 | 2566 |
| Control Region 10 (C10) | 13:06:23.1 | 67:43:17.4 | 20 | 1366 |
| Control Region 11 (C11) | 13:06:24.5 | 67:41:20.8 | 20 | 730 |
| Control Region 12 (C12) | 13:06:24.6 | 67:42:08.5 | 20 | 2410 |
| Control Region 13 (C13) | 13:06:27.9 | 67:41:54.1 | 20 | 2368 |
| Control Region 14 (C14) | 13:06:29.8 | 67:43:29.1 | 20 | 684 |
| Control Region 15 (C15) | 13:06:34.3 | 67:43:16.2 | 20 | 1008 |
| Control Region 16 (C16) | 13:06:35.1 | 67:41:22.5 | 20 | 534 |
| Control Region 17 (C17) | 13:06:37.4 | 67:42:52.4 | 20 | 1539 |
| Control Region 18 (C18) | 13:06:40.2 | 67:41:58.4 | 20 | 1300 |
| Control Region 19 (C19) | 13:06:41.0 | 67:42:27.5 | 20 | 1354 |
| Control Region 20 (C20) | 13:06:42.1 | 67:43:07.8 | 20 | 718 |
| Identification | Age | Mass | ||
|---|---|---|---|---|
| (J2000) | (J2000) | (yr) | (M⊙) | |
| c1 | 13:06:10.2 | 67:41:42.2 | (6.3 3.3) 108 | (2.0 0.7) 104 |
| c2 | 13:06:13.9 | 67:42:22.5 | (1.3 0.2) 109 | (9.1 1.4) 104 |
| c3 | 13:06:14.6 | 67:41:30.5 | (2.2 1.3) 109 | (3.6 1.6) 104 |
| c4 | 13:06:14.8 | 67:43:13.4 | no fit | no fit |
| c5 | 13:06:15.4 | 67:42:20.1 | (2.5 0.2) 108 | (6.8 0.4) 104 |
| c6 | 13:06:16.3 | 67:42:05.8 | (3.2 1.2) 108 | (2.0 0.4) 104 |
| c7 | 13:06:17.9 | 67:42:13.9 | (1.1 0.3) 108 | (6.1 1.0) 104 |
| c8 | 13:06:18.1 | 67:41:34.7 | no fit | no fit |
| c9 | 13:06:20.0 | 67:43:49.4 | (1.6 1.2) 108 | (5.2 1.9) 103 |
| c10 | 13:06:22.6 | 67:42:02.3 | (1.0 0.1) 108 | (2.5 0.1) 104 |
| c11 | 13:06:23.7 | 67:42:37.9 | (5.0 0.2) 108 | (3.7 0.7) 104 |
| c12 | 13:06:24.0 | 67:42:58.5 | (1.3 0.3) 109 | (2.8 0.6) 104 |
| c13 | 13:06:25.8 | 67:42:31.2 | (1.1 0.5) 108 | (1.2 0.3) 104 |
| c14 | 13:06:29.1 | 67:42:27.2 | (5.6 0.3) 109 | (5.2 0.1) 105 |
| c15 | 13:06:29.3 | 67:41:28.7 | (5.6 2.2) 109 | (6.7 2.2) 104 |
| c16 | 13:06:29.8 | 67:42:14.8 | (8.9 2.5) 107 | (7.2 0.9) 103 |
| c17 | 13:06:30.2 | 67:41:52.0 | (1.4 0.5) 108 | (1.6 0.2) 104 |
| c18 | 13:06:30.8 | 67:42:17.2 | (2.2 0.3) 109 | (3.6 0.4) 105 |
| c19 | 13:06:30.8 | 67:42:41.2 | (1.3 0.4) 108 | (1.0 0.1) 104 |
| c20 | 13:06:35.8 | 67:42:07.1 | (3.2 1.0) 108 | (1.3 0.2) 104 |
| Hole | Vexp | aaEnergy calculation from Paper I assuming = 0.1 | EnergyaaEnergy calculation from Paper I assuming = 0.1 | bbFrom best fit line (red curve in Figure 18). | EnergybbFrom best fit line (red curve in Figure 18). | ccFrom best fit line, extrapolated assuming a constant volume density in the central regions (blue curve in Figure 18). | EnergyccFrom best fit line, extrapolated assuming a constant volume density in the central regions (blue curve in Figure 18). | ddFrom best fit Gaussian curve (green curve in Figure 18). | EnergyddFrom best fit Gaussian curve (green curve in Figure 18). |
|---|---|---|---|---|---|---|---|---|---|
| (km s-1) | (cm-3) | (erg) | (cm-3) | (erg) | (cm-3) | (erg) | (cm-3) | (erg) | |
| (1) | (2) | (3) | (4) | (5) | (6) | (7) | (8) | (9) | (10) |
| 2 | 11 | 0.1 | 4.0 | 0.094 | 3.7 | 0.091 | 3.6 | 0.094 | 3.7 |
| 5 | 7 | 0.1 | 6.2 | 0.078 | 4.7 | 0.078 | 4.7 | 0.073 | 4.3 |
| 7 | 9 | 0.1 | 2.0 | 0.051 | 0.92 | 0.053 | 0.96 | 0.049 | 0.90 |
| Hole | Vexp | aaAssuming a constant volume density (n0 = 0.1 cm-3) throughout the galaxy; see Paper I. | EnergyaaAssuming a constant volume density (n0 = 0.1 cm-3) throughout the galaxy; see Paper I. | bbFrom best fit line (red curve in Figure 18). | EnergybbFrom best fit line (red curve in Figure 18). | ccFrom best fit line, extrapolated assuming a constant volume density in the central regions (blue curve in Figure 18). | EnergyccFrom best fit line, extrapolated assuming a constant volume density in the central regions (blue curve in Figure 18). | ddFrom best fit Gaussian curve (green curve in Figure 18). | EnergyddFrom best fit Gaussian curve (green curve in Figure 18). |
|---|---|---|---|---|---|---|---|---|---|
| (km s-1) | (cm-3) | (erg) | (cm-3) | (erg) | (cm-3) | (erg) | (cm-3) | (erg) | |
| (1) | (2) | (3) | (4) | (5) | (6) | (7) | (8) | (9) | (10) |
| Assuming Vexp = 7 km s-1, as in THINGS analysis. | |||||||||
| 1 | 7 | 0.1 | 2.7 | 0.094 | 2.5 | 0.090 | 2.4 | 0.090 | 2.4 |
| 4 | 7 | 0.1 | 0.86 | 0.059 | 0.47 | 0.062 | 0.50 | 0.057 | 0.46 |
| 6 | 7 | 0.1 | 63 | 0.081 | 50 | 0.094 | 59 | 0.11 | 67 |
| Assuming Vexp = (velocity dispersion) over the entire hole. | |||||||||
| 1 | 11.2 | 0.1 | 5.2 | 0.094 | 4.8 | 0.090 | 4.6 | 0.090 | 4.6 |
| 4 | 12.0 | 0.1 | 1.8 | 0.059 | 1.0 | 0.062 | 1.1 | 0.057 | 0.97 |
| 6 | 12.0 | 0.1 | 130 | 0.081 | 110 | 0.094 | 130 | 0.11 | 140 |
| Assuming Vexp = (velocity dispersion) over the entire galaxy. | |||||||||
| 1 | 8.5 | 0.1 | 3.5 | 0.094 | 3.3 | 0.090 | 3.1 | 0.090 | 3.1 |
| 4 | 8.5 | 0.1 | 1.1 | 0.059 | 0.62 | 0.062 | 0.66 | 0.057 | 0.60 |
| 6 | 8.5 | 0.1 | 83 | 0.081 | 65 | 0.094 | 77 | 0.11 | 87 |
| Number | Adopted | EHolebbThe values use the Gaussian fit for volume densities of all holes; the expansion velocities are either direct measurements (Holes 2, 5, 7) or are adopted to be equivalent to the global value (8.5 km s-1) for non-expanding holes (Holes 1, 4, 6). | ESFccThe total energy input by stellar evolution over the kinematic age of the H I hole, computed using STARBURST99. | Feedback | teqeeThe time when ESF EHole. |
|---|---|---|---|---|---|
| AgeaaCalculated using the geometric radius of each hole, the measured expansion velocities for Holes 2, 5, and 7, and the total galaxy velocity dispersion for Holes 1, 4 and 6. (Myr) | (erg) | (erg) | EfficiencyddThe ratio EHole/ESF. | (Myr) | |
| 1 | 32 | 3.1 | 8.4 | 37% | 30 Myr |
| 2 | 23 | 3.7 | 28 | 13% | 15 Myr |
| 4 | 22 | 0.06 | N/A | N/A | 330 Myr |
| 5 | 52 | 4.3 | 76 | 5.7% | 25 Myr |
| 6 | 89 | 87.4 | 6170 | 1.4% | 20 Myr |
| 7 | 25 | 0.90 | N/A | N/A | 130 Myr |
| Identification | ESF 25 Myr | ESF 50 Myr | ESF 100 Myr |
|---|---|---|---|
| (1051erg)aaEnergy from SF over the last 25 Myr. | (1051erg)bbEnergy from SF over the last 50 Myr. | (1051erg)ccEnergy from SF over the last 100 Myr. | |
| H I Hole 1 | 2.5 | 24 | 110 |
| H I Hole 2 | 28 | 270 | 1400 |
| H I Hole 4 | 0.0 | 0.0 | 0.0 |
| H I Hole 5 | 6.8 | 60 | 230 |
| H I Hole 6 | 210 | 1700 | 7500 |
| H I Hole 7 | 0.0 | 0.0 | 0.4 |
| Cluster 1 (CL 1) | 33 | 290 | 980 |
| Cluster 2 (CL 2) | 280 | 1100 | 2400 |
| Northern 1 (N1) | 15 | 75 | 180 |
| Northern 2 (N2) | 34 | 130 | 270 |
| Control Region 1 (C1) | 6.5 | 58 | 240 |
| Control Region 2 (C2) | 1.5 | 13 | 47 |
| Control Region 3 (C3) | 4.9 | 44 | 170 |
| Control Region 4 (C4) | 0.9 | 8.1 | 29 |
| Control Region 5 (C5) | 21 | 51 | 160 |
| Control Region 6 (C6) | 0.4 | 3.3 | 9.6 |
| Control Region 7 (C7) | 15 | 130 | 470 |
| Control Region 8 (C8) | 3.0 | 29 | 160 |
| Control Region 9 (C9) | 17 | 150 | 500 |
| Control Region 10 (C10) | 42 | 110 | 190 |
| Control Region 11 (C11) | 0.0 | 0.0 | 0.0 |
| Control Region 12 (C12) | 70 | 380 | 1300 |
| Control Region 13 (C13) | 20 | 210 | 1100 |
| Control Region 14 (C14) | 2.0 | 17 | 48 |
| Control Region 15 (C15) | 0.0 | 0.4 | 9.7 |
| Control Region 16 (C16) | 0.0 | 0.1 | 2.5 |
| Control Region 17 (C17) | 7.7 | 67 | 250 |
| Control Region 18 (C18) | 49 | 190 | 510 |
| Control Region 19 (C19) | 7.5 | 69 | 320 |
| Control Region 20 (C20) | 0.0 | 0.2 | 5.0 |
| Total Galaxy | 1900 | 11000 | 35000 |