The M81 Group Dwarf Irregular Galaxy DDO 165. I. High Velocity Neutral Gas in a Post-Starburst System
Abstract
We present new multi-configuration VLA H I spectral line observations of the M81 group drr post-starburst galaxy DDO 165. The H I morphology is complex, with multiple column density peaks surrounding a large region of very low H I surface density that is offset from the center of the stellar distribution. The bulk of the neutral gas is associated with the southern section of the galaxy; a secondary peak in the north contains 15% of the total H I mass. These components appear to be kinematically distinct, suggesting that either tidal processes or large-scale blowout have recently shaped the ISM of DDO 165. Using spatially-resolved position-velocity maps, we find multiple localized high-velocity gas features. Cross-correlating with radius-velocity analyses, we identify eight shell/hole structures in the ISM with a range of sizes (400–900 pc) and expansion velocities (7–11 km s-1). These structures are compared with narrow- and broad-band imaging from KPNO and HST. Using the latter data, recent works have shown that DDO 165’s previous “burst” phase was extended temporally (1 Gyr). We thus interpret the high-velocity gas features, H I holes, and kinematically distinct components of the galaxy in the context of the immediate effects of “feedback” from recent star formation. In addition to creating H I holes and shells, extended star formation events are capable of creating localized high velocity motion of the surrounding interstellar material. A companion paper connects the energetics from the H I and HST data.
1 Introduction
Dwarf irregular (dIrr) galaxies are commonly assumed to be “simple” systems. Compared with more massive star-forming galaxies, such low-mass dwarfs lack bulk sources of energy that can “trigger” star formation (e.g., spiral density waves, rotational shear). Rather, dIrrs are often observed undergoing solid-body rotation (see discussion in Skillman 1996 and numerous recent examples; e.g., Begum et al. 2008). This implies that star formation (SF) proceeds largely in situ, with turbulence and stellar evolution being important dynamical processes.
This deceiving simplicity raises an important unanswered question in galaxy evolution: how do relatively isolated, low-mass systems sustain SF for extended periods of time? Recent resolved stellar population work has shown that dwarf galaxies can host remarkably long episodes of heightened SF activity. The durations of these bursts of SF are commonly defined by a modified birthrate parameter, b SFR/SFR; Kennicutt et al. (2005) sets a threshold of b2 as a “starburst”. Using this metric, burst durations of order 100 Myr, and extending to 1 Gyr in some cases, have been derived for nearby dwarfs (Weisz et al. 2008; McQuinn et al. 2009, 2010a, 2010b). Further, these works have shown that relatively young stars (100 Myr) can occupy a large fraction of the surface area of the galaxy: the SF events can, at times, pervade the entire disk. These points serve as pertinent reminders that the commonly-used instantaneous SF tracers (e.g., H emission) are only a small piece of a much larger, temporally extended, puzzle (see, e.g., the detailed discussion in Lee et al., 2010).
The current and past SF traced by these spatially resolved stellar population studies naturally leads to mechanical energy input into the interstellar medium (ISM) in the form of supernovae (SNe) and stellar winds (hereafter collectively referred to as “feedback”). While dwarf galaxies have small potential wells (dynamical masses are typically of order 107–109 M⊙; e.g., Mateo 1998), simulations suggest that it is difficult to eject material from low-mass galaxies completely. Mac Low & Ferrara (1999) and Ferrara & Tolstoy (2000) find that only systems with gas masses 107 M⊙ are susceptible to large-scale mass loss from mechanical feedback. Multi-phase outflows of gas that apparently remain bound to the systems, however, are predicted theoretically (see references above) and verified observationally (e.g., Heckman et al. 2001; Martin et al. 2002; Cannon et al. 2004; Young et al. 2007; Kobulnicky & Skillman 2008).
A parallel question to that posed above is what mechanism(s), if any, serve(s) to regulate the ongoing SF in dwarfs? What properties are found in systems that have hosted a previous burst but now are comparatively quiescent? While such “post-starburst” galaxies are not as well-studied as systems hosting ongoing bursts (see, for example, the sample presented in Lee et al. 2009), they offer a unique opprtunity to study the stellar and gaseous components of systems after vigorous SF episodes have terminated. What halts or slows the SF in these systems? If they are sufficiently massive to maintain most or all of their gaseous component during a SF event, then the cessation of SF cannot be caused by complete “blowaway” of the galaxies’ available fuel.
One decidedly simplistic potential solution is that mechanical “feedback” slowly but cumulatively increases the velocity dispersion and turbulence of the neutral gas (e.g., Joung & Mac Low, 2006). This can heat and distribute the gas over a sufficiently large volume to slow or halt SF. After this energy dissipates in the ISM, the neutral gas will eventually begin to move downward in the potential well of the galaxy. SF would then re-ignite in Jeans-unstable regions. In this simplistic scenario, one would expect localized regions of SF to impact their surroundings as the massive stars contained within undergo the stellar life cycle (e.g., Stinson et al., 2009).
Some dwarf galaxies show abundant evidence for this SF - ISM interaction. The ISM of the M81 group dwarf IC 2574 is littered with holes, shells and depressions (Walter & Brinks, 1999); some of these are associated with remnant stellar clusters within (e.g., Stewart & Walter 2000; Cannon et al. 2005), and some are not. Further, some of these kinematic features directly correlate with both high column density neutral gas and with high surface brightness nebular emission. Recent spatially resolved work has shown that SF is energetically and temporally capable of creating the “Super Giant Shell” structure, and of igniting subsequent SF around the shell rim (Cannon et al., 2005; Weisz et al., 2009a). Similarly, in the M81 group dIrr galaxy Holmberg II, temporally extended SF was found to be energetically capable of creating the numerous holes in the ISM (Weisz et al. 2009b; see also Puche et al. 1992 and Rhode et al. 1999). Taken together, these results suggest that concentrated SF (i.e., “bursts”) and subsequent stellar evolution can (but do not always) lead to the formation of prominent structures in the ISM of dwarf galaxies.
The scenarios discussed above raise another question that is important for understanding the evolution of dwarf galaxies: over what timescales do we expect to find correlations between intense SF, high column density neutral gas (i.e., the “Schmidt” law; Kennicutt 1989, 1998), and the “canonical” SF tracers (e.g., H emission)? Numerous works have shown that current SF correlates well with emission in various wavebands (e.g., UV, optical and infrared, or combinations thereof; Calzetti et al., 2005; Kennicutt et al., 2007; Bigiel et al., 2010). However, we do not yet know if similar correlations hold true for SF intensity 100 Myr ago, 200 Myr ago, and so on. The aforementioned stellar population studies, combined with multiwavelength imaging, provide an opportunity to address this important issue.
In the present work we discuss these science themes as applied to the intriguing dwarf galaxy DDO 165 (a.k.a. UGC 8201). Located on the far side of the M81 group at a distance of 4.47 0.20 Mpc (using the magnitude of the tip of the red giant branch; Karachentsev et al., 2002), this relatively isolated system (tidal index 0.0; Karachentsev et al. 2004) has drawn attention due to its peculiar properties. A sharp boundary or cutoff of stars distinguishes the galaxy’s optical appearance. Stil & Israel (2002a) and the WHISP survey (Kamphuis et al., 1996) noted that the H I kinematics were highly disturbed. A member of the SINGS sample (Kennicutt et al., 2003), the metal abundance in the ISM of DDO 165 is sub-solar (13% Z⊙; see Walter et al. 2007, Croxall et al. 2009). This, in part, contributes to the very weak mid- and far-infrared emission (see images in Walter et al. 2007); Draine et al. (2007) do not estimate a dust mass based on the marginal detections at 70 and 160 m using Spitzer imaging.
The narrowband studies by Lee et al. (2007, 2009), and the stellar population work by Weisz et al. (2008), have identified DDO 165 as being in a post-starburst state. The latter study provided SF intensities as a function of time throughout the galaxy back to 1 Gyr, and a global average value over the Hubble time. This lifetime average star formation rate (SFR) was found to be a relatively quiescent 0.013 M⊙ yr-1; however, over the last 1 Gyr, DDO 165 has formed 17% of its total stellar population. Further, during this last Gyr, the SFR was significantly elevated above the lifetime average (that is, the galaxy was “bursting”; see McQuinn et al. 2010b). Around 25 Myr ago, however, the global SFR plummeted to the current low level; weak H emission (see further discussion below) verifies this dramatic reduction in current massive SFR.
Given these intriguing properties, we wish to ascertain what effects the recent (500 Myr ago to present) SF has had on the ISM of DDO 165. Further, we seek clues as to what mechanism(s) have contributed to the decreasing recent SFR. To this end, we present new H I spectral line imaging of this system, and compare these rich data with optical ground- and space-based imaging. We have discovered a wealth of morphological and kinematic structure in the ISM of DDO 165; we discuss these features in detail in this work. A companion paper uses spatially resolved stellar population analyses to quantitatively study the stellar-ISM interaction over the last 500 Myr in DDO 165; there we find that SF has occurred throughout the entire disk over this interval.
2 Observations and Data Reduction
2.1 VLA Spectral Line Observations
DDO 165 (see basic parameters in Table 1) was observed with the NRAO Very Large Array222The National Radio Astronomy Observatory is a facility of the National Science Foundation operated under cooperative agreement by Associated Universities, Inc. (VLA) in the H I spectral line for program AC842 (PI Cannon). To be sensitive to H I emission on various scales, observations were acquired in the B, C, and D configurations (see discussion in Walter et al. 2008). The VLA was being upgraded to the EVLA during this program; we thus used a set frequency to acquire all data (i.e., Doppler tracking was not applied). The on-source integration times were approximately 6.5 hr in the B array, 3 hr in the C array, and 1.5 hr in the D array. A bandwidth of 1.56 MHz was used over 128 channels, resulting in a velocity resolution of 2.58 km s-1 after online Hanning smoothing. Table 2 shows the observational parameters for each of the observation sessions. The primary calibrator 1331305 (3c286) was used for flux calibration333See http://www.vla.nrao.edu/astro/calib/manual/index.shtml; the secondary calibrator was 1313675, with a flux density of 2.40 Jy.
We reduced the data from each observation separately using the Astronomical Image Processing System (AIPS444The Astronomical Image Processing System (AIPS) has been developed by the NRAO.) package. First, the data were inspected and bad data points removed. Flux, gain, and phase calibrations were then applied. All three data sets were then combined and imaged. Line emission was prominent between 20 km s-1 and 80 km s-1. The task IMAGR in AIPS was used to clean to 2.5 times the RMS noise level. This task was conducted twice, once to create a naturally weighted data cube with an output beam size of 12.5″ 11.3″ ( 0.59 mJy Bm-1) and a second time to create a robust weighted cube (ROBUST = 0.5; Briggs 1995) with an output beam size of 7.5″ 5.9″ ( 0.67 mJy Bm-1). We convolved these cubes to four different circular beam sizes: 20″ 20″ and 15″ 15″ from the naturally weighted cube, and 10″ 10″ and 7.5″ 7.5″ from the robust weighted cube. We explicitly account for the different beam sizes of the dirty and clean maps using residual flux scaling (e.g., Jörsäter & van Moorsel 1995; Walter et al. 2007).
To differentiate noise from real emission, the naturally weighted 20″ cube was spatially smoothed and then blanked at the 2 level. After blanking, the cube was further inspected by hand. Emission was classified as real when it appeared in three or more consecutive channels. This master blanked cube was then used to blank all cubes, ensuring that the same regions contribute at each resolution. Using the blanked cubes, H I surface brightness, velocity field, and velocity dispersion maps were created using the task XMOM in AIPS.
2.2 Optical Observations
H observations of DDO 165 were obtained with the Bok 2.3 m telescope at Kitt Peak National Observatory (KPNO) on May 29, 2001. The 2K CCD imager was used for 1000 seconds of on-source exposure time. The CCD read noise was 8.5 e- and the gain was set to 3.4 e- ADU-1. An 88 mm Andover 3-cavity interference filter was used; this filter is sensitive to both H and to [NII] emission. The H and R-band data were originally presented in Kennicutt et al. (2008), and detailed image reduction and calibration information can be found there. The 3 detection threshold is 2 10-18 erg s-1 cm-2.
R-band observations of DDO 165 were obtained with the KPNO 2.1 m telescope on April 13, 2002. The T2KA detector was used for 420 seconds of on-source integration time. The CCD read noise was 4 e- and the gain was set to 3.6 e- ADU-1. The image was reduced following standard procedures using IRAF555The Image Reduction and Analysis Facility (IRAF) is distributed by the National Optical Astronomy Observatories, which are operated by AURA, Inc. under cooperative agreement with the National Science Foundation.. The data are also discussed in Kennicutt et al. (2008).
HST observations of DDO 165 were obtained using the Advanced Camera for Surveys (ACS) on March 17, 2006. F555W and F814W filters were used. The data were processed by the standard HST pipeline. The V and I band photometry was presented in Weisz et al. (2008); the integration times were 9536 seconds in each filter. The treatment of the HST data are discussed in detail in Paper II.
3 Multiwavelength Properties of DDO 165
3.1 H I Morphology and Dynamics
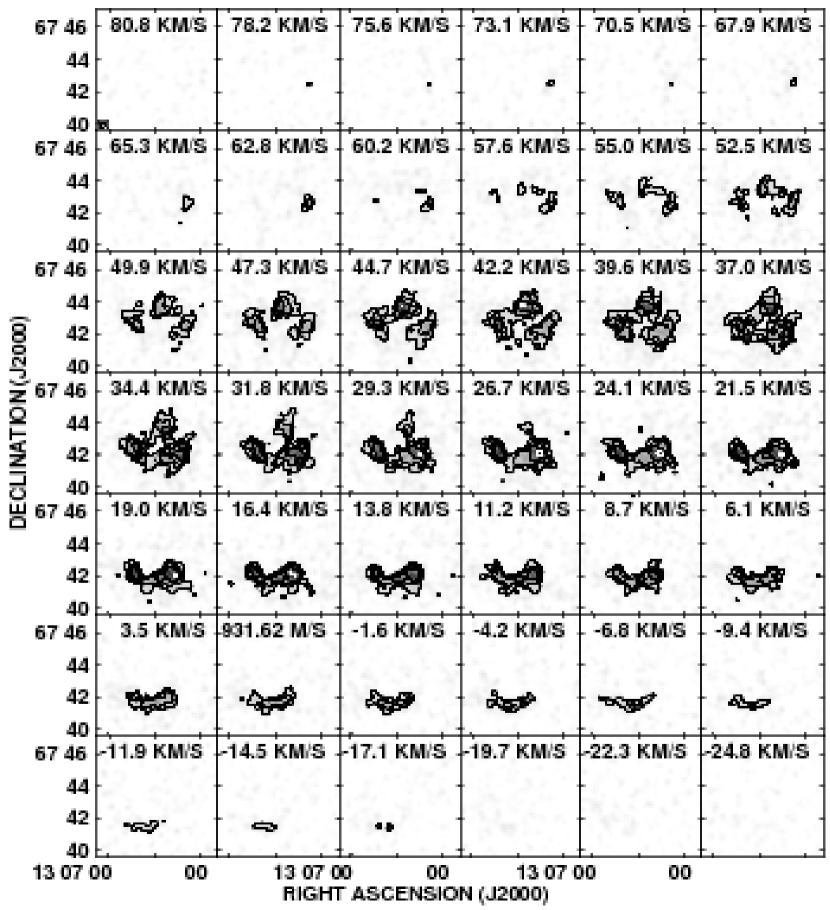
H I emission from DDO 165 is detected in the velocity range 20 to 80 km s-1. Figure 1 presents the individual channel maps from the 20″ 20″ datacube. The curious nature of the H I in DDO 165, which was previously noted by Kamphuis et al. (1996) and Stil & Israel (2002a), is immediately evident in this figure. If solid-body rotation were present (as is typical for dIrrs; Skillman 1996), it would appear as a smooth change in the position of neutral gas as a function of velocity (e.g., Cannon et al., 2010). Ordered rotation is decidedly absent in DDO 165.
The channel maps reveal two main components of the H I gas. Moving upward from negative velocities, there is emission in nearly all channels from the “southern” H I component, which contains two column density peaks on the east and west sides of the system (consider, for example, the panel at 21.5 km s-1). The “northern” H I component appears between 24 to 58 km s-1. These two features surround a large cavity in the center of the H I distribution. This H I hole is especially evident between radial velocities of 50 to 25 km s-1. We discuss this “hole” in detail below.
The H I flux from each channel of the 20″ 20″ datacube is plotted as a function of velocity in the global profile presented in Figure 2. The profile is approximately Gaussian, although the higher velocity side contains significantly more flux than the lower velocity side; it is very similar in shape to the single-dish profile shown in Huchtmeier et al. (2003). The departures from symmetry are suggestive of the presence of multiple H I components (see discussion above); our kinematic analysis verifies this interpretation (see § 4). The systemic velocity, Vsys (29 2) km s-1, is found from the velocity at full width half maximum of this global profile; at the adopted distance of 4.47 0.20 Mpc (Karachentsev et al., 2002), this low systemic velocity implies a significant peculiar motion within the M 81 group.
The total H I flux integral was derived from the 20″ cube, yielding SHI = 23.2 2 Jy km s-1. This is 18% lower than the single dish flux integral of 28.2 Jy km s-1 found by Huchtmeier et al. (2003) using Effelsberg 100 m observations. We note that our maximum single-channel flux density of 550 50 mJy is in fair agreement with the corresponding maximum value from Huchtmeier et al. (2003) of 601 11 mJy. As discussed above, we applied residual flux scaling in the imaging process, and thus the small difference between these global flux integrals is most likely due to the lack of very short baselines in our interferometric observations, and our corresponding insensitivity to diffuse, extended neutral gas. The total detected H I mass is (1.1 0.3)108 M⊙.
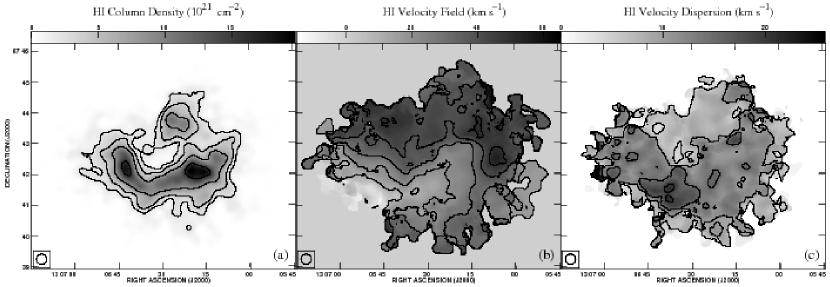
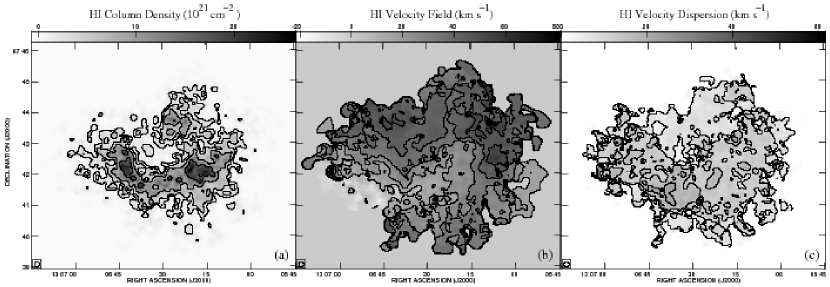
Figures 3 and 4 show moment zero (representing H I surface density), moment one (representing intensity-weighted velocity field), and moment two (representing velocity dispersion) images at 20″ and 10″ resolution, respectively. The H I column density peaks in three regions in DDO 165; the two largest peaks (NHI 2 1021 cm-2) are associated with the southern component of the system, which comprises 85% of the total H I mass. The northern component reaches a maximum column density of NHI 1.1 1021. Low column density gas connects the northern and southern features, primarily in the western section of the disk. We estimate the mass of the northern component to be (1.6 0.4) 107 M⊙.
A central H I depression is very prominent in the moment zero images. The physical diameter of this feature is 2.2 1.1 kpc (see further discussion below), making this one of the largest such known in a dwarf galaxy. We hereafter refer to this feature as the central H I hole. The size and morphology is reminiscent of the central holes in several well-studied systems (e.g., M81 dwA, Sargent et al. 1983; Sextans A, Skillman et al. 1988; Holmberg I, Ott et al. 2001). Note that there is only very low column density neutral gas in the northeast region of the galaxy. In that regard, the central hole can be considered incomplete, as it is not surrounded by higher column density gas around the entire circumference.
As expected from the channel maps (see Figure 1), the representations of the velocity field of DDO 165 shown in Figures 3 and 4 are very complex and highly disturbed. There is evidence for rotation of the southern component, although the axis of rotation is position dependent. In the southeast region, the isovelocity contours suggest rotation on a position angle of 310°; however, the central region of the southern component appears to be rotating more or less east-west. The northern component shows weak evidence for rotation at a third position angle (0°). The velocity field of DDO 165 is highly irregular compared to most dwarf galaxies of comparable mass (see, e.g., Begum et al., 2008); we explore the velocity field further in § 4.
We attempted a tilted ring analysis of these velocity fields using the GIPSY666The Groningen Image Processing System (GIPSY) is distributed by the Kapteyn Astronomical Institute, Groningen, Netherlands. task ROTCUR. We experimented with numerous iterations of the fit parameters, including dynamical center position, inclination, and rotation position angle. Since ROTCUR assumes a symmetric velocity distribution for its input, it is perhaps not surprising that our fits did not identify a unique set of parameters to describe the complex velocity field of DDO 165. The primary difficulty is in identifying a unique dynamical center position; holding other parameters constant, we were able to derive a convergent solution for essentially any central position. In a final attempt to attain a successful solution, we convolved the velocity field to low resolution (1′), but were again unable to derive an unambiguous rotation curve.
Previous analysis of the H I kinematics by Stil & Israel (2002a) identified similar difficulties in fitting the H I velocity field. The position angle of the maximum velocity gradient from that work was found to be (130° 10°), on a line from southeast to northwest (equivalent to [310° 10°] measured east of north). In our tilted ring analysis, we identify the same position angle for the largest coherent velocity gradient. We again stress that a unique rotation curve was not identified, but nonetheless use this position angle in the position-velocity (PV) analysis presented in § 4.1. We note that no unique optical position angle is listed in the Catalog of Principal Galaxies (Paturel et al., 2003) or the Sloan Digitized Sky Survey (Abazajian et al., 2009).
The velocity dispersion images shown in Figures 3 and 4 reveal interesting characteristics of the H I kinematics. The southern component has a higher average velocity dispersion (12 km s-1) than the northern component (8 km s-1); the difference is larger than the velocity resolution of the data (2.56 km s-1). The 12 km s-1 average in the southern component is slightly larger than the characteristic values found for three THINGS dwarf galaxies in Tamburro et al. (2009). Interestingly, the characteristic value for the northern component is in good agreement with that average. Note that is elevated to values larger than 20 km s-1 in the center of the southern component. This region of increased velocity dispersion is located between the two column density peaks. It is coincident with the position at which the isovelocity contours show significant changes in direction (see also discussion above). Taken as a whole, these interesting characteristics of the H I morphology and dynamics prompted a detailed investigation of the small-scale gas motions within DDO 165; we discuss the results of those analyses in § 4.
3.2 Comparing the Stellar and Gaseous Components
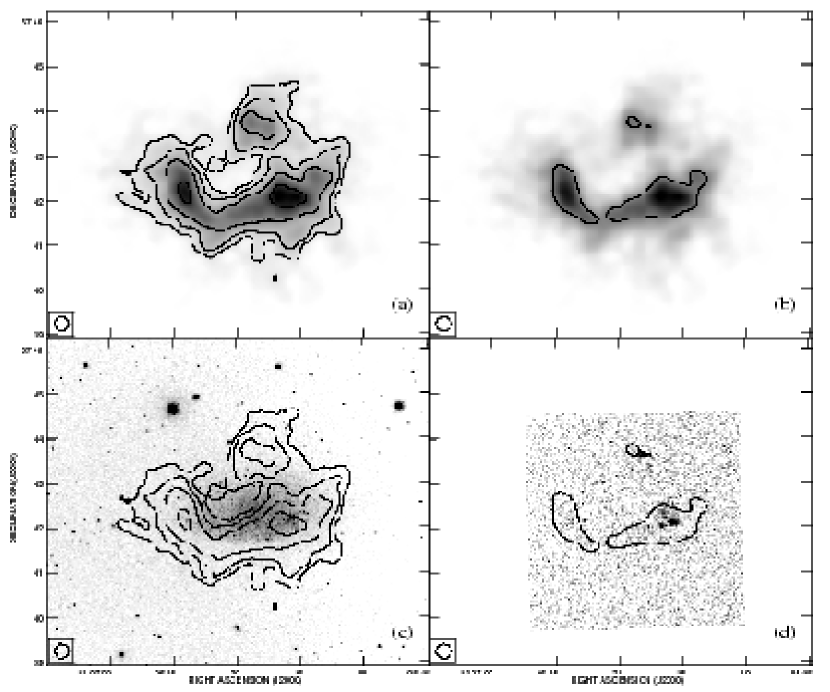
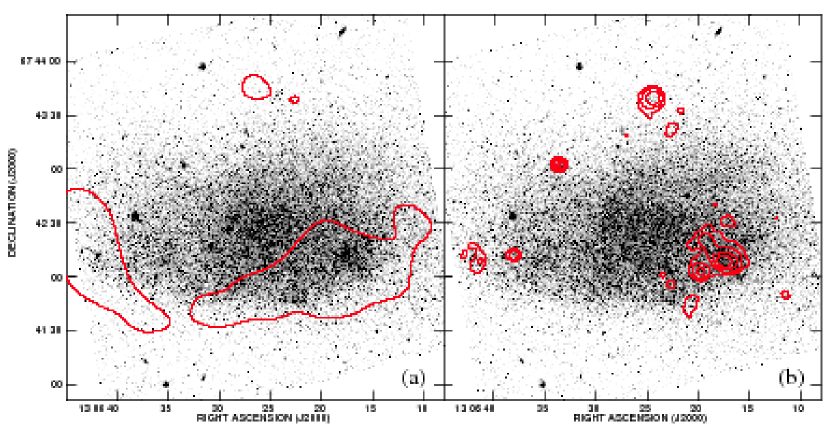
In Figure 5, we compare the neutral gas distribution with optical observations. Figures 5(a) and (b) show the same moment zero image as Figure 3. The contours in Figure 5(a) are the same as in Figure 3; the contour level in Figure 5(b), used below and throughout Paper II, is at the 1021 cm-2 level, representing the canonical SF threshold (Kennicutt 1989, 1998). Note that all three aforementioned column density peaks exceed this surface density level. Figure 5(c) compares the R-band image with the H I; the contours are the same as in Figure 5(a). The high surface brightness optical component is not centered on the H I hole; note the dramatic drop in stellar surface brightness in the southern component. Interestingly, this boundary is coincident with substantial H I column densities (NHI 8 1020 cm-2). The northern H I component is significantly offset from the main optical body of DDO 165.
Figure 5(d) compares the locations of active SF as traced by H emission with the locations of high H I surface density; the contour is again at the 1021 cm-2 level. Each H I surface density maximum has associated H emission. We find 10 discrete H regions, and catalog their coordinates and flux measurements in Table 3. The total flux from these 10 regions is 8.5 10-14 erg s-1 cm-2. Our total H flux agrees with the global value presented by Lee et al. (2009) at the 30% level; we attribute the difference to diffuse H flux not enclosed in the 10 discrete H regions summarized in Table 3.
Figure 6 presents a comparison of the H I and H emission with the HST V-band image (see also the detailed discussion in Paper II). The H I contour is at the 1021 cm-2 level, while the H contours are at levels of (2,4,8,16) 10-18 erg s-1 cm-2. Note by comparison with Figure 5 that the large central H I hole is offset from the center of the stellar distribution. The truncated stellar population in the southern region is again evident; the H I surface density is highest along this feature. Ongoing SF is associated with the largest stellar association in the southwest. The H emission in the southeast is apparently not associated with high surface brightness stellar clusters and likely arises from individual OB stars.
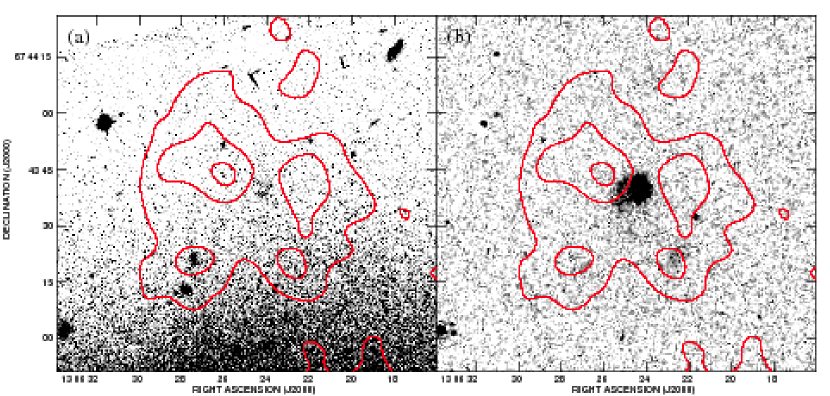
The nature of SF in the northern region of DDO 165 is very interesting. The stellar density maps in Weisz et al. (2008) show a smooth decrease in density of both red and blue stars from the central maximum to the northern region. A small over-density is apparent at the location of the northern H I component in the blue stellar density map. Yet, the northern H I cloud has dense neutral gas above the 1021 cm-2 level as well as a compact H source. To further investigate this curious northern component, Figure 7 shows a closer view of the HST and H images of this region, overlaid with contours from the 10″ moment zero image (see Figure 4). This zoomed field clearly shows a stellar association coincident with the H maximum, nestled between two H I surface density peaks. Further, the very diffuse H emission features seen at (13:06:22.5, 67:43:20) and (13:06:27.5, 67:43:20) are also associated with local H I over-densities that are smoothed out in the lower resolution surface density images.
4 Kinematic Analysis of the HI Gas
DDO 165 displays numerous abnormal characteristics. Its velocity field is highly confused, without obvious signatures of coherent global rotation. Its stellar distribution is abruptly truncated in the southern region, where the bulk of the neutral gas mass and ongoing SF are located. A region of ongoing SF is located well outside of the main optical body, cospatial with surprisingly dense neutral gas in the northern H I component. A kpc-scale hole dominates the morphology of the neutral gas. We now seek to better understand the origins of these enigmatic features in DDO 165 using the kinematic information available in the neutral gas.
4.1 Spatially Resolved Position-Velocity Diagrams
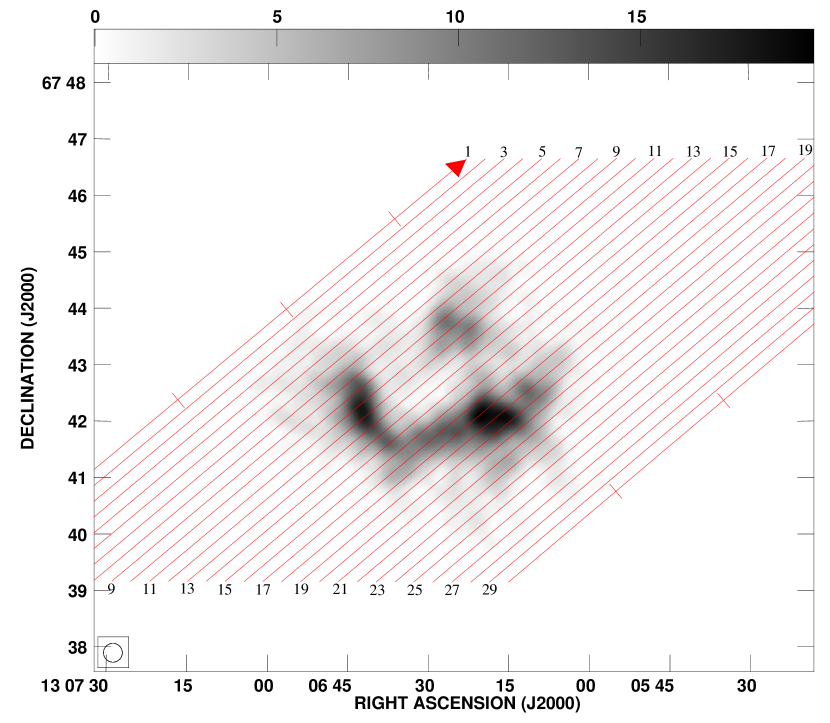
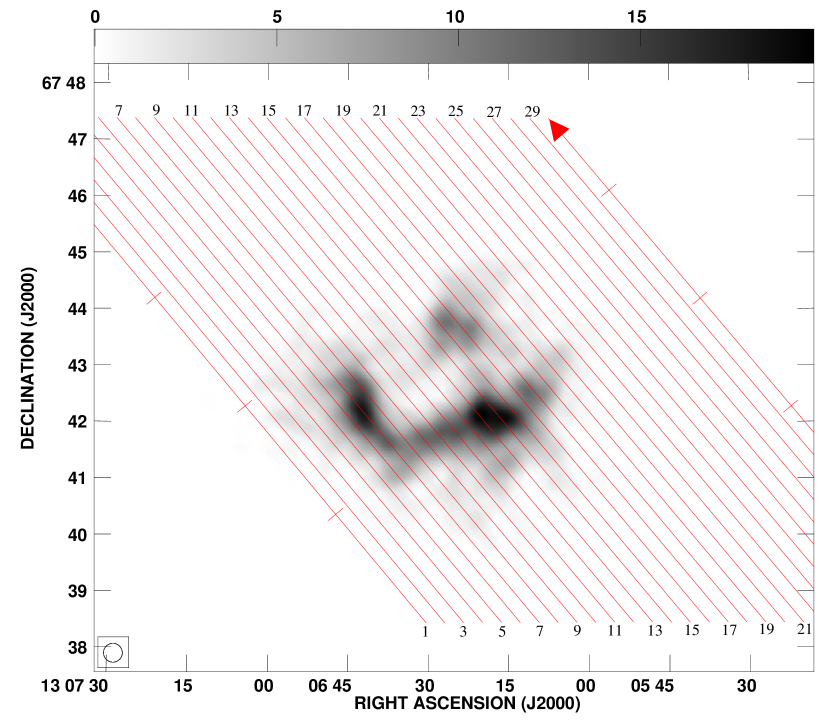
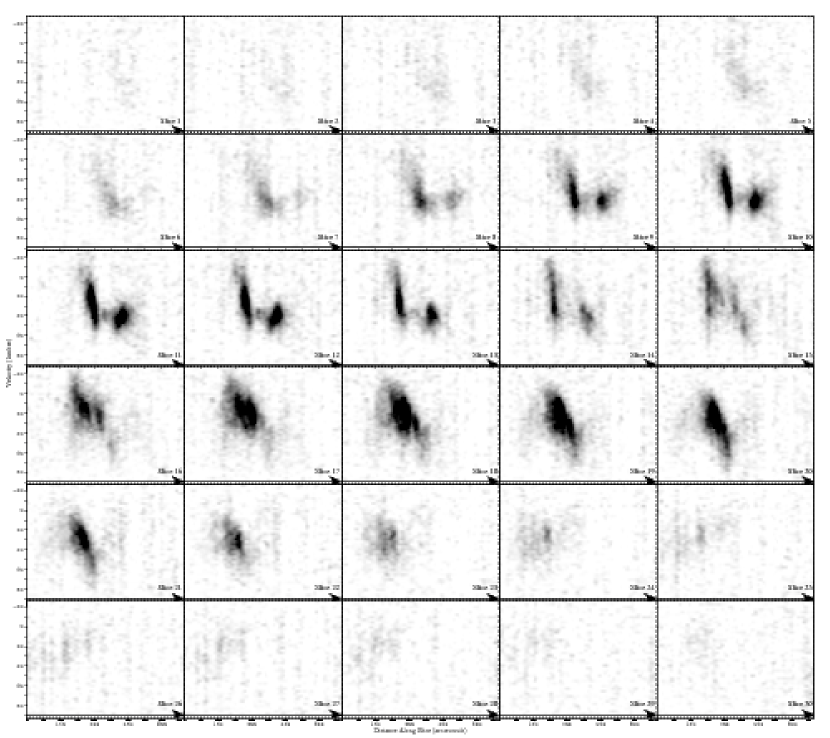
The unusual H I properties of DDO 165 led us to first analyze the global neutral gas kinematics. We thus began by using GIPSY/SLICEVIEW to create 60 PV slices through the 20″ datacube. 30 slices are taken along the major axis (310° 10°; see § 3.1), and 30 are taken 90° from the major axis. These slices are the width of, and separated by, the low-resolution beam size (20″). Figures 8 and 9 show the slice locations overlaid on the 20″ moment zero map for PV cuts at position angles of 310° and at 40°, respectively. Note that two adjacent PV cuts overlap by half of the beam width; thus every other PV cut is independent. By creating the slices with a width of and separated by the beam size, we can study the kinematics throughout the entire galaxy and minimize selection effects caused by arbitrary slice locations.
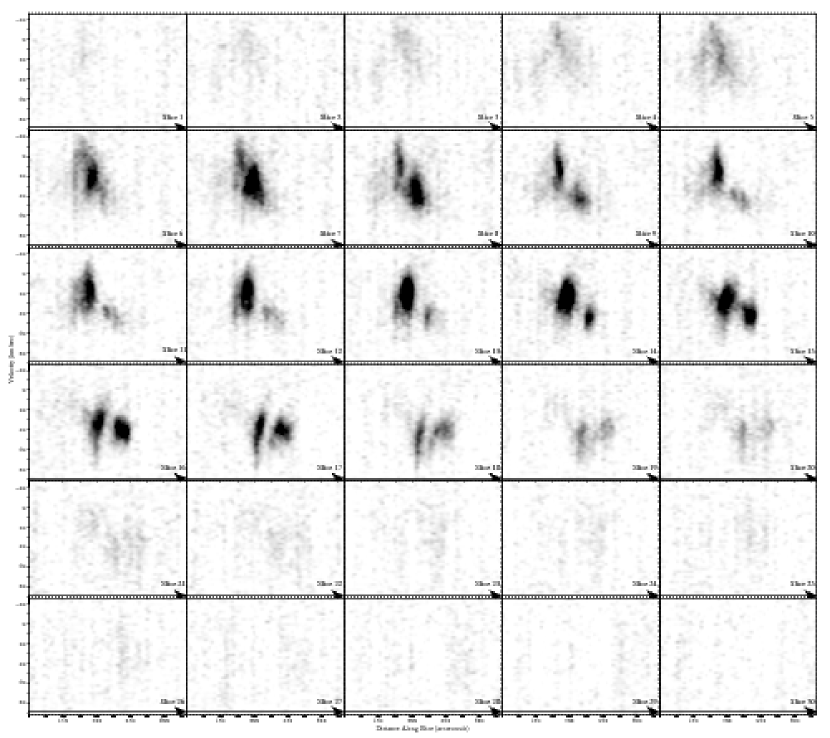
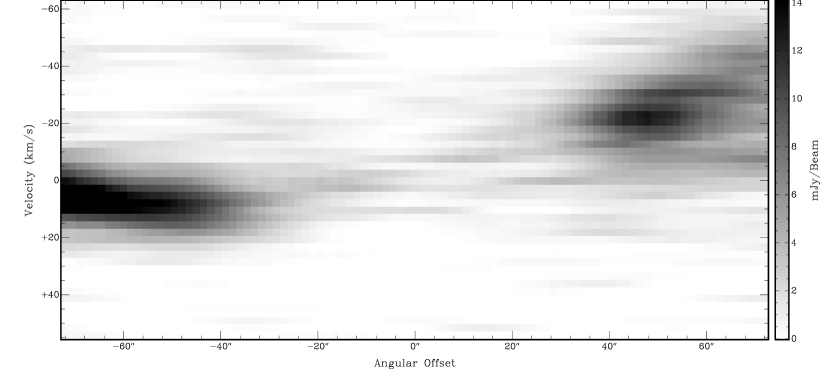
The PV diagrams along each of these slices are shown in Figures 10 and 11 for the major and minor axes, respectively. To aide interpretation, directional arrows are shown in both the locations of the slices (Figures 8 and 9) and in the resulting PV diagrams (Figures 10 and 11). Moving from southeast to northwest along the slices shown in Figure 8 corresponds to moving from left to right in a given panel of Figure 10. Similarly, moving from southwest to northeast along the slices shown in Figure 9 corresponds to moving from left to right in a given panel of Figure 11. The tick marks along the first and last slices in Figures 8 and 9 are at the 150″, 300″, 450″, and 600″ positions, corresponding to the same distance markers on the abscissae of Figures 10 and 11.
4.1.1 Kinematically Distinct HI Components
The major axis PV slices (Figures 8 and 10) immediately demonstrate that the northern and southern H I components are kinematically distinct. Moving from slice 8 to slice 13, the two H I components appear at velocities in common (30–60 km s-1, though the southern component subtends a much larger total velocity range) but are separated by physical distances of 1 kpc or more. The region between these two features is easily identified as the giant H I hole in the center of the galaxy; slices 9 through 15 clearly show the evacuated nature of the central hole and the lack of high surface brightness H I emission from within it.
The kinematic discontinuity between the northern and southern region is confirmed in the minor-axis PV cuts shown in Figures 9 and 11. Note that the cuts that pass through the northern H I component in Figure 9 also pass through gas in the western region of the southern H I component; however, the cuts that pass through the northern H I component in Figure 8 pass through gas in the eastern region of the southern H I component. While the major-axis cuts that pass through the northern component cross the giant H I hole, the minor axis cuts that pass through the northern component do not. And yet, remarkably, slices 13 through 17 in Figure 11 clearly show that the northern and southern H I components are separated physically and without H I emission connecting them in velocity space.
Kinematically distinct H I features have been observed in other nearby dwarf galaxies, including NGC 1705 (Meurer et al., 1998), NGC 1569 (Stil & Israel, 2002b), NGC 625 (Cannon et al., 2004), and NGC 5253 (Kobulnicky & Skillman, 2008). It is interesting to note that each of these systems is a well-studied, “canonical” dwarf starburst galaxy, typically with multi-phase outflows and high equivalent width H emission from ongoing SF. In contrast, DDO 165 shows only very weak ongoing SF. However, the intensity of SF was greater in the past, as established in Weisz et al. (2008), Lee et al. (2009), and McQuinn et al. (2010b). We discuss the recent SF history in detail in Paper II.
We note that based on the H I kinematics alone, we are able to exclude certain origins for the kinematically distinct H I components. Since the components have velocities in common but are separated by more than a kpc, it is unlikely that two superposed or counter-rotating disks can explain the features seen in the PV diagrams. Similarly, a coherently rotating disk (common in dIrr galaxies) is clearly excluded. Finally, while the ISM is clearly highly disturbed (see also the discussion in § 4.1.2 below), recent simulations have shown that most of the energy from turbulence is contained on scales of a few hundred pc or less (Joung & Mac Low, 2006); it is unlikely that turbulence could be capable of remaining coherent over kpc scales or of injecting sufficient energy to cause bulk motion of the 107 M⊙ of neutral gas associated with the northern H I component.
The H I kinematics alone do not, however, allow us to differentiate between an infall or an outflow (i.e., stellar feedback) origin for the kinematic discontinuity. The similar velocities of the two H I components is the primary difficulty in differentiating between these two scenarios using our H I data. If the northern component has been ejected in a massive blowout event, then we might expect H I at velocities intermediate between the two components; such gas is not seen in our PV diagrams. Similarly, if the northern cloud is falling into the main disk of DDO 165, we might expect tenuous H I gas extended behind it, both spatially and in velocity space (see, e.g., Hunter et al. 1998). After smoothing our data to a 90″ 90″ beam size, no such extended structure is found. Further, the infall hypothesis has difficulty with the evacuated giant H I hole, which would lie ahead of the motion of the northern component in an infall model.
We conclude that simple outflow and infall hypotheses have inconsistencies with our H I data, but that both remain viable mechanisms for the creation of the two H I components of DDO 165. We are mindful that relative motion between the two H I components remains possible if the entire DDO 165 system is seen face-on. Without additional avenues with which to exclude the infall hypothesis based on H I kinematics, we interpret the nature of the kinematically distinct northern component in the context of the past SF history and the blowout paradigm in Paper II.
4.1.2 Localized High-Velocity HI Features
The spatially resolved PV slices through the 20″ datacube reveal a remarkable wealth of localized, high-velocity neutral gas features in the disk of DDO 165. These features are spatially compact but extended in velocity space; such features have been observed in a few starbursting dwarf galaxies (e.g., NGC 625 - Cannon et al. 2004; NGC 5253 - Kobulnicky & Skillman 2008). Examining the major-axis PV slices (Figures 8 and 10) highlights high-velocity features in the southeast region of the H I distribution. Slices 8 through 15 cross the southeast H I column density peak, the giant H I hole, and the northern H I component. Note that the velocity extent of the H I gas in the southeast region spans more than 50 km s-1 in each of these slices, from 0 km s-1 through 50 km s-1. The 20″ slice width spans only 430 pc at the adopted distance.
The high surface density neutral gas in the southwest region is extended along the PV slice major axis, and is thus more easily studied in the minor-axis slices shown in Figures 9 and 11. There, slices 9 through 11 sample the center of the southern H I component before traversing the giant H I hole. While the velocity extent of these H I features is slightly smaller than the southeast features discussed above, they still span more than 40 km s-1, from 10 km s-1 through 30 km s-1. Continuing westward along the southern component, slices 13 through 15 pass through the main H I column density peak and its associated active SF region. The 40 km s-1 velocity extent of the neutral gas is again seen in the southern component. Finally, moving from slice 16 through slice 18, the material in the western disk is also extended in velocity space. These localized features span up to 50 km s-1, from 20 km s-1 through 70 km s-1 (see especially slice 17).
The physical conditions of the gas in the southern and northern components appear to be quite different. Most of the gas in the southern component is extended in velocity space (confirming the elevated velocity dispersion discussed in § 3.1). However, all slices through the northern H I component (slices 9 through 14 in the major-axis PV diagrams shown in Figures 8 and 10, and slices 13 though 18 in the minor-axis PV diagrams shown in Figures 9 and 11) show it to be comparatively compact in velocity space, spanning 20-25 km s-1 along both axes.
The information in these spatially resolved PV diagrams, and in the velocity dispersion images discussed above, highlight a factor of 2 difference in velocity extent of localized gas features between the northern and southern H I components. Recall by examining Figures 5 and 6 that the southern H I region contains the two largest H I column density maxima, the most luminous H emission source, and a much higher stellar density than the northern region. These high velocity gas features suggest that dynamical effects, either localized due to feedback from recent SF or globally due to an interaction, are having a dramatic impact on the neutral gas in the southern region of DDO 165. We quantitatively interpret the nature of these high velocity features in the context of the feedback model in Paper II.
4.2 Kinematic Search for Coherent H I Holes and Shells in the ISM
As discussed in § 1, feedback from massive star evolution can directly shape the surrounding ISM. The post-starburst characteristics, disrupted velocity field, and extended velocity features in the neutral ISM of DDO 165 suggest that this feedback mechanism could be especially efficient at creating ISM structures. In a simplistic case, one would expect multiple holes and shells in the neutral gas if the past SF has created coherent structures via energy deposition in stellar winds and/or SNe, and if those structures had not yet been erased by either dynamical processes or by the re-establishment of pressure equilibrium with the surrounding multi-phase ISM. We thus undertook a search for such structures in both PV space and radius-velocity (RV) space. We use the KPVSLICE and KSHELL tools in the KARMA777The KARMA visualizations software package was developed by Richard Gooch of the Australia Telescope National Facility (ATNF). visualization software package, as well as GIPSY/SLICEVIEW. Note that each type of analysis has certain advantages, but the primary gain in moving from PV to RV space is the increased signal-to-noise ratio as one averages over more pixels than in a PV slice.
In this kinematic exploration, we characterize potential coherent structures using the formalism described by Brinks & Bajaja (1986). H I holes and shells are classified into three groups. In a Type 1 hole, H I gas has been completely evacuated from a particular region, and no signature of expansion is apparent in either PV or RV space. In a Type 2 feature, one side of the hole has broken out of the plane of the galaxy, while the other side retains a shell structure. These Type 2 structures are perhaps the most difficult to identify; in PV space they appear as broken ellipses (see also the numerical simulations of these structures discussed by Silich et al. 1996). Finally, a Type 3 hole represents a complete, expanding shell that is easily identified in RV space as an unbroken half-ellipse or in PV space as a complete ellipse. Type 3 holes provide the most kinematic information, as both a diameter and an expansion velocity are directly measurable in RV space.
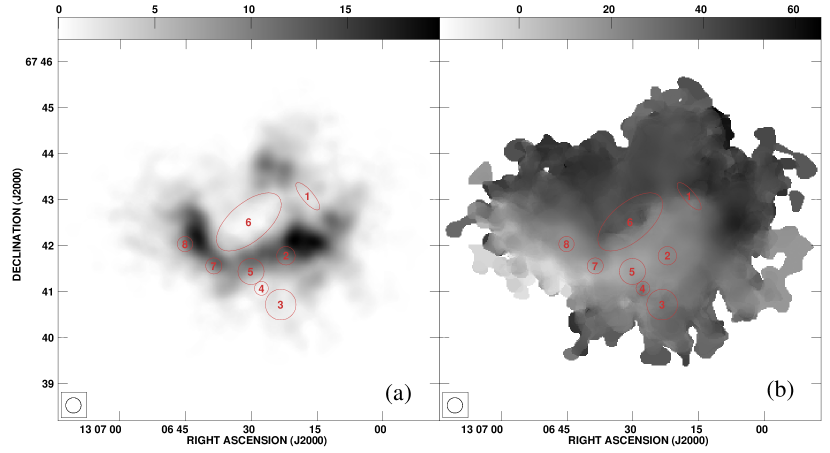
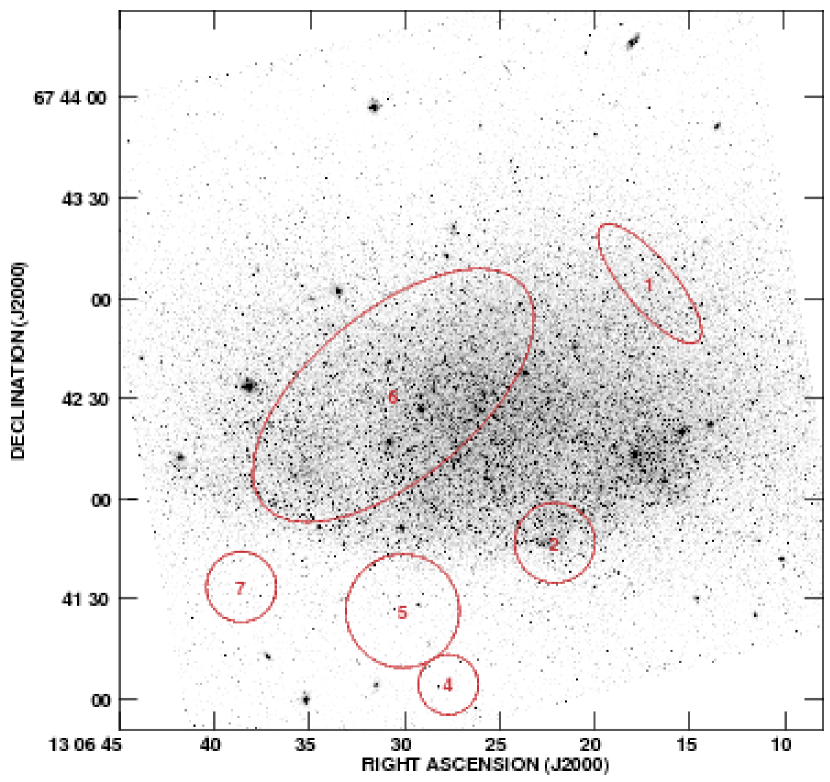
We searched for these types of structures in both the naturally weighted cubes (15″ and 20″, sensitive to large-scale holes and shells) and in the robust weighted cubes (7.5″ and 10″, sensitive to smaller holes and shells). We examined PV cuts across the entire system (see discussion above and Figures 10 and 11) and on smaller scales and at arbitrary position angles. We also examined RV diagrams with a minimum radius of the beam size throughout the galaxy. We identified 8 holes and shells in the neutral ISM of DDO 165 in this analysis; the locations and properties of these holes are listed in Table 4 in order of increasing central Right Ascension position. Their positions, sizes, and orientations are shown overlaid on the 20″ H I column density image and velocity field in Figure 12. Forunately, 6 of these 8 structures fall within the HST field of view; as Figure 13 shows, Holes #3 and #8 have no detailed stellar population information available.
The most easily identifiable structure is the giant H I hole (identified as #6 in Table 4 and in Figures 12 and 13). This appears as an obvious evacuated cavity in surface density maps and in the spatially resolved PV cuts (see discussion in § 4.1.1). A PV cut through Hole #6 is shown in Figure 14; note the evacuated nature of the hole. RV analysis of this structure shows no expansion signature, and we thus classify this structure as a Type 1 hole. Note that the major axis of the hole is aligned with the major axis used to create the PV slices shown in Figures 10 and 11. As Figure 13 shows, this hole occupies a significant fraction of the entire galaxy, measuring 2.2 1.1 kpc in diameter. The stellar density within the hole is non-uniform, with areas of higher density in the southeast and west, and sampling the transition into the halo in the north.
We identify two other Type 1 holes in the neutral ISM of DDO 165. Hole #4 appears as a slight under-density in the H I column density map (see Figure 12). It is located well south of the characteristic stellar “cutoff” in the southern region of the galaxy (see Figure 13). It is the smallest structure that we detect with confidence and is only resolved in the robust-weighted datacubes. Hole #1 is a highly elliptical feature (nearly 1 kpc in length but only 400 pc wide) located in the northwest region of the system. The stellar density is somewhat lower than that within Hole #6.
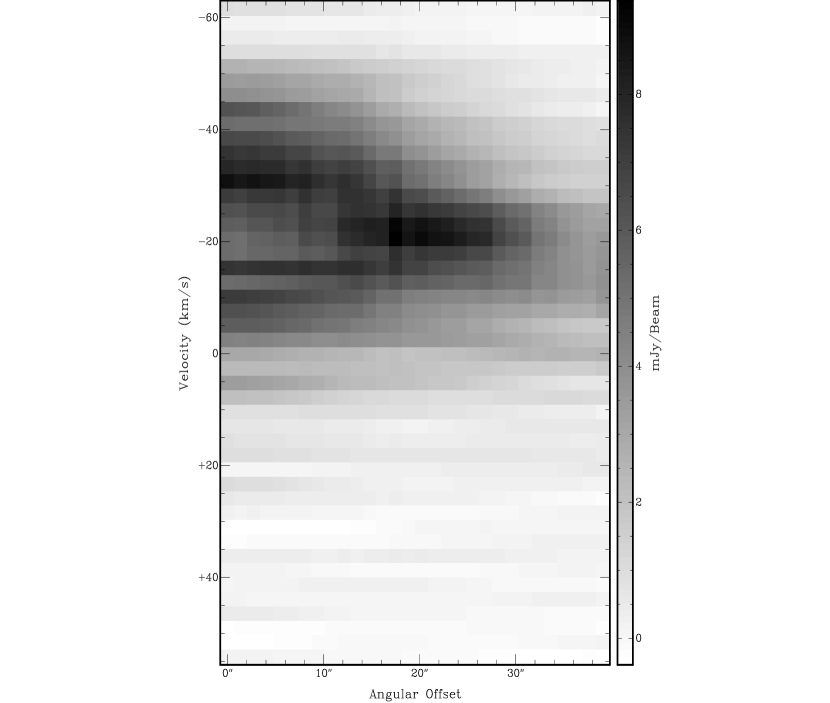
We identify five Type 3 holes in our analysis; Holes #2 and #3 are apparent in both PV and RV space, while Holes #5, #7, and #8 are only found in the RV plane. Holes #2 and #8 share similar characteristics; both are located on the edge of a large H I column density maximum (but offset from the regions of high H equivalent width). Figure 13 shows an apparent over-density of stars near the center of Hole #2; Hole #8 falls outside of the HST field of view. Hole #3 is located in the outer disk in a region of comparatively low H I surface density; it is the largest expanding structure that we identify in this analysis. Holes #5 and #7 are located in similar regions, immediately to the south of the main stellar disk, just overlapping the transition region to high surface densities (see Figure 13). Both structures are coincident with some of the high velocity H I features identified in § 4.1.2. As an example of the clarity of the expansion signal in the RV plane, we show in Figure 15 an RV diagram of Hole #5; note the closed half-ellipse structure. The diameter of the structure is estimated to be 17″, and the minimum velocity is estimated to be 7 km s-1. We estimate the errors on these measurements to be at the 30% level.
The five structures with kinematic information span a range of physical sizes (from 400 pc to 900 pc) and measured expansion velocities (7 km s-1 to 11 km s-1). We stress that coherent neutral gas structures can elude our detection methods in three ways. First, expanding structures may have expansion velocities below our 2-channel velocity resolution limit (5.12 km s-1). Second, the structures can be smaller than our reliable physical resolution limit (165 pc from the 7.5″ datacube). Finally, and perhaps most importantly, the expansion signature can be taking place out of our line of sight. We speculate that this effect may in part explain the lack of Type 2 holes recovered by our analysis.
A region of significant interest is the northern H I component; recall the kinematic discontinuity between this region and the southern H I component (see discussion in § 4.1.1). The northern H I component harbors a visually identified stellar association and ongoing SF (see Figures 6 and 7). We searched for signatures of expansion caused by localized feedback from this SF, but none were found. The separation of the northern and southern H I components, both physically and in velocity space, is apparently not the result of feedback from recent SF in the northern region alone. We consider this issue in more detail in Paper II.
Note that we do not detect holes or shells directly associated with either of the H-bright SF regions in the main disk (compare Figures 13 and 5). While these SF regions are coincident with high velocity gas features (see discussion in § 4.1.2), the recent (10 Myr) feedback from massive stars has not produced coherent H I structures large enough to be prominent at our resolution limit. We postulate that in these regions, the mechanical energy from SF has increased the local velocity dispersion of the gas, producing incoherent gas motions that are extended in velocity space but that are not identifiable as coherent H I holes or shells.
5 A Simplistic Estimate of H I Structure Energetics
The coherent H I structures that show evidence for expansion offer an opportunity to derive the amount of energy needed to create the structure. The basic approach is to adopt the observed expansion velocity as the constant, past expansion velocity. One then uses the physical radius of the structure to infer a kinematic age, and an estimate of the mass of gas within it (i.e., assuming a volume density of neutral hydrogen) to derive the amount of energy needed to evacuate the region. This energy may originate from SNe and stellar winds, and may be tied fundamentally to the recent SF patterns in a given region of a galaxy. Many past investigations (e.g., Walter & Brinks, 1999) have adopted this formalism to infer the energetics of holes and shells in external galaxies.
Most applications of this formalism use the single-blast model of Chevalier (1974). Here, the energy of an expanding H I shell is given by
| (1) |
where Ehole is the energy needed to create the expanding structure in ergs, n0 is the H I volume density (for our calculations we assume n0=0.1 cm-3, an appropriate average value for the outer disks of dwarf galaxies and for DDO 165; see detailed discussion in Paper II), d is the diameter of the shell in parsecs, and vexp is the observed expansion velocity in km s-1. This simplistic model has well-known difficulties; some of the most pronounced include the unknown conversion efficiency of SNe energy into gas momentum (assumed to be 100% in a direct application of Equation 1), the explicit values of hydrogen volume density as a function of position, the shape and depth of the gravitational potential well prior to the creation of the hole, among many others. We stress that the above estimate is uncertain at the 50% level or more; however, it is used frequently in the literature and we thus include its application here for ease of comparison with previous works. Following Weisz et al. (2009b) and references therein, we revise some of the assumptions above to attempt a more accurate calculation of the H I hole energetics in Paper II.
For the Type 3 holes identified in DDO 165, we list in Table 4 their kinematic ages in Myr and the energetic requirements derived using Equation 1. These energies can be compared to the canonical energy output of a Type II SN explosion, 1051 erg (Burrows, 2000). One can thus infer the number of massive stars required to create a given hole. We note that the energies derived in Table 4 are uncertain due to the assumption of a constant expansion velocity. The kinematic ages range from 20–50 Myr, while the energy requirements are in the 1051–1052 erg range. These values are in good agreement with the creation energies derived in previous studies of H I holes in dwarf galaxies (see, e.g., Walter & Brinks 1999, Weisz et al. 2009b, and references therein). Taken at face value, these modest energy requirements suggest that the creation of coherent H I holes and shells can be accomplished by modest numbers of massive stars. However, the small number of detected holes, and the extended recent SF throughout DDO 165 (see Weisz et al. 2008), cloud this simplistic interpretation and provide the motivation for the comparison of H I and stellar energetics that is the focus of Paper II.
The lack of coherently expanding neutral gas structures associated with the H-luminous regions in DDO 165 can be explained by three possible scenarios. First, the timescale for the creation of coherent H I structures from small numbers of massive stars could be longer than the characteristic timescale for H emission (10 Myr). Second, the ongoing SF in DDO 165, concentrated in the H-luminous regions, could be too weak to create such structures at all; the efficiency of individual SNe at accelerating natal neutral gas could be very low. Third, if that efficiency is low, then the creation of such structures might require SF that is extended temporally in order to inject the requisite amounts of energy. Evidence is mounting that these long burst episodes are important in the ISM of dwarf galaxies. Elevated SFRs have been measured to span hundreds of Myr, much longer than the instantaneous SF traced by ionizing photons (McQuinn et al. 2009, 2010a, 2010b). These temporally extended SF episodes have been shown to be energetically capable of creating the H I holes observed in nearby galaxies (Weisz et al. 2009a, 2009b). Taken together, these lines of evidence suggest that it is not surprising that the holes and shells we observe in DDO 165 are in fact not associated with the currently most massive stars.
While the expanding holes in DDO 165 provide important kinematic information, the Type 1 holes are equally intriguing. We again draw attention to Hole #6, the giant structure that spans a 2.2 1.1 kpc region offset from the center of the stellar body. This structure has been nearly completely evacuated of neutral gas (NHI 1020 cm-2 at 10″ resolution); given the number of young stars located within the hole (see Paper II for details), it is logical to conclude that whatever mechanism conspired to evacuate it did so during or after the formation of this interior stellar population. We note that the blue stellar density distribution presented in Weisz et al. (2008) contains a significant number of stars in both the southern H I component and in the area now covered by the giant H I hole. While the estimates of the requisite energetics are difficult in the absence of kinematic information, we nonetheless explore the connection between recent SF and this giant H I structure in more detail in Paper II.
6 Conclusions
We have presented new VLA multi-configuration H I 21 cm spectral line observations of the intriguing post-starburst dwarf irregular galaxy DDO 165. The neutral gas morphology and dynamics are quite complex for an apparently isolated low-mass system. The two major H I components appear to be kinematically distinct. The southern H I component contains the bulk of the neutral gas mass (85% or 9.4 107 M⊙) and is spatially coincident with the regions of highest stellar density and with the characteristic “cutoff” of the stellar population in the southern disk. Two column density peaks in this southern H I component are spatially coincident with the highest surface brightness H emission. The northern component also harbors dense gas and ongoing SF.
The H I morphology is dominated by a giant evacuated hole that spans 2.2 1.1 kpc. This feature is offset from the region of highest stellar density, but still contains a significant portion of the entire stellar population of the DDO 165 system. In addition to this visually obvious H I hole, we find seven other hole or shell features via PV or RV analysis. Five of these features have kinematic information (i.e., measured expansion velocities), while the other three (including the aforementioned giant H I hole) are currently static in the H I spectral line. A coarse estimate of the requisite energetics is performed using the oft-cited single-blast, kinematic age model (Chevalier, 1974); Paper II presents a more sophisticated derivation of the energetic requirements of the H I holes based on a mass model derived from infrared imaging.
A spatially resolved PV analysis shows multiple high velocity gas features along the southern H I component, spatially coincident with the truncated stellar population. These localized features span an average velocity range of 40 km s-1, with some features reaching 60 km s-1. These features are interpreted as the localized effects of stellar feedback that have created incoherent motion of the surrounding H I gas; this hypothesis is explored in detail in Paper II. This interpretation is strengthened by the results of the spatially resolved SF history analyses of DDO 165 presented in Weisz et al. (2008) and in McQuinn et al. (2010a, 2010b); the past SF was extended over hundreds of Myr, and we postulate that feedback from this SF has produced the highly disturbed H I dynamics of the system.
Using the kinematic information in our H I datacubes, we can reject certain models for the origin of the two kinematically distinct H I components. Specifically, scenarios involving turbulence, counter-rotating or superposed disks, and coherent global rotation each fail to reproduce the kinematic signatures in our data. However, we are unable to differentiate between an infall or outflow origin using the H I data alone; both mechanisms are considered further in Paper II.
DDO 165 is at an important phase of its evolution. The recent temporally and spatially extended SF event has had a significant effect on the surrounding ISM. It thus provides an opportunity to improve our understanding of galaxy evolution. To further explore the nature of SF in DDO 165, and the capabilities of that SF to shape the neutral ISM (e.g., creating high velocity gas features, holes and shells of various sizes and energetic requirements, and potentially the blowout of significant fractions of the total gas mass), we present a detailed comparison of the H I kinematics and the spatially resolved SF history in Paper II.
References
- Abazajian et al. (2009) Abazajian, K. N., et al. 2009, ApJS, 182, 543
- Begum et al. (2008) Begum, A., Chengalur, J. N., Karachentsev, I. D., Sharina, M. E., & Kaisin, S. S. 2008, MNRAS, 386, 1667
- Bigiel et al. (2010) Bigiel, F., Leroy, A., Seibert, M., Walter, F., Blitz, L., Thilker, D., & Madore, B. 2010, ApJ, 720, L31
- Briggs (1995) Briggs, D. S. 1995, Bulletin of the American Astronomical Society, 27, 1444
- Brinks & Bajaja (1986) Brinks, E., & Bajaja, E. 1986, A&A, 169, 14
- Burrows (2000) Burrows, A. 2000, Nature, 403, 727
- Calzetti et al. (2005) Calzetti, D., et al. 2005, ApJ, 633, 871
- Cannon et al. (2004) Cannon, J. M., McClure-Griffiths, N. M., Skillman, E. D., & Côté, S. 2004, ApJ, 607, 274
- Cannon et al. (2005) Cannon, J. M., et al. 2005, ApJ, 630, L37
- Cannon et al. (2010) Cannon, J. M., et al. 2010, AJ, 139, 2170
- Chevalier (1974) Chevalier, R. A. 1974, ApJ, 188, 501
- Croxall et al. (2009) Croxall, K. V., van Zee, L., Lee, H., Skillman, E. D., Lee, J. C., Côté, S., Kennicutt, R. C., & Miller, B. W. 2009, ApJ, 705, 723
- Draine et al. (2007) Draine, B. T., et al. 2007, ApJ, 663, 866
- Ferrara & Tolstoy (2000) Ferrara, A., & Tolstoy, E. 2000, MNRAS, 313, 291
- Heckman et al. (2001) Heckman, T. M., Sembach, K. R., Meurer, G. R., Strickland, D. K., Martin, C. L., Calzetti, D., & Leitherer, C. 2001, ApJ, 554, 1021
- Huchtmeier et al. (2003) Huchtmeier, W. K., Karachentsev, I. D., & Karachentseva, V. E. 2003, A&A, 401, 483
- Hunter et al. (1998) Hunter, D. A., Wilcots, E. M., van Woerden, H., Gallagher, J. S., & Kohle, S. 1998, ApJ, 495, L47
- Jorsater & van Moorsel (1995) Jorsater, S., & van Moorsel, G. A. 1995, AJ, 110, 2037
- Joung & Mac Low (2006) Joung, M. K. R., & Mac Low, M.-M. 2006, ApJ, 653, 1266
- Kamphuis et al. (1996) Kamphuis, J. J., Sijbring, D., & van Albada, T. S. 1996, A&AS, 116, 15
- Karachentsev et al. (2002) Karachentsev, I. D., et al. 2002, A&A, 383, 125
- Karachentsev et al. (2004) Karachentsev, I. D., Karachentseva, V. E., Huchtmeier, W. K., & Makarov, D. I. 2004, AJ, 127, 2031
- Kennicutt (1989) Kennicutt, R. C., Jr. 1989, ApJ, 344, 685
- Kennicutt (1998) Kennicutt, R. C., Jr. 1998, ApJ, 498, 541
- Kennicutt et al. (2003) Kennicutt, R. C., Jr., et al. 2003, PASP, 115, 928
- Kennicutt et al. (2005) Kennicutt, R. C., Jr., Lee, J. C., Funes, J. G., Sakai, S., & Akiyama, S. 2005, Starbursts: From 30 Doradus to Lyman Break Galaxies, 329, 187
- Kennicutt et al. (2007) Kennicutt, R. C., Jr., et al. 2007, ApJ, 671, 333
- Kennicutt et al. (2008) Kennicutt, R. C., Jr., Lee, J. C., Funes, S. J., José G., Sakai, S., & Akiyama, S. 2008, ApJS, 178, 247
- Kobulnicky & Skillman (2008) Kobulnicky, H. A., & Skillman, E. D. 2008, AJ, 135, 527
- Lee et al. (2007) Lee, J. C., Kennicutt, R. C., Funes, S. J., José G., Sakai, S., & Akiyama, S. 2007, ApJ, 671, L113
- Lee et al. (2009) Lee, J. C., Gil de Paz, A., Kennicutt, R. C., Bothwell, M., Dalcanton, J., Funes, J. G. S. J., Johnson, B., Sakai, S., & Akiyama, S. 2009, ApJ, 692, 1305
- Lee et al. (2010) Lee, J. C., Kennicutt, R. C., Funes, J. G. S. J., Sakai, S., Skillman, E.D., Tremonti, C., & van Zee, L. 2010, ApJ, submitted
- Mac Low & Ferrara (1999) Mac Low, M.-M., & Ferrara, A. 1999, ApJ, 513, 142
- Martin et al. (2002) Martin, C. L., Kobulnicky, H. A., & Heckman, T. M. 2002, ApJ, 574, 663
- Mateo (1998) Mateo, M. L. 1998, ARA&A, 36, 435
- McQuinn et al. (2009) McQuinn, K. B. W. et al. 2009, ApJ, 695, 561
- McQuinn et al. (2010a) McQuinn, K. B. W. et al. 2010a, ApJ, in press (ArXiV/1008.1589)
- McQuinn et al. (2010b) McQuinn, K. B. W. et al. 2010b, ApJ, in press (ArXiV/1009.2940)
- Meurer et al. (1998) Meurer, G. R., Staveley-Smith, L., & Killeen, N. E. B. 1998, MNRAS, 300, 705
- Ott et al. (2001) Ott, J., Walter, F., Brinks, E., Van Dyk, S. D., Dirsch, B., & Klein, U. 2001, AJ, 122, 3070
- Paturel et al. (2003) Paturel, G., Petit, C., Prugniel, P., Theureau, G., Rousseau, J., Brouty, M., Dubois, P., & Cambrésy, L. 2003, A&A, 412, 45
- Puche et al. (1992) Puche, D., Westpfahl, D., Brinks, E., & Roy, J.-R. 1992, AJ, 103, 1841
- Rhode et al. (1999) Rhode, K. L., Salzer, J. J., Westpfahl, D. J., & Radice, L. A. 1999, AJ, 118, 323
- Sargent et al. (1983) Sargent, W. L. W., Sancisi, R., & Lo, K. Y. 1983, ApJ, 265, 711
- Schlegel et al. (1998) Schlegel, D. J., Finkbeiner, D. P., & Davis, M. 1998, ApJ, 500, 525
- Silich et al. (1996) Silich, S. A., Franco, J., Palous, J., & Tenorio-Tagle, G. 1996, ApJ, 468, 722
- Skillman et al. (1988) Skillman, E. D., Terlevich, R., Teuben, P. J., & van Woerden, H. 1988, A&A, 198, 33
- Skillman (1996) Skillman, E. D. 1996, The Minnesota Lectures on Extragalactic Neutral Hydrogen, 106, 208
- Stewart & Walter (2000) Stewart, S. G., & Walter, F. 2000, AJ, 120, 1794
- Stil & Israel (2002a) Stil, J. M., & Israel, F. P. 2002a, A&A, 389, 42
- Stil & Israel (2002b) Stil, J. M., & Israel, F. P. 2002b, A&A, 389, 42
- Stinson et al. (2009) Stinson, G. S., Dalcanton, J. J., Quinn, T., Gogarten, S. M., Kaufmann, T., & Wadsley, J. 2009, MNRAS, 395, 1455
- Tamburro et al. (2009) Tamburro, D., Rix, H.-W., Leroy, A. K., Mac Low, M.-M., Walter, F., Kennicutt, R. C., Brinks, E., & de Blok, W. J. G. 2009, AJ, 137, 4424
- Walter & Brinks (1999) Walter, F., & Brinks, E. 1999, AJ, 118, 273
- Walter et al. (2007) Walter, F., et al. 2007, ApJ, 661, 102
- Walter et al. (2008) Walter, F., Brinks, E., de Blok, W. J. G., Bigiel, F., Kennicutt, R. C., Thornley, M. D., & Leroy, A. 2008, AJ, 136, 2563
- Weisz et al. (2008) Weisz, D. R., Skillman, E. D., Cannon, J. M., Dolphin, A. E., Kennicutt, R. C., Jr., Lee, J., & Walter, F. 2008, ApJ, 689, 160
- Weisz et al. (2009a) Weisz, D. R., Skillman, E. D., Cannon, J. M., Walter, F., Brinks, E., Ott, J., & Dolphin, A. E. 2009a, ApJ, 691, L59
- Weisz et al. (2009b) Weisz, D. R., Skillmann, E. D., Cannon, J. M., Dolphin, A. E., Kennicutt, R. C., Jr.,Lee, J., & Walter, F. 2009b, ApJ, 704, 1538
- Young et al. (2007) Young, L. M., Skillman, E. D., Weisz, D. R., & Dolphin, A. E. 2007, ApJ, 659, 331
| Property | Values |
|---|---|
| Alternate name | UGC 8201 |
| Right Ascension (J2000) | 13h 06m 24.s8 |
| Declination (J2000) | +67°42′25″ |
| Adopted distanceaaKarachentsev et al. (2002) (Mpc) | 4.47 0.20 |
| AIbbSchlegel et al. (1998) | 0.047 0.010 |
| SHI (Jy km/s)ccThis study | 23.2 2.0 |
| H I mass (108 M⊙)ccThis study | 1.1 0.3 |
| Parameter | B | C | D |
|---|---|---|---|
| Baselines | 1-53 k | 0.2-16.1 k | 0.2-4.5 k |
| Date of Observation | Nov 9, 2007 | Nov 19, 2006 | Apr 11, 2007 |
| Total time on source (min) | 390 | 172 | 85 |
| Total Bandwidth (MHz) | 1.56 | 1.56 | 1.56 |
| Number of Channels | 128 | 128 | 128 |
| Velocity Resolution (km s-1) | 2.58 | 2.58 | 2.58 |
| Number | (J2000)aaThe Right Ascension and declination at the center of the H regions. The error of these values is 1″. Units of Right Ascension are hours, minutes, and seconds, and units of declination are degrees, arcminutes, and arcseconds. | (J2000)aaThe Right Ascension and declination at the center of the H regions. The error of these values is 1″. Units of Right Ascension are hours, minutes, and seconds, and units of declination are degrees, arcminutes, and arcseconds. | Flux (erg s-1 cm-2) |
|---|---|---|---|
| 1 | 13:06:11.5 | 67:41:48.4 | 2.60E-15 |
| 2 | 13:06:17.5 | 67:42:09.0 | 3.69E-14 |
| 3 | 13:06:19.8 | 67:42:02.7 | 7.25E-15 |
| 4 | 13:06:20.8 | 67:41:43.7 | 4.35E-15 |
| 5 | 13:06:22.5 | 67:43:22.7 | 2.45E-15 |
| 6 | 13:06:23.3 | 67:41:59.0 | 7.05E-15 |
| 7 | 13:06:24.5 | 67:43:40.1 | 1.23E-14 |
| 8 | 13:06:27.2 | 67:43:20.4 | 2.15E-15 |
| 9 | 13:06:38.0 | 67:42:12.0 | 2.58E-15 |
| 10 | 13:06:41.8 | 67:42:11.6 | 7.37E-15 |
| Number | Size | Age t | Energy Ehole | TypeeeHole type as discussed in §4.1 | IdentificationffThe holes were either identified by a position velocity (PV) slice, a radius velocity (RV) slice, or a combination of the two. | |||
|---|---|---|---|---|---|---|---|---|
| (J2000)aaThe Right Ascension and declination of the center of the holes. The error of these values is 3″. Units of Right Ascension are hours, minutes, and seconds, and units of declination are degrees, arcminutes, and arcseconds. | (J2000)aaThe Right Ascension and declination of the center of the holes. The error of these values is 3″. Units of Right Ascension are hours, minutes, and seconds, and units of declination are degrees, arcminutes, and arcseconds. | (pc)bbThe diameter of the hole in pc. If the hole is elliptical then the major and minor axis diameters, and the major axis position angle (east of north), are also listed. The hole diameters listed have an error of 100 pc | (km s-1)ccExpansion velocity of the hole, when it can be measured, with an error of 2 km s-1. | (Myr)ddThe calculated ages for the holes are upper limits as we assumed the expansion velocity to be constant for the holes creation. | (1051 ergs) | |||
| 1 | 13:06:17.1 | 67:43:04.4 | 975 325, 40° | - | - | - | 1 | PV |
| 2 | 13:06:22.1 | 67:41:46.9 | 520 | 11 | 23.0 | 3.95 | 3 | PV, RV |
| 3 | 13:06:23.3 | 67:40:43.4 | 867 | 10 | 42.2 | 170.5 | 3 | PV, RV |
| 4 | 13:06:27.7 | 67:41:04.5 | 390 | - | - | - | 1 | PV |
| 5 | 13:06:30.1 | 67:41:26.5 | 737 | 7 | 51.2 | 6.23 | 3 | RV |
| 6 | 13:06:30.6 | 67:42:31.0 | 2210 1084, 130° | - | - | - | 1 | PV |
| 7 | 13:06:38.6 | 67:41:33.7 | 455 | 9 | 24.6 | 1.97 | 3 | RV |
| 8 | 13:06:45.2 | 67:42:02.1 | 433 | 7 | 30.1 | 11.9 | 3 | RV |