CNISM unità di Pisa, Italy 22institutetext: INFN Sez. di Pisa, Pisa, Italy 33institutetext: Laboratori Nazionali di Legnaro, INFN Legnaro (Padova), Italy
A ring laser gyroscope for nano-rotational motion sensing
Abstract
We present a fully active-controlled He-Ne ring laser gyroscope operating in square cavity 1.35 m in side. The apparatus is designed to provide a very low mechanical and thermal drift of the ring cavity geometry and is conceived to be operative in two different orientations of the laser plane, in order to detect rotations around the vertical or the horizontal direction. Since June 2010 the system is active inside the Virgo interferometer central area with the aim of performing high sensitivity measurements of environmental rotational noise. So far, continuous unattended operation of the gyroscope has been longer than 30 days. The main characteristics of the laser, the active remote-controlled stabilization systems and the data acquisition techniques are presented. An off-line data processing, supported by a simple model of the sensor, is shown to improve the effective long term stability. A rotational sensitivity at the level of below , very close to the required specification for the improvement of the Virgo suspension control system, is demonstrated for the configuration where the laser plane is horizontal.
1 Introduction
Laser gyroscopes (“gyrolasers”) are extremely sensitive absolute-rotation sensors based on the Sagnac effect. Two counterpropagating laser beams oscillate on the same mode of an active ring laser cavity. When the cavity rotates with respect to an inertial reference frame, the optical frequencies of the two intracavity laser beams become different. The angular velocity of the laser reference frame is related to the frequency difference between the two optical beams by the following relation:
| (1) |
where is the area enclosed by the optical path inside the cavity, the perimeter, the optical wavelength, and the area versor. To measure the frequency difference , the two beams are superimposed on a photodetector and their beat note is detected. Gyrolasers find application in different fields like navigation, geophysics and geodesy. The large frame ring laser gyroscope “G” schr09 , a monolithic square cavity 4 m in side, located by the Geodetic Observatory of Wettzell (Germany), routinely performs rotation measurements with a resolution of the order of few . “G”, together with other large gyrolasers around the world (for a detailed list of references see for example http://www.ringlaser.org.nz), provides essential information on rotational seismology rotational_seismology and its long–term monitoring of the earth rotation rate makes the direct observation of geodetic effects like the solid earth tides schr03 and the diurnal polar motion schr04 possible. The present sensitivity level is not too far from what is required for ground based General Relativity tests, which seem achievable in the near future by improved devices sted97 ; sted03 ; noilense .
In this paper we present the experimental results concerning the use of a meter size gyrolaser as very sensitive tilt sensor. Recently, this opportunity has been considered by the community of the large gravitational-waves interferometers like Virgo and Ligo with the aim of performing seismic monitoring and improving the control of the inertial suspensions. The required sensitivity for the next generation of the Virgo antenna is at the level of in the range (see: The Virgo Collaboration, 2009 Advanced Virgo Baseline Design, Virgo note VIR-027A-09 (26 May 2009)).
In the context of the experiment “G-Pisa” ncb , a square-cavity gyrolaser, in side, has been assembled and has already demonstrated a sensitivity at the level of few in the range CQG . Since June 2010, “G-Pisa” worked inside the Virgo central area, few meters apart from the beam-splitter and the two input mirrors of the 3 km Fabry-Pérot cavities, with the main purpose of performing in situ measurements of the tilt motions, which are responsible of the reduction of the antenna sensitivity during severe weather conditions. Differently from “G”schr09 , the best performing ring-laser, which is based on a monolithic design and made in Zerodur (a glass with ultra-low expansion coefficient at room temperature), our design is based on a largely more economical vacuum chamber in stainless steel geosensor1 , rigidly fixed on a slab of granite.
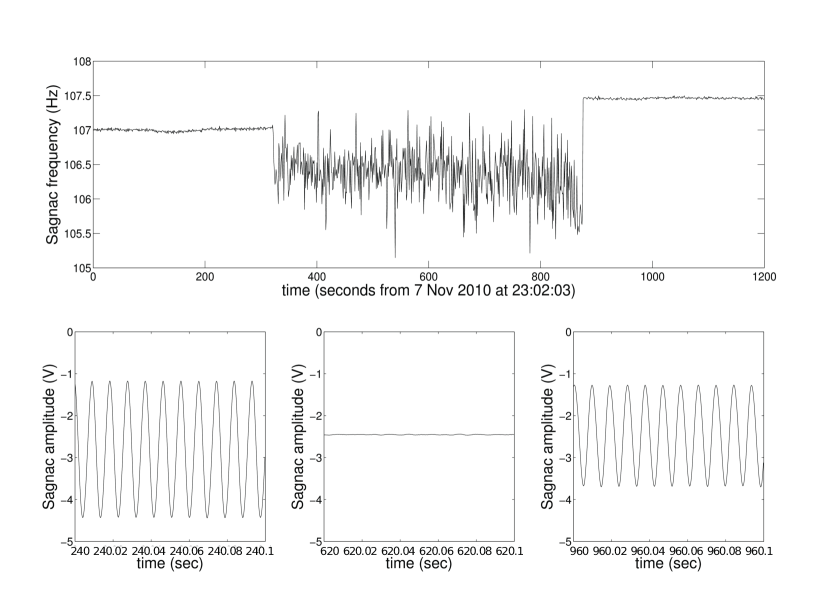
Comparing the performances of G and G-Pisa, we observed that, in the frequency range where both are shot-noise dominated, the sensitivity limit scales properly with the scale factor, the Q-factor and the laser power. However, in the very low frequency band () G-Pisa is affected by some excess noise due to considerable differences in local rotation noise (tilts) and environmental parameters stability (temperature and pressure) sted97 . Environmental temperature variations induce deformations of the laser cavity shape and therefore change the calibration coefficient (scale factor) connecting the measured Sagnac frequency to the rotation rate. In single-mode free running operations, a change in the perimeter length produces a change in the laser wavelength. When the corresponding optical frequency variation becomes comparable with the cavity free spectral range (), mode jumps may occur, bringing the laser to an unstable working regime. Moreover, mode jumps do not happen at the same time for the two counter-propagating beams; there is in general a time gap, that can be of the order of several minutes, where the two opposite beams work on two different longitudinal modes separated by one FSR (split-mode operational regime). In this regime, the Sagnac signal shifts around the FSR frequency and the information about rotation is lost 111The recovery of the rotational signal in split-mode regime can be obtained by heterodyning the beat signal with a stable oscillator at the FSR frequency. This solution is typically employed in ultra-large ring lasers ULTRA .. A typical waveform of the Sagnac interference signal during a series of split-mode transitions is sketched in Fig.1.
A control system has been implemented, in order to avoid mode jumps, by keeping the perimeter of the ring constant against the wavelength of a frequency-stabilized laser. This is obtained by moving two of the four mirrors along a diagonal by piezoelectric actuators. This stabilization system has a further advantage: since the detuning of the two lasers is absolutely fixed with respect to the atomic gain line, the frequency dependence of the non-linear atomic absorption and dispersion effects can be considered constant for the two opposite intra-cavity beams. Amplitude stabilization of the laser emission power is as well necessary to ensure stable operation, and compensate for degradation of the gas mixture or for electronic fluctuations in the discharge excitation; in our device the power of one of the two modes is stabilized.
In the following we will present a simple model of the sensor (see for example: A. Velikoseltsev, Ph.D. Thesis, Tech. Univ. Muenchen, Germany, 2005) taking into account the main systematic effects in the rotation measurement. We will describe the experimental apparatus which is now operating inside the Virgo central area, giving the details of the stabilization loops, and of the remote control system, which is necessary since most of the time the access to the Virgo central area is forbidden. Finally, the experimental data treatment and analysis will be discussed, focusing on the sensitivity to angular movements in the frequency region below 100 mHz down to 1 mHz.
2 Sensor Model
The relation expressed in Eq.(1), which connects the beat note with the angular velocity and the geometrical parameters of the ring, is only a first order approximation.
A more complete model of the ring laser gives the following expression for the measured beat frequency :
| (2) |
The first term is the scale factor, the second, , is the null-shift error and the last, , is given by backscattering effects. The coefficients of the scale factor are defined as follows: is the geometrical scale factor that links the Sagnac effect to the geometry of the laser resonance cavity. It must be corrected by the coefficient which takes into account the changes in the optical path length due to the dispersion properties of the plasma in the discharge region.
The non-reciprocity of the optical cavity is the source of the null-shift error . Non-linear effects in the plasma arising from parity non-conserving interactions ( such as the Faraday rotation combined to a slight elliptical polarization) can be kept under control by accurately shielding the discharge from stray magnetic fields. In addition, environmental factors like temperature and pressure fluctuations in the laboratory, as well as outgassing, produce different losses for the two counter-propagating beams. The null-shift contribution, under frequency stabilized operations, turns out to be proportional to the single beams intensity difference :
| (3) |
Since beam-power measurements are available for each beam, the intensity difference can be taken directly from the experimental data and the evaluation of the null shift contribution can be obtained by fitting in an off-line analysis.
The last term is produced by the backscattering of the radiation, mainly on the mirrors, that couples the circulating beams one to the other. Since the backscattering cross-section is inversely proportional to the perimeter of the ring cavity this is the dominant error contribution in the small ring laser gyros. Since the amplitude and the phase of the backscattered light affects also the laser intensity, an estimation of can be obtained by implementing a diagnostic on the two single beam outputs of a single cavity mirror. In particular, we can write brevetto :
| (4) |
where , and where the symbol indicates the average operation calculated over a time interval , containing many cycles of the Sagnac beat oscillation signal. The proportionality constant between and is then fitted to the experimental data. Details are reported in the appendix.
3 Experimental apparatus
The mechanical design of the laser gyroscope is sketched in Fig. 2. A thick and in side square granite slab supports the whole mechanical ring and defines the laser cavity reference frame.
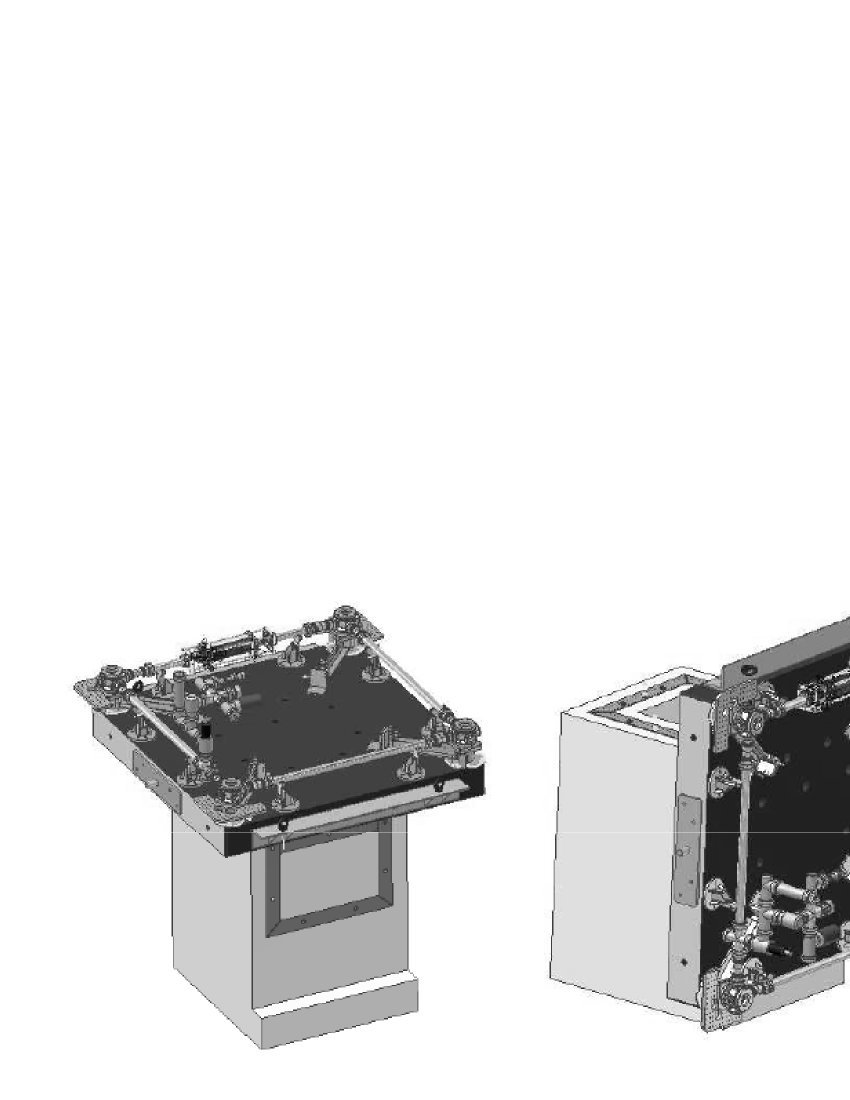
The Virgo experiment is mainly interested in the ground rotation around the horizontal axes; for this reason a steel armed reinforced concrete support has been designed and realized, which is able to support the granite table both horizontally and vertically, in order to measure the rotations around the vertical, or around the horizontal direction. A steel flange is embedded at the center both of the upper side and of the lateral side of the concrete monument, in order to firmly hold the granite table. The weight of the concrete support is , while the granite table is around . The weight of the whole structure has to guarantee a good contact with the underneath floor. In order to improve this contact as much as possible, a liquid, fast-setting, concrete has used to fill cracks and gaps between the floor and the monument basis. The optical cavity design is based on the GEOsensor geosensor project. As stated before, it is a square optical cavity, 5.40 m in perimeter and 1.82 m2 in area, enclosed in a vacuum chamber entirely filled with the active medium gas. The vacuum chamber has a stainless steel modular structure: 4 boxes, located at the corners of the square and containing the mirror holders inside, are connected by pipes through flexible bellows, in order to form a ring vacuum chamber with a total volume of about m3. The mirrors are rigidly fixed to the boxes. The mirrors alignment can be achieved thanks to a micro-metric lever system that allows to regulate the two tilt degrees of freedom of each box. A fine movement of two opposite placed boxes along the diagonal of the square is also possible. This is provided by two piezoelectric transducers that allow the servo control of the laser cavity perimeter length. No window restricts the active region and the vacuum chamber is entirely filled with a mixture of He and a isotopic mixture of 20Ne and 22Ne. The total pressure of the gas mixture is set to with a partial pressure of Neon of . The active region is a plasma which is generated by a RF capacitive discharge coupled to the gas through a pyrex capillary inserted at the middle of one side of the ring. The ring cavity mirrors have a radius of curvature of 4 m. By abruptly switching off the discharge excitation, we measured a shut-down decay time of the laser radiation of , giving an effective optical cavity quality factor , consistent with a mirror reflectivity of . The laser is working very close to threshold, in order to select only a single longitudinal mode (). The typical power of a single output beam is typically of the order of .
4 Perimeter digital control
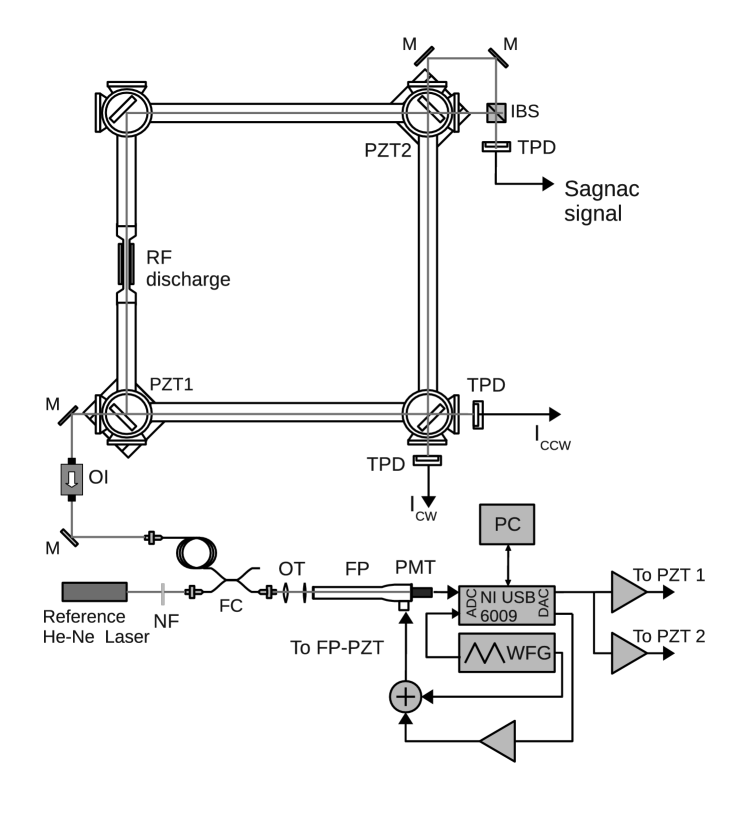
The long term perimeter control is obtained by comparing the gyrolaser optical frequency with a He-Ne reference laser which is frequency-stabilized to the Doppler broadened profile of the laser transition. The correction is applied to the ring cavity by acting on the piezoelectric devices moving the mirrors boxes. The long term stability of the reference laser is given of the order of over one year bob . The frequency separation between the two lasers is measured by means of a Fabry-Pérot spectrum analyzer biancalana and the ring laser perimeter length is corrected in order to keep this difference equal to a constant value around , which corresponds to the effective maximum of the gain curve as determined by the superposition of the Doppler broadened gain curves of and . The control scheme is sketched in Fig.3. Both the radiation emitted from the gyrolaser and the reference laser are injected into an optical fiber and superimposed in a fiber–combiner. The output of the fiber coupler is mode-matched to a scanning Fabry-Pérot analyzer (FP) with a free spectral range of , and a finesse of about 100; the transmitted intensity is detected by a photomultiplier. The FP cavity length is continuously scanned by driving the piezoelectric transducer with a triangular waveform at the frequency of . Initially, the central value of the frequency scan, set by the offset of the triangular waveform, is tuned at half way between the reference laser and the gyrolaser optical frequency.
After each scan the FP optical spectrum, containing the two resonance peaks, is processed by a PC. The positions of the two peak centers, the one of the gyrolaser and the one of the reference laser, are estimated via a parabolic fit of the data around the two transmission maxima. Once the resonances positions are estimated, a double digital PID feedback loop, acting on the gyrolaser cavity length and on the offset voltage of the FP PZT, is then implemented by means of two independent DAC channels222Both PIDs have a predominant integral behavior with an integral gain of about 1. The proportional and derivative gains have much lower values and are properly set in order to improve the loop stability.. The digital control system can be operated from remote, via a VNC connection, during the periods when the Virgo central area is not accessible.
The perimeter control implements a correction acting on the position of two opposite mirrors of the cavity. When the perimeter is locked to a fixed value, the geometry of the ring is distorted and the area accordingly changes. However, considering that we are very close to the perfect square condition (construction mechanical tolerances of about 1 mm), the relative change in the diagonal does not produce a sensitive relative change of the Sagnac frequency. Since the temperature dependence of the perimeter length was estimated as , the error in the rotation rate estimate due to the geometrical deformation of the cavity is at the level of . The offset voltage of the FP ramp is actively controlled in order to keep the position of the reference laser resonance peak, with respect to the starting value of the ramp, constant. This allows to compensate the thermal drift of the analyzer cavity length. This choice allows also to perform narrow sweeps around the two resonances in order to improve the frequency resolution and the correction-loop velocity. It is worth noting that the length of the FP analyzer does not influence the accuracy of the frequency spacing determination, because it determines a common mode shift of the resonance peaks of the two laser which have only a slight frequency difference. Using a single PZT to perform both frequency scans of the FP and correct its central value is a very practical method. This method presents however some intrinsic limitations connected to the non-linearity of the PZT response. A refined version of the method, improving the long term stability of the gyrolaser frequency would involve the use a FP cavity having two separate piezos separately dedicated to scan and to tune the DC level of the FP length, or to use a thermostatic technique Orozco .
4.1 Backscattering phase and double PZT control scheme
A first implementation of the perimeter control has been described in ncb . It was applied to the same ring structure, but with a slightly different side dimension (1.40 m). In that case, the correction was made by acting on a PZT at a single mirror.
As already observed in Rodloff and ulli_precision , this operation solves the problem of the discontinuous operation regime characterized by “split-mode” transitions, but introduces a slow modulation in the value of the Sagnac frequency that results to be proportional to the temperature drift rate of the gyrolaser structure. This can be explained by considering that moving a single mirror along the cavity diagonal changes the length of the two adjacent sides, while the two opposite side are, at first order, unchanged. Thus, temperature drifts determine an asymmetric deformation of the cavity shape in closed loop conditions. As we will discuss further, this fact strongly affects the backscattering induced Sagnac frequency pulling sted97 ; harm_anal .
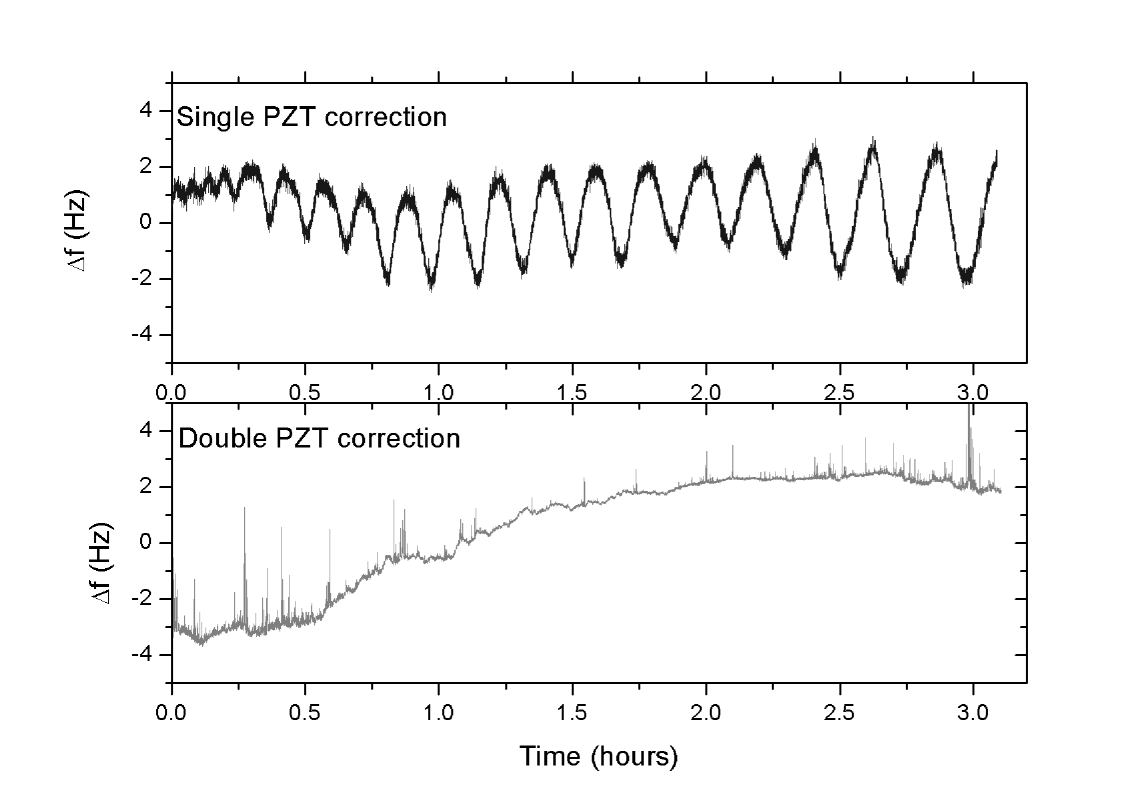
The solution we have employed is to control the cavity perimeter by using two PZTs, which change the length of one diagonal of the square, without moving its geometrical center. This technique turns out to be efficient to increase the stability of the rotational signal against temperature fluctuations. The double PZT scheme, in the case of a perfectly aligned cavity, would completely cancel the temperature coefficient of the total backscattering phase, and then of the frequency pulling, against isotropic deformations of the cavity. We characterized the performances of such a scheme on a former gyrolaser set-up having a Q-factor about 30 times lower than in the present setup. The amount of backscattering-induced frequency pulling was in that case at the level of a few Hz. A residual dependence on temperature was experimentally observed also in this configuration mainly due to cavity misalignments, anisotropic deformations of the laser frame (induced, for example, by temperature gradients) and the residual asymmetry of the two piezo elements. A comparison between the behavior of the Sagnac frequency when the perimeter is stabilized actuating one single mirror (upper graph) and when the double PZT control system is engaged (lower graph) is shown in Fig.4. In the first case the backscattering phase changes at the rate of about . In the second case the backscattering phase change rate is reduced by a factor of about 40.
5 Amplitude stabilization
The intensities of the two counterpropagating beams are influenced by several factors. An amplitude modulation at the Sagnac frequency is present, in general, superimposed on the DC level. Such modulation is produced by the interference between the photons of one beam with the backscattered photons of the other, frequency shifted, one. The long term intensity stability is, on the other side, affected by: the optical misalignments in the light path, due to thermal effects and mechanical settlings; the variation of the RF power discharge, caused by aging and self-heating of the electronic components; the variations in the composition of the gas inside the cavity (hydrogen contamination), changing the properties of the plasma and the optical gain.
As a first consideration, there are sharp upper and lower limits for the beam intensities that should not be exceeded: the upper limit corresponds to the transition to the multimode regime, while the lower limit is the laser threshold. Minor variations of the beam intensities (other than those related to the Sagnac effect) also should be avoided: they induce undesired optical gain modulation and non-linear optical dispersion effects. In order to avoid such undesired intensity fluctuations we have implemented a closed-loop stabilization system based upon a PID analog controller, the scheme of which is shown in Fig. 5.
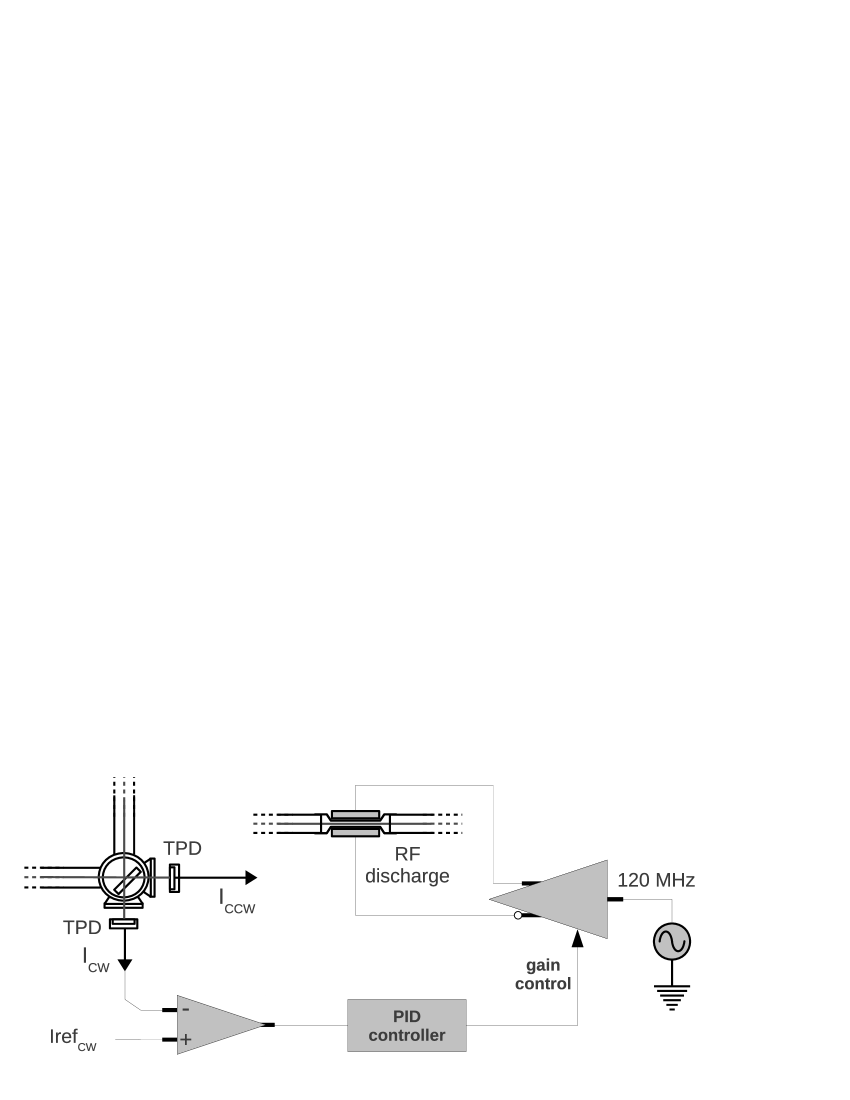
The inputs of the system are the intensity of one beam (clockwise or counter-clockwise) as revealed by the photodiode trans-impedance amplifier, and an externally imposed reference intensity value. The output voltage of the PID controller sets the power of the RF plasma excitation through a variable gain RF amplifier, thus obtaining the desired intensity of light emission and closing the loop. 333The settling time of the closed-loop system can be manually adjusted in the range 0.2-2 s, therefore the active control does not operate at the Sagnac frequency.
Figure 6 shows a plot of the CW and CCW intensities during a period of 24 hours, the beam employed in the stabilization loop is the CW one.
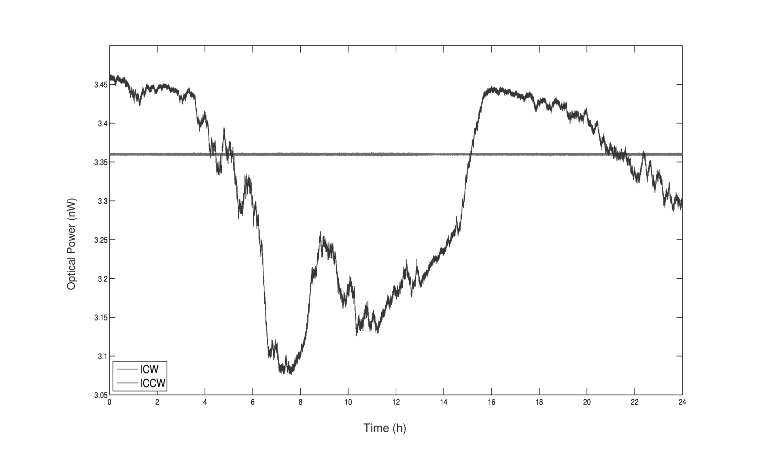
This laser amplitude stabilization reduces the long-term fluctuations, and increases the duty cycle of the apparatus, avoiding multi-mode and extinction of the laser beam. However, this kind of technique is not ideal, as demonstrated by the large fluctuation observed in the counterpropagating beam. Some different approaches could be tested, by combining the two intensity error signals in different ways and on different time-scales.
6 Data acquisition and analysis
The data from the gyrolaser are acquired and stored continuously by the Virgo data acquisition system. The Sagnac beat signal and the two single beam intensities are acquired at the rate of so that it is possible to reconstruct the Sagnac phase-noise nominally up to . In addition, a local PC provides the evaluation of the instantaneous Sagnac frequency as well as of and (see section 2) at the rate of in order to provide real time estimations of rotation rate and of the relevant parameters for the off-line correction of the systematic effects introduced by the laser dynamics. Since we are interested in the long term monitoring of local rotations, at the level of , which are superimposed on the Earth rotation-rate bias, it is fundamental to use a clock with an excellent long term stability for the data acquisition timing process. The Virgo GPS-based central timing system Virgo_Timing , developed to synchronize the Virgo interferometer’s controls and readouts, is employed.
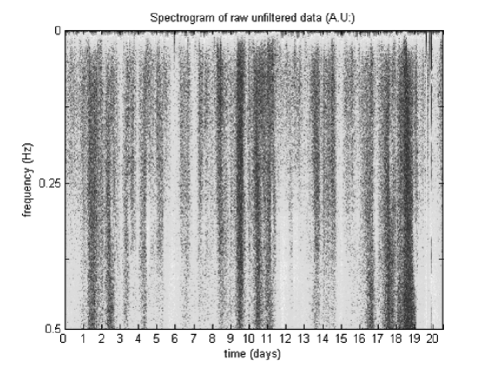
“G-Pisa” has been running unattended for several months with a vertical axis orientation. Fig.7 shows the spectrogram of the Sagnac frequency for a time period of 20 days, starting from the beginning of August 2010. The noise level is modulated by the night/day cycle, quieter at night and noisier in day time. A longer modulation of the noise level, at weekly time scale, is also observable. The average Sagnac frequency is estimated from the same dataset as . After correcting the data from the systematic effects, given by backscattering and intensity difference, the average value becomes . This value has to be compared with the expected value of calculated for a horizontally positioned gyro, located at latitude of . The measured and the expected values are consistent admitting an angular error smaller than in the alignment between the laser area vector and the local vertical direction.
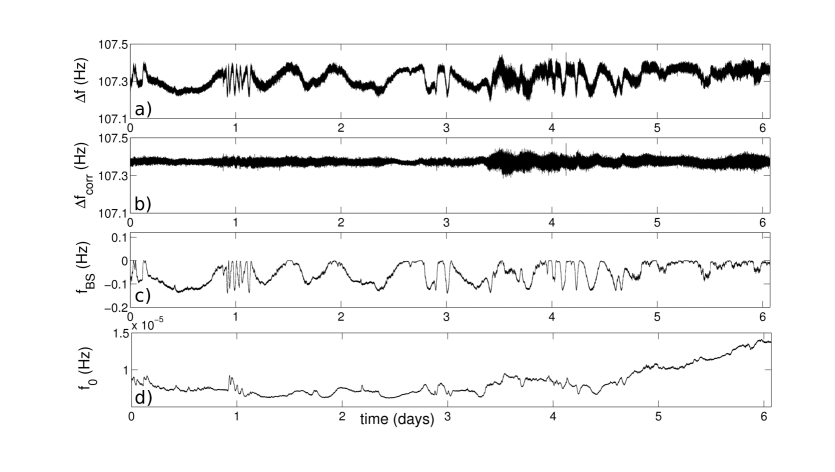
In the first run the laser power control was unstable, and affected the response of the instrument around and below . This problem has been fixed in the middle of November, and the following analysis refers to the period between the 17th of November and the 17th of December, when the system was shut-down in order to change the orientation of the ring and to be sensitive to the tilt along the horizontal axis. To improve the low frequency sensitivity we have done the attempt to subtract the noise coming from and . Fig. 8 shows the time series relative to the Sagnac frequency, the backscattering contribution and the relative power difference of the two counterpropagating modes.
7 Sensitivity estimation
The rotation-rate sensitivity limit of the actively stabilized gyroscope, with and without the subtraction of the backscattering and the power difference effects, is shown in Fig. 9.
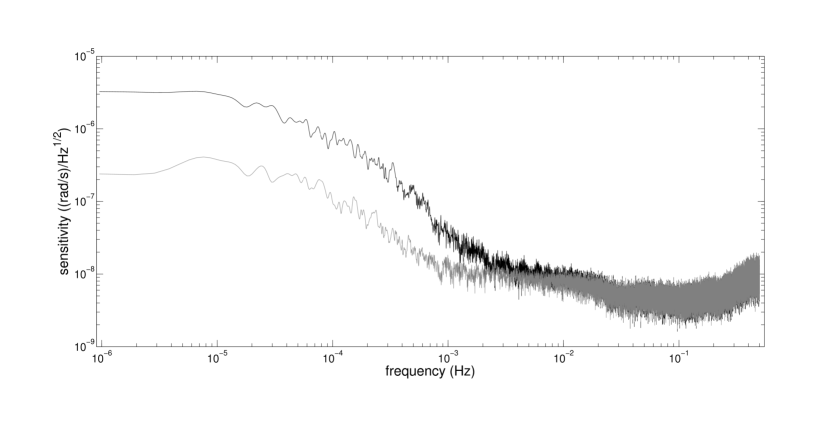
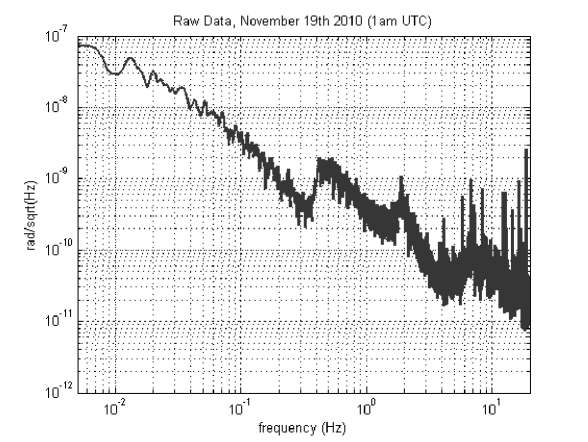
The off-line correction of the systematic effects becomes effective below the frequency of , and provides a gain in sensitivity of about one order of magnitude around . A tilt sensitivity curve, expressed as referred to a time period of very low environmental noise level, is presented in Fig. 10.
8 Conclusions
In this paper we characterized a meter-size gyrolaser dedicated to the monitoring of the rotational noise of the Virgo interferometer. The system is completely active-controlled, in frequency and power. The control system makes it possible to avoid mode jumps and multimode regimes for months and consequently to operate the laser without accessing the Virgo area over the interferometer data taking periods.
A new configuration of the perimeter control, moving two opposite cavity mirrors symmetrically along the cavity diagonal, was developed. With this new scheme we demonstrated a strong reduction of the backscatter contribution with respect to the configuration where a single movable mirror is used. This leads to an effective increase of the stability of the rotational signal against the environmental temperature fluctuations. It is worth noting that the use of two PZTs moving different mirrors provides the opportunity to act on two degrees of freedom: the total backscattering phase and the cavity perimeter.
A data acquisition system, integrated into the Virgo scheme, has been developed. A continuous sampling of the Sagnac interference signal and of the two single-beam intensities at the sampling frequency of , allows for a very accurate estimation of the systematic effects. Off-line refinement of the rotational signal, performed by subtracting the systematic frequency shifts given by backscattering () and non reciprocities () is shown to produce an improvement in the low frequency sensitivity of the instrument, of about one order of magnitude below 1 mHz.
The final measured sensitivity limit to the tilts around the vertical axis, expressed as , around is at the level of , which is close to what is required for AdVirgo.
9 Appendix
We report here a derivation of the quantity used to estimate the backscattering-induced frequency pulling of the Sagnac interference signal. The equations for the intensities and and the phase difference of the clockwise (+) and the counterclockwise (-) laser beams are written as sted97 :
where: is the free-spectral-range of the laser cavity, is the difference between the resonant frequencies for the two counterpropagating beams, , , , , are the coefficients that describe the active medium dynamics. They are functions of the Neon isotopic ratio, the optical frequencies of each of the traveling waves and the total gas pressure. The coupling terms are due to the cross saturation of the laser transition and to the backscattering. is the mutual gain coupling, is the mutual dispersion coupling and is the backscattering coupling of each of the beams into the other with phase angles . is the net backscattering phase. In the case where , , , , the equation for the Sagnac phase becomes:
| (5) |
The above equation, for has the following analytical solution:
| (6) |
where:
| (7) |
is the pulled Sagnac frequency by backscattering effects, being the lock-in frequency. Under the same approximations it is useful to consider the observable :
where is a nearly constant contribution coming from the atomic absorption/dispersion effects. Remembering that is varying at the Sagnac frequency, it is possible to evaluate the contribution from the backscattering induced pulling by estimating the amplitude of the modulation at the Sagnac frequency on brevetto . We consider then the following estimator:
| (9) |
where the symbol indicates the average operation calculated over a time interval . The above quantity turns out to be proportional to the square of the lock-in threshold . Thus the error in the Sagnac frequency estimation due to the coupling between the two counterpropagating beams is obtained, to the first order in , as:
| (10) |
The quantity is fitted once for each given measurement run of several days.
10 Acknowledgements
We thank U. Schreiber and A. Velikoseltsev for the very useful discussions. The installation inside the Virgo central building has been possible only thanks to the strong support from the EGO and Virgo team. We would like to acknowledge M. Bazzi, A. Bozzi, S. Braccini, E. Calloni, F. Carbognani, V. Dattilo, G. Di Biase, F. Frasconi, A. Pasqualetti. We acknowledge G. Balestri, G. Petragnani and A. Soldani from the INFN, section of Pisa. We acknowledge M. Francesconi, F. Francesconi, S. Gennai, M. Marinari, and R. Passaquieti, from the Physics Department of Pisa.
References
- (1) K.U. Schreiber, T. Klügel, A. Velikoseltsev, W. SchlÃŒter, G.E. Stedman, J.-P.R. Wells: Pure Appl. Geophys. 166, 1485 (2009)
- (2) K. U. Schreiber, J. N. Hautmann, A. Velikoseltsev, J. Wassermann, H. Igel, J. Otero, F. Vernon, J.-P. R. Wells: Bull. Seism. Soc. Am. 99 2B, 1190 (2009)
- (3) K. U. Schreiber, T. Klügel, G. E. Stedman: J. Geophys. Res. 108 (2003)
- (4) K. U. Schreiber, A. Velikoseltsev, M. Rothacher. T. Klügel, G. E. Stedman, D. Wiltshire: J. Geophys. Res. 109 (2004)
- (5) G. E. Stedman: Rep. Prog. Phys. 60-6, 615 (1997)
- (6) G.E. Stedman, K.U. Schreiber, H.R. Bilger: Class. Quant. Grav. 20 (2003)
- (7) A. Di Virgilio, K. U. Schreiber, A. Gebauer, J-P. R. Wells, A. Tartaglia, J. Belfi, N. Beverini, A.Ortolan: gr-qc, DOI 10.1142/S0218271810018360 (2010)
- (8) J. Belfi, N. Beverini, F. Bosi, G. Carelli, A. di Virgilio, E. Maccioni, M. Pizzocaro, F. Sorrentino, F. Stefani: Nuovo Cimento B 125, 557 (2010)
- (9) A. Di Virgilio, M. Allegrini, J. Belfi, N. Beverini, F. Bosi, G. Carelli, E. Maccioni, M. Pizzocaro, A. Porzio, U. Schreiber, S. Solimeno, F. Sorrentino: Class. Quant. Grav. 27-8 (2010)
- (10) K.U. Schreiber, A. Velikoseltsev, H. Igel, A. Cochard, A. Flaws, W. Drewitz, F. Muller: GEO-TECHNOLOGIEN Science Report, 12–13, (2003)
- (11) R. B. Hurst, G. E. Stedman, K. U. Schreiber, R. J. Thirkettle, R. D. Graham, N. Rabeendran, J.-P. R. Wells: J. Appl. Phys. 105, 113115 (2009)
- (12) F. Aronowitz, R. J. Collins: J. Appl. Phys. 41 (1970)
- (13) U. Schreiber , H. Igel , A. Cochard , A. Velikoseltsev, A. Flaws, B. Schuberth, W. Drewitz, F. Mueller: Observation of the Earth System from Space (Springer, Berlin, Heidelberg 2006)
- (14) T. M. Niebauer, J. E. Faller, H. M. Godwin, J. L. Hall, R. L. Barger: Appl. Opt. 27, 1285 (1988)
- (15) A. Rossi, V. Biancalana, B. Mai, L. Tomassetti: Rev. Sc. Instr. 73-7, 2544 (2002)
- (16) W. Z. Zhao, J. E. Simsarian, L. A. Orozco, and G. D. Sprousea: Rev. Sc. Instr. 69, 3737, (1998)
- (17) R. Rodloff: IEEE J. Quantum Electron. 23-4, 438 (1987)
- (18) U. K. Schreiber, C. H. Rowe, D. N. Wright, S. J. Cooper, G. E. Stedman: Appl. Opt. 37-36, 8371 (1998)
- (19) G. E. Stedman, Z. Li, C. H. Rowe, A. D. McGregor: Phys. Rev. A 51-6, 4944 (1995)
- (20) F.Acernese, P.Amico, M.Alshourbagy, F. Antonucci, S. Aoudia, P. Astone, S. Avino, D. Babusci, G. Ballardin, F. Barone, L. Barsotti, M. Barsuglia, Th. S. Bauer, F. Beauville, S. Bigotta, S. Birindelli, M. A. Bizouard, C. Boccara, F. Bondu, L. Bosi, C. Bradaschia, S. Braccini, F. J. van den Brand, A. Brillet, V. Brisson, D. Buskulic, E. Calloni, E. Campagna, F. Carbognani, F. Cavalier, R. Cavalieri, G. Cella, E. Cesarini, E. Chassande-Mottin, N. Christensen, C. Corda, A. Corsi, F. Cottone, A. C. Clapson, F. Cleva, J. P. Coulon, E. Cuoco, A. Dari, V. Dattilo, M. Davier, M. del Prete, R. De Rosa, L. Di Fiore, A. Di Virgilio, B. Dujardin, A. Eleuteri, M. Evans, I. Ferrante, F. Fidecaro, I. Fiori, R. Flaminio, J. D. Fournier, S. Frasca, F. Frasconi, L. Gammaitoni, F. Garufi, E. Genin, A. Gennai, A. Giazotto, G. Giordano, L. Giordano, R. Gouaty, D. Grosjean, G. Guidi, S. Hamdani, S. Hebri, H. Heitmann, P. Hello, D. Huet, S. Karkar, S. Kreckelbergh, P. La Penna, M. Laval, N. Leroy, N. Letendre, B. Lopez, Lorenzini, V. Loriette, G. Losurdo, J. M. Mackowski, E. Majorana, C. N. Man, M. Mantovani, F. Marchesoni, F. Marion, J. Marque, F. Martelli, A. Masserot, M. Mazzoni, L. Milano, F. Menzinger, C. Moins, J. Moreau, N. Morgado, B. Mours, F. Nocera, C. Palomba, F. Paoletti, S. Pardi, A. Pasqualetti, R. Passaquieti, D. Passuello, F. Piergiovanni, L. Pinard, R. Poggiani, M. Punturo, P. Puppo, S. van der Putten, K. Qipiani, P. Rapagnani, V. Reita, A. Remillieux, F. Ricci, I. Ricciardi, P. Ruggi, G. Russo, S. Solimeno, A. Spallicci, M. Tarallo, M. Tonelli, A. Toncelli, E. Tournefier, F. Travasso, C. Tremola, G. Vajente, D. Verkindt, F. Vetrano, A. Viceré, J. Y. Vinet, H. Vocca, M. Yvert: Class. Quantum Grav. 24-19 (2007)