Proton interactions with high multiplicity
Abstract
Project Thermalization (Experiment SERP-E-190 at IHEP) is aimed to study the proton - proton interactions at 50 GeV with large number of secondary particles. In this report the experimentally measured topological cross sections are presented taking into account the detector response and procession efficiency. These data are in good agreement with gluon dominance model. The comparison with other models is also made and shows no essential discrepancies.
† deceased
I Introduction
The study of high multiplicity processes is closely connected with understanding of the nature of strong interactions. The project Thermalization (experiment SERP-E-90 at IHEP) Avdeichikov is aimed to study of events with multiplicity significantly exceeding the average one. We carry out the detection of these unique events at U-70 accelerator (IHEP, Protvino) in 50 GeV proton beam. The main aim of the project is to study the collective behavior of secondary particles in the extreme multiplicity region.
In seventies Mirabelle bubble chamber Collaboration had measured the multiplicity up to 16 charged particles in pp interactions at 50 GeV 6 . SVD Collaboration continues the search for the events with multiplicity more than 20 both charged and neutral particles. To reach the goal, we have renewed SVD-2 setup (Fig. 1) at U-70 accelerator of IHEP (Protvino). Now it is equipped with a liquid hydrogen target Golov micro-strip silicon detector, a magnetic spectrometer with proportional chambers MS , a drift tube tracker Basil , Cherenkov counter, electromagnetic calorimeter for registration of gammas Kir .
To suppress registration of the events with low charged multiplicity, we have implemented the special scintillation hodoscope for triggering Trig ; NPCS . Using this setup we have extended the charged particle multiplicity measurements from 16 (Mirabelle data) to 24 particles at present. The achieved value of the smallest topological cross section is less by three orders of magnitude in comparison with the Mirabelle results. Measured charged particle multiplicity distribution has been corrected for apparatus acceptance and detection efficiency and compared with some models predictions.
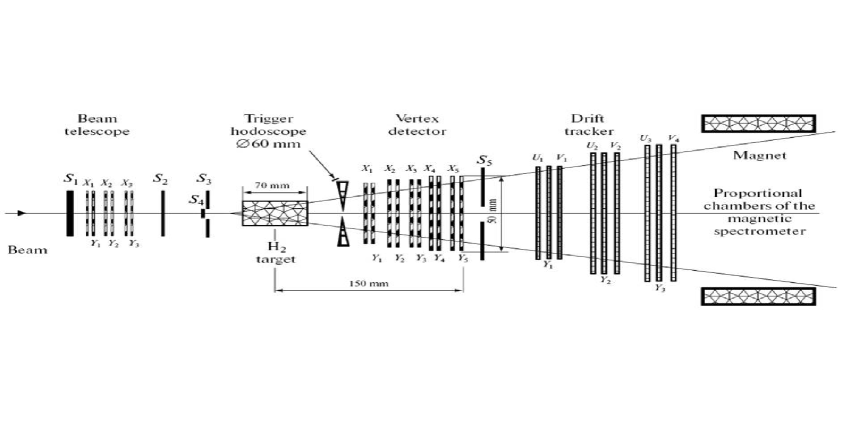
Schematic diagram of the SVD-2 setup.
The collective behavior of secondary particles is expected to onset in the extreme multiplicity region. In particular, it may evidence for the Bose-Einstein condensation which has been predicted in this area. The calculation by the MC PYTHIA code has shown that the standard generator predicts the values of the topological cross section at 70 GeV (the energy of U-70) which is in a reasonably good agreement with the experimental data at small multiplicity () but it underestimates the value by two orders of magnitude at Avdeichikov .
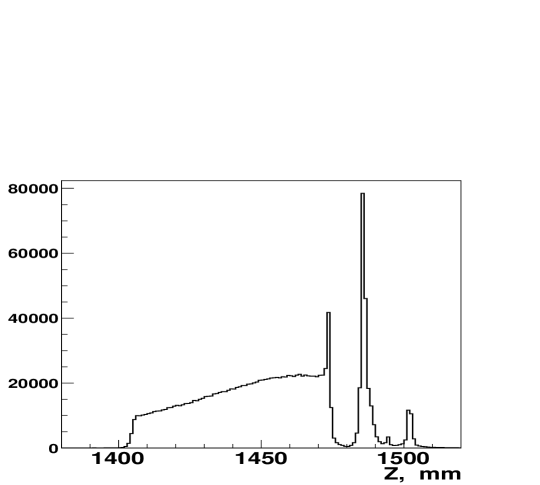
The distribution on Z -coordinate of the interaction vertex in the hydrogen target.
II Event selection, Track Fitting and Correction Procedure
The main element of SVD-2 setup is a micro-strip silicon vertex detector with 10 planes. It allows the reconstruction of the interaction vertex and tracks. We have obtained the multiplicity distribution for this report using vertex detector data only. The 5.13 millions of events were taken during 2008 year run of SVD setup. From this statistics 3.85 millions of events have been taken at trigger-level 8 (lower limit of the multiplicity set at trigger system). Out of them 2.1 millions of events have been detected in the fiducial volume of the hydrogen target. For final analysis 1.0 millions of events were remained. They were selected according to the criterions:
a) the number of beam tracks simultaneously hitting the target is not exceed 2;
b) the uncertainty of the vertex reconstruction on two projections is smaller than 5 mm.
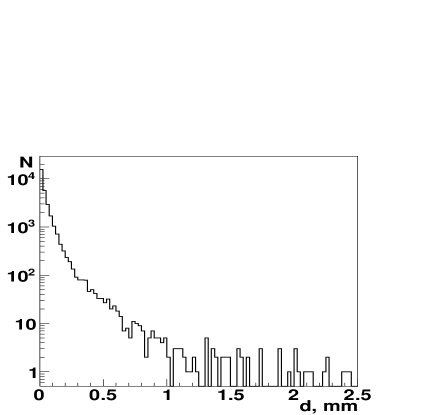
The distribution of simulated tracks on impact.
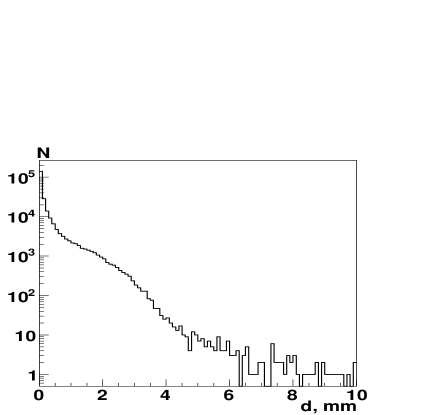
The distribution of the experimental tracks on impact.
The distribution on reconstructed X -coordinate for the interaction vertex in the hydrogen target is obtained. X -coordinate axis, as Y -coordinate axis, are directed to perpendicular of beam direction. The distribution on Y -coordinate is differed from X -coordinate distribution insignificantly. The distribution on Z -coordinate of the vertex interaction in the hydrogen target is presented in Fig. 2. Z -coordinate axis is directed to the proton beam. The interval 1405 - 1470 (mm) corresponds to interactions in the hydrogen target. Peaks on the right side appear from interactions in film window, shell of the target and scintillation hodoscope.
The reconstruction algorithm was taken as following. The space points of the hits are reconstructed accounting on one- and multi-strip clusters. The center of gravity method was applied for coordinate evaluation: where is a strip coordinate and — a strip signal amplitude. A track has been approximated by a straight line using separately the X and Y coordinates with 3 or 4 hits. For track reconstruction the Kalman filter has been applied. It effectively rejects the random noise on strip planes. The length of the target is 70 mm. The initial approximate location of primary vertex is assigned in a half of the target closest to the vertex detector. This is done to minimize apparatus acceptance correction. At least the presence of the one hit is required on the first two micro-strip planes after a target. Among a few tracks candidates the candidate with the best least chi-square fit is selected. If one candidate with four hits has worse chi-square value than candidates with three hits then the candidates with four hits is taken. In our method two tracks can pass through common (one or two) hits.
Multiple scattering in vertex detector causes the track deviation from straight line. In our case this deviation in position of last plane does not exceed the coordinate precision measurements. The vertex of interaction is determined by the least-squares method. The tracks with high deviation from vertex are not included in the event. The simulation is shows that the vertex interaction reconstruction precision amounts 30 mcm on X and Y axes, 400 mcm on Z axis without taking into alignment uncertainty. The experimental values of impact for the vertex position measurement are equal to 0.28 mm on X and 0.36 mm on Y coordinates. The absent of correct alignment procedure makes worse the coordinate precision determination greater than 3 times.
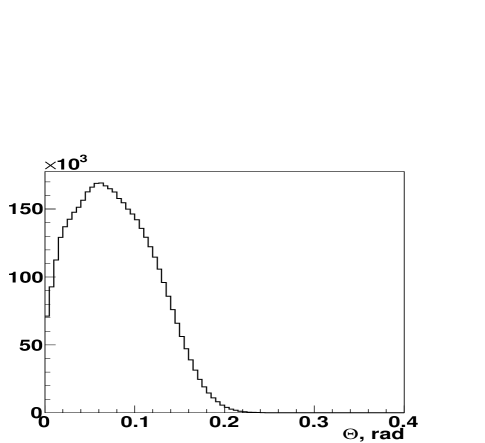
The angular distribution of reconstructed tracks on the polar angle on experimental data.
The simulation shows that the number of tracks deviated from the vertex more then 1 mm amounts 0.1% (Fig. 3). In our experiment the number of such tracks is equal to 9% (Fig. 4). These tracks come from secondary vertex or are fakes. Their sources are noise, misalignment and secondary interactions. Tracks in the space are reconstructed by means of two oblique planes and located at the end of vertex detector. The angular distribution of reconstructed tracks from the initial vertex on the polar angle for all multiplicities is presented in Fig. 5.
The correction procedure of charged multiplicity distributions is carried out taking into account an influence of the multiplicity trigger conditions and inefficiency of track reconstruction algorithm and acceptance of vertex detector. To make these corrections we used tables of spread coefficients on multiplicity, where is the probability to reconstruct successfully charged tracks for event with charged tracks, — the number of simulated events with charged tracks, from which events were reconstructed as events with charged tracks. The index is changed from 1 up to 24, the index takes only even values from 2 up to 24. The table of coefficients is calculated using Monte Carlo simulation (GEANT3). This procedure is used to calculate the acceptance of the apparatus along with the reconstruction and triggering efficiencies.
We get the overdetermined system of linear equations, in general
case 24 equations with 12 unknown quantities : where is the
experimental number of events with multiplicity . This system can
be solved by the ordinary Gauss-Seidel method or by the
least-squares method Zaidel . It is difficult to account for
the trigger inefficiency below it threshold (8 minimum ionizing
particles, MIP) so we publish here corrected topological cross
section for where trigger efficiency is close to 1
and its influence is insignificant. For low multiplicity () we use MIRABELLE data for absolute normalization of our
cross section. The event simulation for high multiplicity is carried
out in accordance with Boltzmann and Bose models and taking into
account the acceptance and the efficiency of the vertex detector
Avdeichikov . The differences in coefficients
obtained for these two models were used to estimate the systematical
errors of the correction coefficients. In the Table 1 we give
topological cross section obtained by Mirabelle Collaboration
6 . The corrected topological cross sections for pp
interactions at 50 GeV with statistical errors (the negligible
systematical errors are not included) are presented in the Table 2.
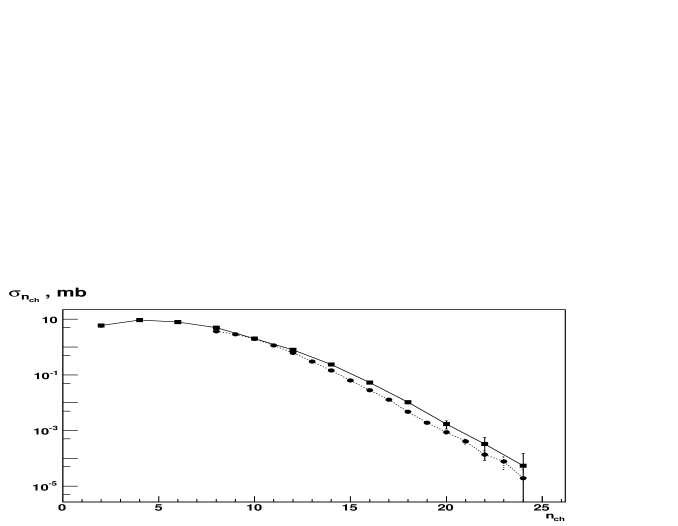
Experimental topological cross sections for pp interactions with Mirabelle data 6 addition before (filled circles)) and after (filled boxes) the inclusion of corrections. Only statistical errors are plotted.
Table. 1. The topological cross sections at 50 GeV in pp interactions obtained by Mirabelle Collaboration 6 .
| 2 | 4 | 6 | 8 | 10 | 12 | 14 | 16 | |
|---|---|---|---|---|---|---|---|---|
| 5.97 | 9.40 | 7.99 | 5.02 | 2.03 | 0.48 | 0.20 | 0.01 | |
| 0.88 | 0.47 | 0.43 | 0.33 | 0.20 | 0.10 | 0.06 | 0.02 |
Table. 2. The topological cross sections obtained by SVD Collaboration in pp interactions at 50 GeV.
| 10 | 12 | 14 | 16 | 18 | 20 | 22 | 24 | |
|---|---|---|---|---|---|---|---|---|
| 1.685 | 0.789 | 0.234 | 0.0526 | 0.0104 | 0.0017 | 0.00033 | 0.000054 | |
| 0.017 | 0.012 | 0.006 | 0.0031 | 0.0014 | 0.0006 | 0.00024 | 0.000098 |
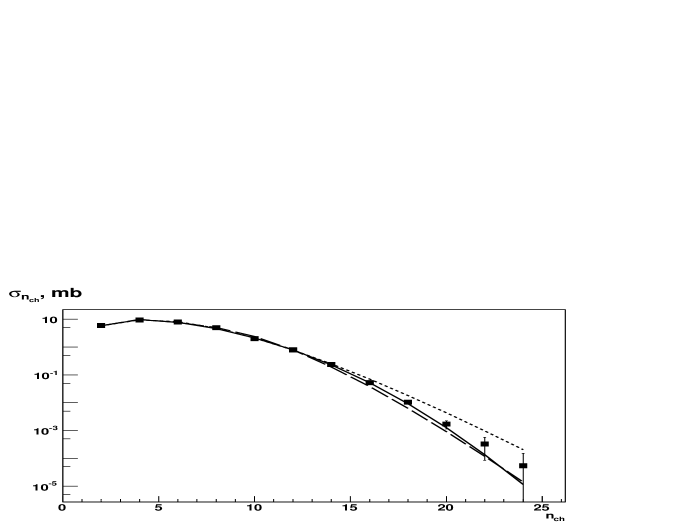
Comparisons data with GDM (solid curve), IHEP model (dotted curve) and NBD distribution (dashed curve).
We have renovated previous Mirabelle data 6 for from 10 up 16, and added 4 new points from 18 up to 24. The cross section at the last point, , is three order of magnitude lower than previously known cross section at 6 . We normalized our data to Mirabelle one 6 in the region =10–16. This allows us to get inelastic cross section, (mb) at 50 GeV and the mean charged multiplicity, . We also calculated the variance, and second correlative moment, = 1.75. Available uncorrected experimental data at proton energy 50 GeV are shown in Fig. 6 (filled circles). Corrected data on detector response are shown in Fig. 6 too (filled boxes).
III Comparisons with models
The comparison of topological cross sections with three models is carried out (Fig. 7). Statistical errors are plotted (the negligible systematical errors are not shown).
Now there are only few phenomenological models giving predictions on the multiplicity distributions at the extreme domain chikilev ; GDM ; Tyur ; Giov . One of them is why the gluon dominance model (GDM) GDM has been developed. It is based on the main essences of QCD and supplemented with the phenomenological mechanism of hadronization. This approach shows the activity of gluons and the passive role of the quarks in the multiparticle production mechanism. GDM confirms convincingly the recombination mechanism of hadronization in hadron and nuclear interactions and fragmentation in lepton processes. In Fig. 7 the description by GDM is presented by solid curve. The essence of the GDM is the convolution of the multiplicity distributions on two stages: the parton (gluon) cascade and hadronization described by phenomenological scheme. The active gluons play dominant role in multiparticle production of hadrons GDM .
An analytical expression for multiplicity distribution in the KNO-form was obtained by a theoretical group from IHEP Tyur at seventies. This model has combined the inelastic and elastic processes at high energies using spectral densities of inelastic channel contributions into unitarity condition obtained at stochastic description of collisions at high energy. It permits to get multiplicity distributions which gives good agreement to experimental data. Comparison of this function with our data is presented in Fig. 7 by the dotted curve. Evidently the agreement with the data is good.
The negative binomial distribution (NBD) Giov is the commonly utilized formula for multiplicity distributions. This distribution is obtained in clan structure of interactions and is manifested in two stage dynamical process of multiparticle production. At first stage the germs (parents) are formed and then cascades are produced.The comparison of this model with data is shown in Fig. 7 by the dashed curve. It does not describe well the data in the high multiplicity region (it exceeds our data).
These investigations have been partially supported by Russian Foundation of Basic Research nos. , ,09-02-00445a, 06-02-16954, president of Russia grant for leading scientific school support 1456.2008.2. We appreciate to IHEP leadership for support in the carrying out of investigations,thank Operations Group and department of beams provided effective work of U-70 and 22 channel.
References
- (1) V. V. Avdeichikov et al., Proposal “Termalization” (in Russian), JINR-P1-2004-190 (2005).
- (2) V. V. Ammosov et al., Phys. Lett. B 42, 519 (1972);
- (3) Yu.T. Borzunov, L.B. Golovanov, V.I. Kireev, A.V. Pleskach, V.G. Chumakov. Preprint IHEP 2009-4, OEF,, http://web.ihep.su/library/prep2009/ps/2009-4.pdf.
- (4) G.A.Bogdanova et al. Preprint SINP 97-8.459,1997.
- (5) S.G. Basiladze et al. PTE,2008.N3,14.
- (6) A.A. Kiriakov et al. Instruments and Experimental Techniques , N5, 48 (2004).
- (7) A. Avdeichikov et al., Instruments and Experimental Techniques , N2, 15 (2011).
- (8) A. Aleev et al. (SVD-2 Collab.), in Proc. of the Intern. Conf.-School on Foundations and Advances in Nonlinear Science, Minsk, Belarus, 2006, p.1.
- (9) http://en.wikipedia.org/wiki/Gauss-Seidel_method
- (10) O. G. Chikilev and P. V. Chliapnikov, Phys. Atom. Nucl. 55, 820 (1992).
- (11) E. Kokoulina, Acta Phys.Polon. B 35, 295 (2004); E. S. Kokoulina and V. A. Nikitin, in Proceedings of Baldin Seminar on HEP Problems “Relativistic Nuclear Physics and Quantum Chromodynamics”, JINR, Dubna, Russia. p. 319 (2005); P. F. Ermolov et al., in Proc. of Baldin Seminar on HEP Problems “Relativistic Nuclear Physics and Quantum Chromodynamics”, JINR, Dubna, Russia. p. 327 (2005).
- (12) S. V. Semenov, S. M. Troshin, N. E. Tyurin, O. A. Khrustalev, Yad. Fiz. 22, 792 (1975).
- (13) A. Giovannini and R. Ugocioni, Int. J. Mod. Phys. A20, 3897 (2005).