Extended Phonon Collapse and the Origin of the Charge-Density-Wave in NbSe2
Abstract
We report inelastic x-ray scattering measurements of the temperature dependence of phonon dispersion in the prototypical charge-density-wave (CDW) compound NbSe2. Surprisingly, acoustic phonons soften to zero frequency and become overdamped over an extended region around the CDW wavevector. This extended phonon collapse is dramatically different from the sharp cusp in the phonon dispersion expected from Fermi surface nesting. Instead, our experiments combined with ab initio calculations, show that it is the wavevector dependence of the electron-phonon coupling that drives the CDW formation in NbSe2 and determines its periodicity. This mechanism explains the so far enigmatic behavior of CDW in NbSe2 and may provide a new approach to other strongly correlated systems where electron-phonon coupling is important.
pacs:
74.72.-h, 63.20.dd, 71.45.Lr, 71.30.+hThe origin of CDW order is a long-standing problem relevant to a number of important issues in condensed matter physics, such as the role of stripes in cuprate superconductivityKivelson03 and charge fluctuations in the colossal magnetoresistive manganitesDagotto05 . Static CDW order, i.e., a periodic modulation of the electronic density, reflects an enhancement of the dielectric response of the conduction electrons at the CDW wavevector, , but it has long been known that it is only stabilized by a coupling to the crystal latticeGruener88 ; Chan73 . Transitions into the CDW phase on lowering the temperature are accompanied by a softening of an acoustic phonon at to zero frequency at where it freezes into a static distortionHoesch09a and evolves into the new periodic (often incommensurate) superstructure. Chan and Heine derived the criterion for a stable CDW phase with a modulation wavevector asChan73
| (1) |
where is the electron-phonon coupling associated with a mode at a frequency of , is the dielectric response of the conduction electrons, and and are their Coulomb and exchange interactions. Although both sides of this inequality are essential in stabilizing the CDW order, the common assumption is that the modulation wavevector, , is determined by the right-hand side, i.e., by a singularity in the electronic dielectric function at , where is the Fermi wavevector. In the case of NbSe2, it was proposed that such a singularity resulted either from direct Fermi surface nesting at Gruener88 ; Wilson77 or from the presence of saddle points near the Fermi surface connected by Rice75 . However, this has been challenged by a recent density-functional-theory (DFT) calculation that correctly predicted a CDW instability, but without singularities in Johannes06 ; Calandra09 . Furthermore, several angle-resolved photoemission spectroscopy (ARPES) experiments have found no clear evidence of an energy gap at the nesting wavevectors opening at Shen08 ; Borisenko09 ; Rossnagel01 . As a consequence, the elegant and intellectually compelling picture of CDW formation driven by Fermi surface nesting has been called into questionJohannes06 . The alternative possibility is that the CDW transition in NbSe2 may instead be driven by the left-hand side of equation 1, i.e., the wavevector dependence of the electron-phonon coupling . A direct test of this conjecture by phonon spectroscopy is the subject of this letter.
We have investigated discrepancies with the Fermi surface-nesting scenario by measuring the energies and linewidths of phonon excitations in NbSe2 as a function of temperature, comparing both to ab initio calculations. In particular the phonon linewidth, which is proportional to the product of the electron-phonon coupling and the electronic joint density-of-states (JDOS), which in turn is related to , provides detailed information related to the Fermi surface. Our results demonstrate that the soft phonon physics in NbSe2 does indeed deviate strongly from the conventional picture based on nestingGruener88 ; Hoesch09a and that the electron-phonon coupling is primarily responsible for determining the wave vector of CDW order.
Earlier inelastic neutron scattering investigations of the phonon dispersion in NbSe2 were limited by weak scattering intensity due to the small sample size and by relatively poor wavevector resolutionMoncton75 ; Ayache92 . To overcome these constraints, we utilized high-resolution inelastic X-ray scattering (IXS), which allowed us to obtain measurements of the entire dispersion of the soft mode branch in a wide temperature range. We used a high-quality single crystal sample of about () with a of determined from the temperature dependence of the superlattice reflections (Figure 1) in agreement with previous resultsMoncton75 . All IXS experiments were carried out on the XOR 30-ID HERIX beamline at the Advanced Photon Source, Argonne National Laboratory. Data were fitted with damped harmonic oscillator functions convoluted with the experimental resolution. For more details on the instrumental setup and data analysis see the supplementary material. Here, we focus on the longitudinal acoustic phonon branch dispersing in the crystallographic direction and crossing the CDW wave vector Moncton75 .
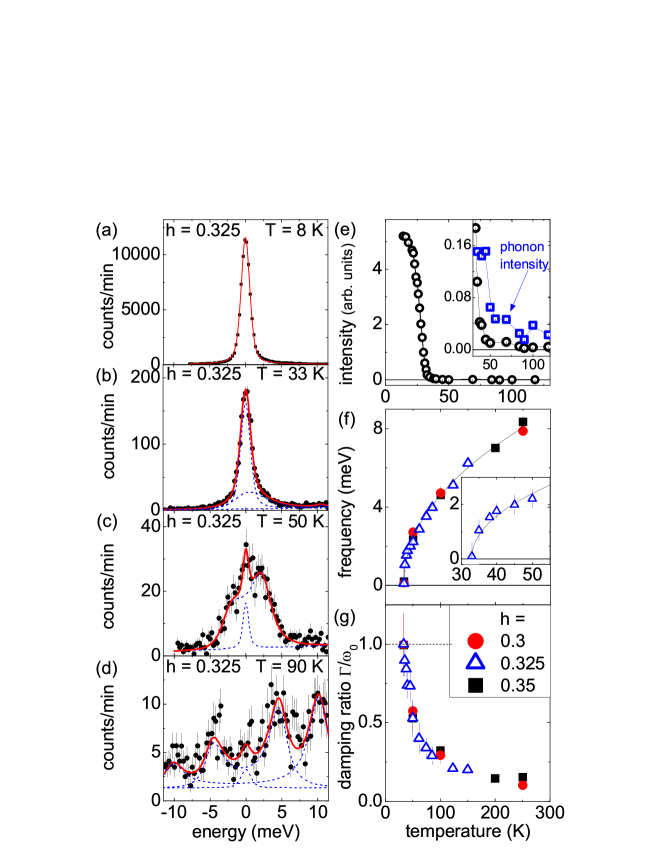
Figure 1 shows the temperature dependence of a soft phonon mode at , close to the CDW wavevector, . At (Fig. 1d), the soft phonon at an energy of has nearly equal intensity to the second phonon branch at . Upon cooling, the intensity of the upper branch is suppressed due to the Bose factor, whereas the intensity of the soft phonon is enhanced by a factor in the cross section as its frequency, , is reduced. At , the elastic superstructure peak of the CDW phase dominates the spectrum (Fig. 1b), but we can still distinguish the critically damped phonon as a broad peak beneath the narrow elastic CDW peak. Well inside the CDW phase, the elastic superlattice reflection was too strong for any inelastic scattering to be observed at and these low temperature data (Fig. 1a) were used to determine the shape of the elastic scattering.
Figure 1e shows that the integrated intensity of the CDW superlattice peak measured at , which is within the momentum-resolution of , increases rapidly below , in good agreement with previous neutron diffraction data taken on crystals from the same growth batchMoncton75 . Above , the elastic intensity due to diffuse scattering from the sample is very small, which implies that our sample had very little structural disorder. It stays low until very close to (see inset to Fig. 1e), where a weak elastic ”central” peak consistent with low energy critical fluctuations appears.
The phonon frequency at softens on cooling (Fig. 1f) following a power law with , the value predicted by mean-field theoryGruener88 . As the phonon softens, the damping increases and the phonon becomes critically damped, i.e. , at (Fig. 1f).
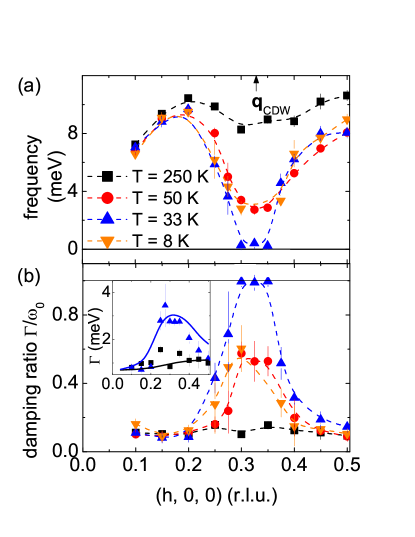
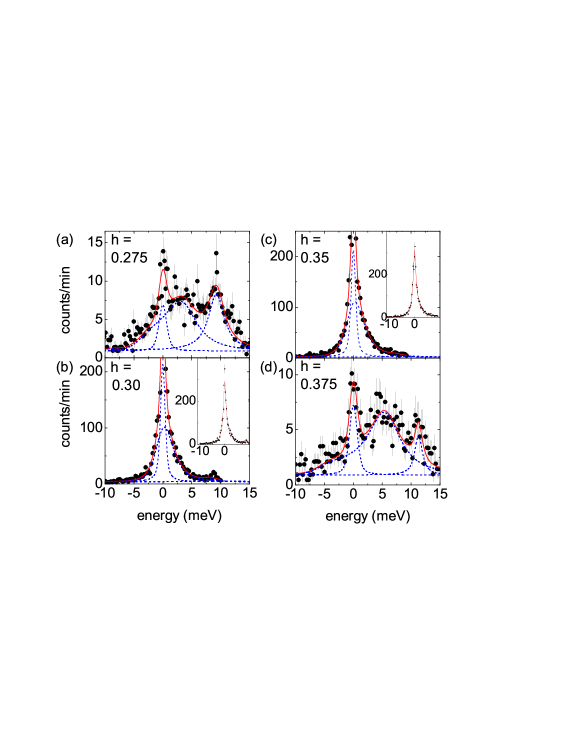
Remarkably, we observe the same power law behavior not only at , but also at and which are far outside the experimental resolution from and where the elastic peak is an order of magnitude weaker relative to the phonon intensity. Moreover, the phonon frequencies at these wavevectors also become indistinguishable from zero at (Fig. 2b,c) the same as at . This means that the phonons are critically damped over a large range of momentum transfer from to . Going further away from with the same step size, , the soft phonon branch is well separated from zero energy (Fig. 2a,d). Figure 3 shows the full dispersion and damping ratio of the soft-mode phonon branch. A broad dispersion anomaly is already evident at in agreement with previous neutron scattering measurements performed only at Moncton75 . This anomaly deepens considerably upon cooling to , where we also observe a strong increase in the damping. Finally, upon cooling to , the frequencies reach zero and the phonons become critically damped over an extended range of wavevectors. At , well below , we find hardened frequencies and reduced damping, similar to the ones observed at . However, the soft mode was not resolvable at and due to strong elastic scattering from the CDW peak (Fig. 1a). At these temperatures the Bose and factors suppress the phonon intensity and the measurements become increasingly difficult.
The -dependence of the phonon softening shown in Figure 3 is in marked contrast to the sharp, cusp-like dips that normally characterize Kohn anomalies at due to Fermi surface nestingHoesch09a ; Bohnen04 . For example in the CDW compound ZrTe3, where the importance of Fermi surface nesting has been clearly establishedHoesch09b , phonon frequencies are only renormalized over a -range of Å-1 and soften to zero at a single wavevector using a step size of Å-1Hoesch09a . In contrast, in NbSe2, we find that the phonon renormalization extends over Å-1, or over half the Brillouin zone, and the critically damped region extends over Å-1, about twice the experimental resolution. This behaviour clearly rules out a singularity in the electronic response in NbSe2 and suggests that the CDW is determined by the wavevector dependence of the electron-phonon coupling , as proposed by Johannes et al.Johannes06 . A broadened or even flat-topped susceptibility due to imperfect nesting caused, e.g., by the c-axis dispersion of the electron bands, could also lead to a renormalization of the phonon dispersion over a larger range of wavevectors, but it is unlikely that it spans over half of the Brillouin zone.
In order to elucidate the microscopic mechanism behind the CDW phase transition in NbSe2, we compare our experimental results to detailed phonon calculations based on density functional perturbation theory (DFPT) performed with the crystal structure at . This is a zero temperature technique, in which structural instabilities show up as imaginary phonon frequencies (see supplementary material). Because of the finite momentum mesh used in the DFPT calculations a numerical smearing, , of the electronic bands is necessary to compare the calculations with experiment. The effect of is analogous to a thermal smearing of the electronic structure, so it has been used in previous work to simulate the effect of temperatureBohnen04 ; Pintschovius08 . However, a naïve interpretation, i.e., Bohnen04 , results in temperatures at least one order of magnitude too large with respect to experimental observationsPintschovius08 . We believe that the calculated temperatures disagree quantitatively with experiment because the calculations ignore the thermal disorder of the lattice, which can have profound effects on the phonon excitationsDelaire08 . Elucidating these issues is an important direction for future research beyond the scope of the present work. We merely note that for NbSe2 a comparison between theory and experiment indicates that values of produce results that are consistent with a temperature range of .
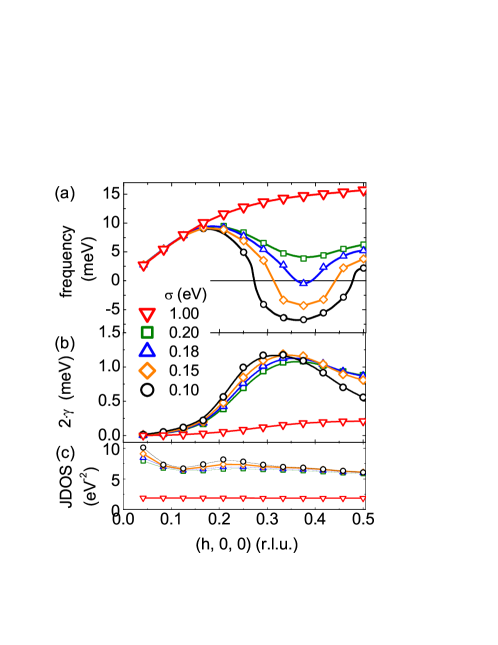
Figure 4 summarizes the calculations, showing the calculated soft-phonon dispersion, linewidth, and electronic joint density of states (JDOS). Imaginary phonon-frequencies are represented in Fig. 4a through the negative roots of the absolute value, e.g., as ’negative’ phonon frequencies. These occur in the calculated longitudinal acoustic phonon branch for over an extended range of wavevectors (Fig. 4a) in agreement with previous studiesCalandra09 , and in a qualitative agreement with the observed breakdown of the phonon dispersion. Similarly, the contribution to the phonon linewidth from the electron-phonon interaction, (Fig. 4b), shows a strong enhancement over the same extended range of wavevectors. is proportional to the product of the electron-phonon coupling and the electronic joint density of states (JDOS). Since the latter shows negligible wavevector dependence (Fig. 4c), the enhancement of the phonon linewidth observed in both experiment and theory is entirely due to a strong wavevector dependence of the electron-phonon coupling. Moreover, this range of strongly enhanced electron-phonon coupling is identical to the range over which the phonon softens. In contrast, the real part of the susceptibility only shows a much broader and only very shallow peakJohannes06 . This leads us to conclude that the observed q-dependence of the phonon self-energy is entirely due to the electron-phonon coupling and that the CDW wavevector in NbSe2 is indeed determined by the left-hand side of equation 1.
Since our measurements demonstrate that Fermi surface nesting does not play a role in the CDW phase transition in NbSe2, the electronic states serve only to provide an elevated dielectric response, with the modulation wavevector entirely determined by the coupling between electronic and vibrational dynamics. Previous studies of chromiumLamago10 and rutheniumHeid00 have shown that matrix elements can indeed be sharply wavevector dependent and also produce dips in the phonon dispersions, although in these compounds phonons do not soften to zero energy. Our work provides direct evidence that the same effect can drive the structural instability in a CDW compound. This result naturally explains why electronic probes do not find strong nesting or a clear gap at in NbSe2. Our results have implications for many other strongly correlated systems. In particular, CDW correlations in the form of stripes and/or checkerboard patterns have been linked to the emergence of unusual states and physical properties, such as colossal magnetoresistance in the manganitesCox07 and the pseudogap state in the cupratesDamascelli03 . Indeed, the observation of phonon anomalies in manganites at the wavevector of the checkerboard-type orderWeber09 and anomalies observed in La2-xSrxCuO4 at the stripe ordering wavevectorReznik06 demonstrate that strong electron-phonon coupling could be important in these materials as well.
In conclusion, we reported inelastic x-ray measurements of the temperature dependence of a longitudinal acoustic phonon in NbSe2 involving the CDW soft mode. We observe an extended region in q with overdamped phonons at the CDW transition temperature. A detailed comparison to lattice dynamical calculations via DFPT shows that in NbSe2, the periodicity, i.e. , of the CDW ordered state is determined entirely by the wavevector dependence of the electron-phonon coupling. This is in stark contrast to the standard view that a divergent electronic response defines and is evidence that a wavevector dependent electron-phonon coupling can drive a structural phase transition.
Acknowledgements.
We acknowledge valuable discussions with Igor Mazin, Jasper van Wezel, and Mike Norman. We thank John M. Tranquada for supplying us with a single crystal of NbSe2. Work at Argonne was supported by U.S. Department of Energy, Office of Science, Office of Basic Energy Sciences, under contract No. DE-AC02-06CH11357.References
- (1) S. A. Kivelson et al., Rev. Mod. Phys. 75, 1201 (2003)
- (2) E. Dagotto, Science 309, 257 (2005)
- (3) G. Grüner, Rev. Mod. Phys. 60, 1129 (1988)
- (4) S. K. Chan and V. Heine, J. Phys. F: Metal Phys. 3, 795 (1973)
- (5) M. Hoesch et al., Phys. Rev. Lett. 102, 086402 (2009)
- (6) J. Wilson, Phys. Rev. B 15, 5748 (1977)
- (7) T. M. Rice and G. K. Scott, Phys. Rev. Lett. 35, 120 (1975)
- (8) M. D. Johannes et al., Phys. Rev. B 73, 205102 (2006)
- (9) M. Calandra et al., Phys. Rev. B 80, 241108 (2009)
- (10) D. W. Shen et al., Phys. Rev. Lett. 101, 226406 (2008)
- (11) S. Borisenko et al., Phys. Rev. Lett. 102, 166402 (2009)
- (12) K. Rossnagel et al., Phys. Rev. B 64, 235119 (2001)
- (13) D. E. Moncton et al., Phys. Rev. Lett. 34, 734 (1975)
- (14) C. Ayache et al., Phys. B 180-181, 333-335 (1992)
- (15) K.-P. Bohnen et al., Phys. Rev. Lett. 93, 245501 (2004)
- (16) M. Hoesch et al., Phys. Rev. B 80, 075423 (2009)
- (17) L. Pintschovius et al., Pramana - journal of physics 71, 687 (2008)
- (18) O. Delaire et al., Phys. Rev. Lett. 101, 105504 (2008)
- (19) D. Lamago et al., Phys. Rev. B 82, 195121 (2010)
- (20) R. Heid et al., Phys. Rev. B 61, 12059 (2000)
- (21) S. Cox et al., Nature materials 7, 25 (2007)
- (22) A. Damascelli et al., Rev. Mod. Phys. 75, 473 (2003)
- (23) F. Weber et al., Nature materials 8, 798 (2009)
- (24) D. Reznik et al., Nature 440, 1170 (2006)