The End of Helium Reionization at Inferred from Cosmic Variance in HST/COS He II Ly Absorption Spectra∗∗\ast∗∗\ast Based on observations made with the NASA/ESA Hubble Space Telescope, obtained at the Space Telescope Science Institute, which is operated by the Association of Universities for Research in Astronomy, Inc., under NASA contract NAS5-26555 (programs 7575, 9350, 11528, 11742). Some of the data presented herein were obtained at the W.M. Keck Observatory, which is operated as a scientific partnership among the California Institute of Technology, the University of California and NASA; it was made possible by the generous financial support of the W.M. Keck Foundation. Based on observations collected at the European Organization for Astronomical Research in the Southern Hemisphere, Chile (programs 166.A.-0106, 071.A-0066, 083.A-0421).
Abstract
We report on the detection of strongly varying intergalactic He II absorption in HST/COS spectra of two quasars. From our homogeneous analysis of the He II absorption in these and three archival sightlines, we find a marked increase in the mean He II effective optical depth from at to at , but with a large scatter of at on scales of proper Mpc. This scatter is primarily due to fluctuations in the He II fraction and the He II-ionizing background, rather than density variations that are probed by the co-eval H I forest. Semianalytic models of He II absorption require a strong decrease in the He II-ionizing background to explain the strong increase of the absorption at , probably indicating He II reionization was incomplete at . Likewise, recent three-dimensional numerical simulations of He II reionization qualitatively agree with the observed trend only if He II reionization completes at or even below, as suggested by a large in two of our five sightlines at . By doubling the sample size at , our newly discovered He II sightlines for the first time probe the diversity of the second epoch of reionization when helium became fully ionized.
Subject headings:
dark ages, reionization, first stars – diffuse radiation – intergalactic medium – quasars: absorption lines – quasars: individual (SDSS J092447.36+485242.8, SDSS J110155.74+105302.3)1. Introduction
At redshifts , hydrogen in the intergalactic medium (IGM) is kept highly ionized by the UV background (e.g., Haardt & Madau, 1996; Faucher-Giguère et al., 2009), as evidenced by the absence of strong H I Ly absorption in quasar sightlines (Gunn & Peterson, 1965; Fan et al., 2006). In contrast, the full reionization of helium (He IIHe III) was likely delayed to when quasars were sufficiently abundant to supply the required hard eV photons (Madau & Meiksin, 1994; Miralda-Escudé et al., 2000).
The H I Ly forest provides at best indirect evidence of this last baryonic phase transition. The high IGM temperature measured at likely requires photoheating due to He II reionization. While there is strong evidence for a gradual reheating of the IGM over (Becker et al., 2011), evidence for a temperature peak signaling rapid He II reionization is tenuous (e.g., Schaye et al., 2000; Lidz et al., 2010). The feature in the mean H I absorption (Theuns et al., 2002; Faucher-Giguère et al., 2008) is unlikely due to rapid reheating of the IGM during He II reionization (Bolton et al., 2009; McQuinn et al., 2009, hereafter M09). Metal line systems might probe the spectral shape of the UV background during He II reionization (Agafonova et al., 2007; Madau & Haardt, 2009), but easily accessible metal line ratios (Songaila, 1998) are affected by metallicity variations (Bolton & Viel, 2011).
The most direct evidence for He II reionization completing at comes from observations of intergalactic He II Ly absorption ( Å) toward the few quasars whose far-UV emission is not extinguished by intervening H I Lyman limit systems (Picard & Jakobsen, 1993; Worseck & Prochaska, 2011). He II Gunn–Peterson absorption has been detected at (e.g., Jakobsen et al., 1994; Heap et al., 2000; Zheng et al., 2008), whereas the absorption becomes patchy at (Reimers et al., 1997, 2005), and evolves into a He II Ly forest at (e.g., Zheng et al., 2004; Fechner et al., 2006).
Semianalytic (Gleser et al., 2005; Furlanetto & Oh, 2008; Furlanetto & Dixon, 2010) and numerical radiative transfer simulations (Sokasian et al. 2002; M09) predict that He II reionization is inhomogeneous and extended. Akin to H I at (Gnedin, 2000), He II reionization is characterized by three phases: (1) He III “bubble” growth around quasars, (2) overlap of He III zones around the more abundant quasars at , and (3) gradual reionization of remaining dense He II regions. The large fluctuations in the He II absorption suggest that the overlap phase occurs at (Reimers et al., 1997; Smette et al., 2002; Jakobsen et al., 2003), but current constraints on the physics and morphology of He II reionization are limited by cosmic variance among the handful of sightlines studied in detail.
The Cosmic Origins Spectrograph (COS; Osterman et al., 2010) on the Hubble Space Telescope (HST) has the sensitivity to obtain He II absorption spectra of unprecedented quality (Shull et al., 2010). Although efficient pre-selection of likely transparent sightlines with UV photometry from the Galaxy Evolution Explorer (GALEX) resulted in the discovery of 22 He II-transparent quasars (Syphers et al., 2009a, b), most of them are too faint for detailed studies with COS. In this Letter, we report the discovery of two UV-bright quasars with detected He II absorption selected from our survey of the GALEX data set (Worseck & Prochaska, 2011): SDSS J092447.36+485242.8 (catalog SDSSJ092447.36+485242.8) () and SDSS J110155.74+105302.3 (catalog SDSSJ110155.74+105302.3) (), hereafter SDSS J0924+4852 and SDSS J1101+1053, respectively. Together with archival data, their diverse COS spectra constrain the completion of He II reionization to . We adopt a flat cosmology with and (Komatsu et al., 2011).
2. Observations and data reduction
2.1. HST Far-ultraviolet Spectra
We obtained HST/COS FUV spectra of SDSS J0924+4852 and SDSS J1101+1053 in course of a survey for He II-transparent sightlines among the few UV-bright quasars detected by GALEX (Worseck & Prochaska, 2011, G. Worseck et al. 2011, in preparation). We employed the grating G140L in the 1105 Å setup (1110–2150 Å, at 1150 Å) at two detector settings to reduce fixed pattern noise.
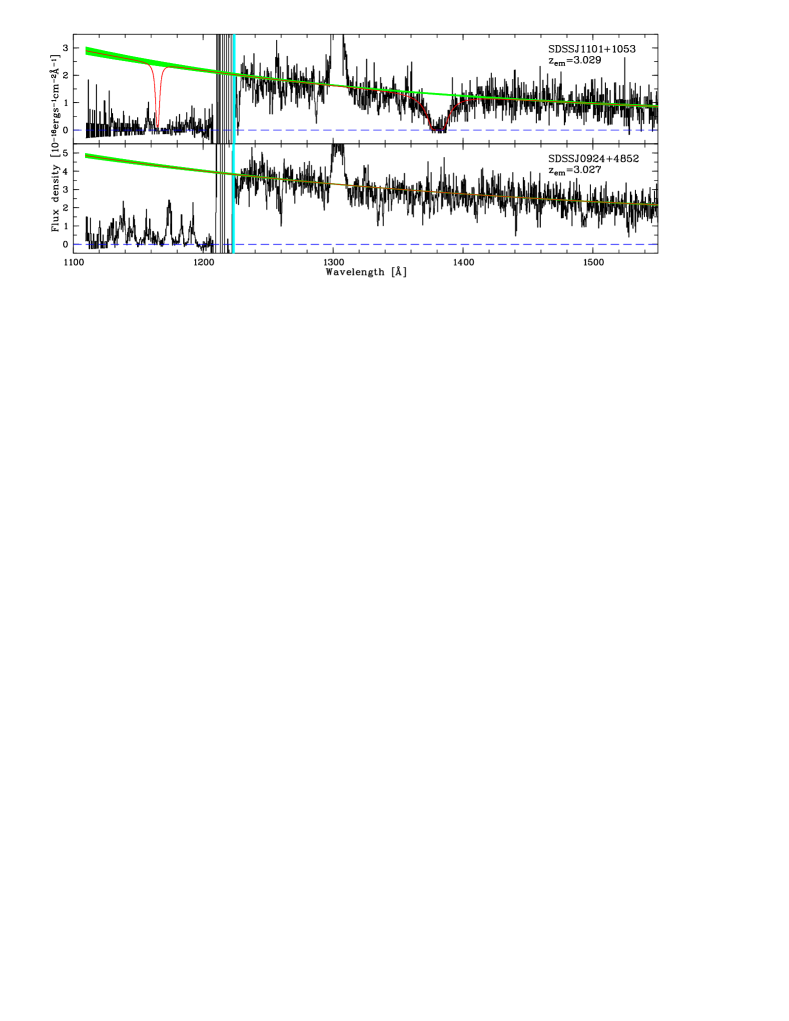
The spectra were extracted using CALCOS v2.12 and recalibrated with custom software. Because the diffuse background is dominated by COS detector dark current, it is well approximated by a constant over the cosmetically better detector segment A on which the G140L spectra were recorded. A wavelength-dependent background estimate gives very similar results, so that any systematic background subtraction error is likely small (%). Geocoronal H I Ly emission was subtracted. The raw counts of individual exposures were co-added before flux calibration, thereby preserving integer counts of our faint targets obtained in the Poisson regime. The spectra were rebinned by a factor of three to yield approximate Nyquist sampling ( Å pixel-1) at a signal-to-noise ratio (S/N) of () per pixel for SDSS J1101+1053 (SDSS J0924+4852) in the quasar continuum (Figure 1).
The HST/COS G130M and G140L data of HE 23474342 (Shull et al., 2010) were retrieved from the HST archive and reduced accordingly. For the G140L spectrum on detector segment B, we adopted the wavelength solution by Shull et al. (2010) and aligned it with the archival FUSE spectrum and the G130M spectrum on their overlapping wavelength range. The spectra both have an S/N per Å (G140L) and Å (G130M) pixel.
We also reanalyzed the archival HST/STIS G140L spectra of Q 0302003 (Heap et al., 2000) and HS 1157+3143 (Reimers et al., 2005). The individual exposures were extracted using CALSTIS v2.30 and co-added, yielding a continuum S/N per Å pixel.
Each extinction-corrected spectrum was normalized by fitting a power law on selected regions redward of He II Ly in the quasar rest frame, and free of obvious emission and absorption lines. We accounted for low-redshift Lyman limit breaks by adopting the power law only blueward of the lowest-redshift break redward of He II Ly. The continuum fit was performed by maximizing the likelihood function for the Poisson gross counts, modeling the signal part as a power law in flux. Continuum errors were estimated by a Monte Carlo routine, drawing Poisson deviates of the inferred continuum counts. The statistical continuum error in the extrapolation region blueward of He II Ly is % for the high-quality spectrum of HE 23474342 and 5%–10% for the remaining quasars. Weak Lyman limit breaks of low-redshift H I absorbers present a systematic uncertainty in the continuum in the He II absorption region, although no such absorber could be identified by its Lyman series in the low S/N data.
2.2. Optical High-resolution H I Forest Spectra
We observed SDSS J0924+4852 with the Keck I High-Resolution Echelle Spectrometer (HIRES; Vogt et al., 1994) for 3 hr with the slit () covering the range Å Å. The HIRedux000http://www.ucolick.org/~xavier/HIRedux/-reduced spectrum has an S/N per 2.6 pixel in the H I Ly forest. The echelle orders were normalized by low-order polynomials and weighted by inverse variance in their overlapping regions.
SDSS J1101+1053 was observed with the Very Large Telescope (VLT) UV-Visual Echelle Spectrograph (UVES; Dekker et al., 2000) for 12.1 hr with the 1″ slit () covering the range 3750–4980 Å. The spectra were reduced and normalized using the ESO Common Pipeline Library111http://www.eso.org/sci/software/cpl/, yielding an S/N per 1.85 pixel in the Ly forest.
We complemented this data set with an archival S/N VLT/UVES spectrum of HE 23474342 (e.g., Worseck et al., 2007).
3. Results
3.1. Detection of Intergalactic He II Ly Absorption
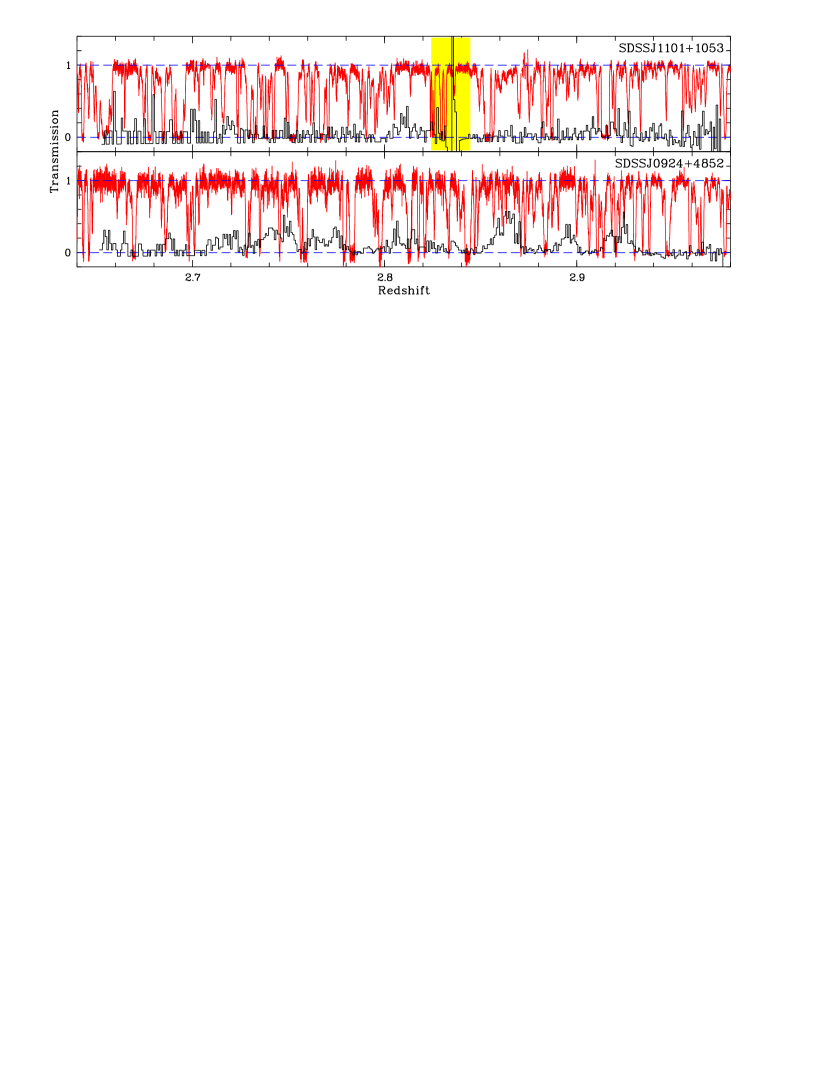
Figure 2 shows the cospatial H I and He II Ly absorption spectra of SDSS J1101+1053 and SDSS J0924+4852 as a function of redshift. The H I spectra have been corrected for metal line absorption. At the He II spectra are contaminated by residuals of geocoronal Ly emission, so that the proximity zones of the quasars cannot be covered. Both sightlines present strong unresolved He II absorption compared to the optically thin H I forest, yet at different levels. While we see almost completely saturated Gunn–Peterson-like absorption toward SDSS J1101+1053, the absorption toward SDSS J0924+4852 is patchy over the whole covered redshift range. Comparing H I and He II absorption, we find that H I and He II do not track each other very well. Toward SDSS J0924+4852, a small H I void at shows corresponding He II transmission, but there is stronger He II transmission at and where H I absorption is stronger and should have caused almost complete saturation in He II. The small H I void at toward SDSS J1101+1053 does not show obvious He II transmission. Near , the He II absorption spectrum of SDSS J1101+1053 is contaminated by H I Ly absorption of a serendipitously discovered damped H I absorber (, ). Strong residuals after profile division render the spectral region unusable for assessing He II absorption. Neither the damped system nor the interstellar medium causes significant metal line absorption at our low spectral resolution.
3.2. The Redshift Evolution of the He II Effective Optical Depth
To quantify the He II absorption we computed the He II effective optical depth, , in our newly discovered sightlines and the three archival ones. We employed a novel maximum-likelihood technique to measure in the Poisson limit in the low-count regime of our data. The Poisson nature of the COS detector counts becomes prominent in Figure 2 at , where single counts are registered at a decreasing instrument response. Naive subtraction of a mean background from these integer counts results in unphysical negative fluxes.
For a spectral segment with pixels we maximized the Poisson likelihood function
| (1) |
with the integer number of counts per pixel , the average background , and the unknown signal . The signal was modeled as a constant in transmission, converted to non-integer counts via the exposure time , the flux calibration curve , and the power-law continuum . Error bars (68.26% confidence) were calculated via integrating . In case of no maximum in (), we obtained the lower limits on by refitting on mock data generated from Poisson fluctuations of the background.
The distribution of depends on the averaging scale in the forest. We chose a constant bin size of ( proper Mpc at ) as a compromise to capture small-scale variations in the absorption, while retaining enough sensitivity to measure high effective optical depths against the Poisson detector background. Small bin size variations do not change our results. For all five sightlines, we adopted identical redshift bins without focusing on particular features. Proximity zones, geocoronal emission, and the damped H I absorber toward SDSS J1101+1053 were omitted from our analysis. For HE 23474342, we adopted from the G130M spectrum for completely covered redshift bins.
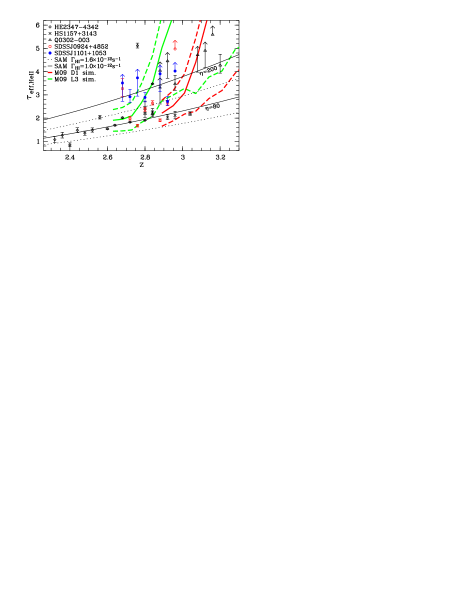
Figure 3 and Table 1 present for the five sightlines in the redshift range . The He II effective optical depth evolves strongly from at to at , although cosmic variance might play a role at the lowest and highest redshifts (probed by one sightline each). The effective optical depth in the HE 23474342 sightline rather smoothly increases with redshift until . Between and , we observe a large scatter in . In four of our five sightlines, approximately half of the data points continue the smooth trend from lower redshifts, whereas the remaining ones are significantly higher. For example, the high-quality spectrum of HE 23474342 shows at . In the sightline toward SDSS J1101+1053, strong absorption with occurs almost everywhere, whereas mostly fluctuates around toward SDSS J0924+4852. Apart from the known He II void at (e.g., Jakobsen et al., 2003), the Q 0302003 sightline shows at .
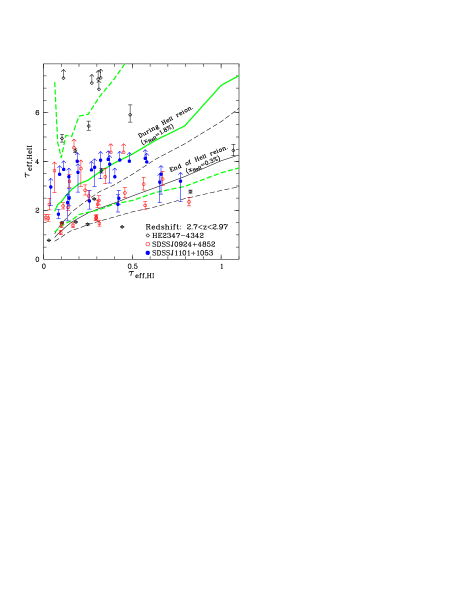
Small-scale density variations might contribute to the effective optical depth variations. We investigated this by comparing the He II absorption with the cospatial H I Ly absorption on a small scale ( proper Mpc at ). We focused on the redshift range where the scatter and the data coverage is largest. Figure 4 presents our measurements toward the three quasars with H I and He II data. From the absence of a clear correlation between the measured H I and He II absorption we conclude that the fluctuations cannot be due to IGM density variations alone.
| Quasar | ||
|---|---|---|
| HE 23474342 | ||
| HS 1157+3143 | ||
| SDSS J0924+4852 | ||
| SDSS J1101+1053 | ||
| Q 0302003 | ||
4. Discussion
4.1. Comparison to Models
To further explore the results in Figure 3 we constructed a simple semianalytic model for He II absorption in a reionized IGM. For an IGM highly photoionized in H and He that follows the temperature–density relation (Hui & Gnedin, 1997), the H I optical depth is
also known as the fluctuating Gunn–Peterson approximation (e.g., Weinberg et al., 1997). H I and He II trace the same cosmic densities, so
| (3) |
in a reionized IGM with an H I (He II) photoionization rate (). We have approximated number densities as column densities with the column density ratio commonly measured in He II forest spectra. The He II effective optical depth can be written as
| (4) |
with the H I optical depth probability distribution function . With Equation (4.1) and the overdensity probability distribution from simulations by Bolton & Becker (2009), is a function of the temperature–density relation () and the ionization conditions (). We adopt K and the post-reionization asymptotic value (Hui & Gnedin, 1997), (Bolton et al., 2005) and (Fechner & Reimers, 2007).
The lower solid curve in Figure 3 shows the resulting model. It matches surprisingly well to the measured values at . Part of the data follows this relation until , whereas the rest significantly departs from it to larger values. The amplitude of mostly depends on the ionization conditions, indicated in Figure 3 by a higher (Dall’Aglio et al., 2008) or a softer UV background (higher ). However, the steep evolution of cannot be matched unless there is significant redshift evolution in the model parameters. A change in the temperature–density relation seems implausible, since a flattening would cause to decrease, and a rise in would require unreasonably low IGM temperatures. Since and are tied, the steep increase of might suggest a strong decrease of at related to a drop in the mean free path of He II-reionizing photons if the quasar emissivity is constant. While this alone likely indicates that He II reionization is occurring, the breakdown of the high-ionization limit of helium could simply invalidate our semianalytic approach at .
To describe the redshift evolution of the effective optical depth during reionization, we calculated from numerical models of He II reionization (M09). We focused on their D1 and L3 simulations, which have different reionization histories due to the filtering of UV radiation by dense absorbers. Run L3 supplements the D1 simulation with absorbers that may not be resolved and which delay completion of reionization slightly from (D1) to (L3). From each simulation snapshot we computed 1000 skewers across the box, each providing samples of on the same scale as our measurements ().
The thick curves in Figure 3 show the resulting mean (solid) and its scatter (dashed). Both models predict a strong increase in the He II absorption as their respective volume-averaged He II fraction rises, in contrast to our optically thin models. On our chosen scale , the models exhibit large fluctuations in due to cosmic variance in the He II reionization histories. At the end of He II reionization, both models show a characteristic turnover in to approximately our favored optically thin model of the post-reionization IGM. The data are largely inconsistent with the predictions from model D1 of M09 due to the large excess toward high at . Model L3, meanwhile, also does not reproduce the data perfectly, since the largest values at 2.7–2.8 and the lowest values at 2.9–3 cannot be easily accommodated.
In Figure 4, we compare the measured H I and He II effective optical depths to mock samples of two snapshots of the L3 simulation by M09, obtained on the same scale and rescaled to a common redshift . With respective volume-averaged He II fractions of % and %, the simulation outputs trace the end stages of He II reionization. In the mock spectra, helium and hydrogen absorptions are correlated due to the underlying density field and the emerging He II-ionizing background. The scatter in this relation is primarily due to fluctuations in the He II fraction and the UV background, which decrease as He II reionization proceeds. H I voids (low ) without nearby UV sources contain large amounts of He II if reionization is still ongoing. The largest inferred effective optical depths () toward HE 23474342 indicate that the He II fraction is still %. The SDSS J1101+1053 sightline is mostly consistent with the scenario of still incomplete He II reionization, whereas parts of the SDSS J0924+4842 sightline are better matched with a reionized IGM, which, however, does not contain the strong fluctuations seen in the data. Thus, while data and the M09 models suggest that we see the end stages of He II reionization, the coexistence of patches with both large and small He II fractions at moderate densities is difficult to explain. A more rapid increase in the quasar emissivity, a short quasar lifetime or quasar anisotropy (e.g., Hennawi & Prochaska, 2007) might amplify the modeled fluctuations to the required level.
4.2. Implications
Our newly discovered quasar sightlines with detected He II Ly absorption highlight the diversity in He II absorption near the epoch of He II reionization, irrespective of the gas density probed by the coeval H I Ly forest. The alternating voids and troughs toward SDSS J0924+4852 are expected at the very end of He II reionization, in agreement with current numerical modeling (McQuinn et al., 2009). In contrast, the two long (Mpc) He II absorption troughs toward HE 23474342 indicate that He II reionization is still incomplete. In agreement with Furlanetto & Dixon (2010) and Shull et al. (2010) we find that the large at in the HE 23474342 sightline is inconsistent with the reionized IGM in the L3 simulation by McQuinn et al. (2009) at % confidence. Extended trough-like absorption in the SDSS J1101+1053 sightline (Figure 2) supports the view that He II reionization is delayed to or even below.
When measured on a fixed spatial scale, the redshift evolution of the He II effective optical depth is a powerful probe of He II reionization. The marked upturn in at indicates a strong decrease in the He II-ionizing background coupled to the mean free path of He II-ionizing photons, or a strongly increasing He II abundance. Both of these suggest that He II reionization is occurring at . Similar conclusions were obtained by Dixon & Furlanetto (2009), who inferred a dramatic decrease in the He II-ionizing background or a decrease in the mean free path at . However, the sparse data then available provided only weak constraints on the epoch of He II reionization.
By combining our data with three-dimensional numerical radiative transfer simulations (McQuinn et al., 2009), we constrain the end of the He II reionization epoch to . The steep increase in at is well reproduced by models of significantly delayed He II reionization () driven by quasars, whereas the strong absorption at rules out models with He II reionization completing at . The coexistence of regions with strong and weak ionization at suggests that our HST/COS spectra probe the end stages of He II reionization. We speculate that the variance in the data might be explained with more sophisticated modeling of quasars in He II reionization simulations (e.g., their number density, spectral energy distribution, lifetime, anisotropy). Thus, He II reionization might yield unique insight into the quasar phenomenon.
References
- Agafonova et al. (2007) Agafonova, I. I., Levshakov, S. A., Reimers, D., Fechner, C., Tytler, D., Simcoe, R. A., & Songaila, A. 2007, A&A, 461, 893
- Becker et al. (2011) Becker, G. D., Bolton, J. S., Haehnelt, M. G., & Sargent, W. L. W. 2011, MNRAS, 410, 1096
- Bolton & Becker (2009) Bolton, J. S., & Becker, G. 2009, MNRAS, 398, L26
- Bolton et al. (2005) Bolton, J. S., Haehnelt, M. G., Viel, M., & Springel, V. 2005, MNRAS, 357, 1178
- Bolton et al. (2009) Bolton, J. S., Oh, S. P., & Furlanetto, S. R. 2009, MNRAS, 396, 2405
- Bolton & Viel (2011) Bolton, J. S., & Viel, M. 2011, MNRAS, in press, arXiv:1011.1959
- Dall’Aglio et al. (2008) Dall’Aglio, A., Wisotzki, L., & Worseck, G. 2008, A&A, 491, 465
- Dekker et al. (2000) Dekker, H., D’Odorico, S., Kaufer, A., Delabre, B., & Kotzlowski, H. 2000, in Proc. SPIE, Vol. 4008, 534
- Dixon & Furlanetto (2009) Dixon, K. L., & Furlanetto, S. R. 2009, ApJ, 706, 970
- Fan et al. (2006) Fan, X., et al. 2006, AJ, 132, 117
- Faucher-Giguère et al. (2009) Faucher-Giguère, C.-A., Lidz, A., Zaldarriaga, M., & Hernquist, L. 2009, ApJ, 703, 1416
- Faucher-Giguère et al. (2008) Faucher-Giguère, C.-A., Prochaska, J. X., Lidz, A., Hernquist, L., & Zaldarriaga, M. 2008, ApJ, 681, 831
- Fechner & Reimers (2007) Fechner, C., & Reimers, D. 2007, A&A, 461, 847
- Fechner et al. (2006) Fechner, C., et al. 2006, A&A, 455, 91
- Furlanetto & Dixon (2010) Furlanetto, S. R., & Dixon, K. 2010, ApJ, 714, 355
- Furlanetto & Oh (2008) Furlanetto, S. R., & Oh, S. P. 2008, ApJ, 681, 1
- Gleser et al. (2005) Gleser, L., Nusser, A., Benson, A. J., Ohno, H., & Sugiyama, N. 2005, MNRAS, 361, 1399
- Gnedin (2000) Gnedin, N. Y. 2000, ApJ, 535, 530
- Gunn & Peterson (1965) Gunn, J. E., & Peterson, B. A. 1965, ApJ, 142, 1633
- Haardt & Madau (1996) Haardt, F., & Madau, P. 1996, ApJ, 461, 20
- Heap et al. (2000) Heap, S. R., Williger, G. M., Smette, A., Hubeny, I., Sahu, M. S., Jenkins, E. B., Tripp, T. M., & Winkler, J. N. 2000, ApJ, 534, 69
- Hennawi & Prochaska (2007) Hennawi, J. F., & Prochaska, J. X. 2007, ApJ, 655, 735
- Hui & Gnedin (1997) Hui, L., & Gnedin, N. Y. 1997, MNRAS, 292, 27
- Jakobsen et al. (1994) Jakobsen, P., Boksenberg, A., Deharveng, J. M., Greenfield, P., Jedrzejewski, R., & Paresce, F. 1994, Nat, 370, 35
- Jakobsen et al. (2003) Jakobsen, P., Jansen, R. A., Wagner, S., & Reimers, D. 2003, A&A, 397, 891
- Komatsu et al. (2011) Komatsu, E., et al. 2011, ApJS, 192, 18
- Lidz et al. (2010) Lidz, A., Faucher-Giguère, C.-A., Dall’Aglio, A., McQuinn, M., Fechner, C., Zaldarriaga, M., Hernquist, L., & Dutta, S. 2010, ApJ, 718, 199
- Madau & Haardt (2009) Madau, P., & Haardt, F. 2009, ApJ, 693, L100
- Madau & Meiksin (1994) Madau, P., & Meiksin, A. 1994, ApJ, 433, L53
- McQuinn et al. (2009) McQuinn, M., Lidz, A., Zaldarriaga, M., Hernquist, L., Hopkins, P. F., Dutta, S., & Faucher-Giguère, C.-A. 2009, ApJ, 694, 842
- Miralda-Escudé et al. (2000) Miralda-Escudé, J., Haehnelt, M., & Rees, M. J. 2000, ApJ, 530, 1
- Osterman et al. (2010) Osterman, S., et al. 2010, Ap&SS, submitted, arXiv:1012.5827
- Picard & Jakobsen (1993) Picard, A., & Jakobsen, P. 1993, A&A, 276, 331
- Reimers et al. (2005) Reimers, D., Fechner, C., Hagen, H.-J., Jakobsen, P., Tytler, D., & Kirkman, D. 2005, A&A, 442, 63
- Reimers et al. (1997) Reimers, D., Köhler, S., Wisotzki, L., Groote, D., Rodriguez-Pascual, P., & Wamsteker, W. 1997, A&A, 327, 890
- Schaye et al. (2000) Schaye, J., Theuns, T., Rauch, M., Efstathiou, G., & Sargent, W. L. W. 2000, MNRAS, 318, 817
- Shull et al. (2010) Shull, J. M., France, K., Danforth, C. W., Smith, B., & Tumlinson, J. 2010, ApJ, 722, 1312
- Smette et al. (2002) Smette, A., Heap, S. R., Williger, G. M., Tripp, T. M., Jenkins, E. B., & Songaila, A. 2002, ApJ, 564, 542
- Sokasian et al. (2002) Sokasian, A., Abel, T., & Hernquist, L. 2002, MNRAS, 332, 601
- Songaila (1998) Songaila, A. 1998, AJ, 115, 2184
- Syphers et al. (2009a) Syphers, D., Anderson, S. F., Zheng, W., Haggard, D., Meiksin, A., Schneider, D. P., & York, D. G. 2009a, ApJS, 185, 20
- Syphers et al. (2009b) Syphers, D., et al. 2009b, ApJ, 690, 1181
- Theuns et al. (2002) Theuns, T., Bernardi, M., Frieman, J., Hewett, P., Schaye, J., Sheth, R. K., & Subbarao, M. 2002, ApJ, 574, L111
- Vogt et al. (1994) Vogt, S. S., et al. 1994, in Proc. SPIE, Vol. 2198, 362
- Weinberg et al. (1997) Weinberg, D. H., Miralda-Escudé, J., Hernquist, L., & Katz, N. 1997, ApJ, 490, 564
- Worseck et al. (2007) Worseck, G., Fechner, C., Wisotzki, L., & Dall’ Aglio, A. 2007, A&A, 473, 805
- Worseck & Prochaska (2011) Worseck, G., & Prochaska, J. X. 2011, ApJ, 728, 23
- Zheng et al. (2004) Zheng, W., et al. 2004, ApJ, 605, 631
- Zheng et al. (2008) —. 2008, ApJ, 686, 195