Testing Theory with Dynamical Masses and Orbits of Ultracool Binaries
Abstract
Mass is the fundamental parameter that governs the evolution of stars, brown dwarfs, and gas-giant planets. Thus, direct mass measurements are essential to test the evolutionary and atmospheric models that underpin studies of these objects. We present results from our program to test models using precise dynamical masses for visual binaries based on Keck laser guide star adaptive optics astrometric monitoring of a sample of over 30 ultracool () objects since 2005. In just the last 2 years, we have more than tripled the number of late-M, L, and T dwarf binaries with precise dynamical masses. For most field binaries, based on direct measurements of their luminosities and total masses, we find a “temperature problem” in that evolutionary model radii give effective temperatures that are inconsistent with those from model atmosphere fitting of observed spectra by 100–300 K. We also find a “luminosity problem” for the only binary with an independent age determination (from its solar-type primary via age–activity–rotation relations). Evolutionary models underpredict the luminosities of HD 130948BC by a factor of 2, implying that model-based substellar mass determinations (e.g., for directly imaged planets and cluster IMFs) may be systematically overestimating masses. Finally, we have employed the current sample of binary orbits to carry out a novel test of the earliest evolutionary stages, by using the distribution of orbital eccentricities to distinguish between competing models of brown dwarf formation.
1 Introduction
Binary systems have long been used to probe both the inner workings and the origins of stars. In multiple systems the laws of gravity can be used to infer the masses of stars. Mass is the fundamental property of any object as this largely determines its entire life history, and thus binaries with direct dynamical mass measurements are important benchmarks for testing theory. Binaries also record within their orbits a dynamical imprint of their formation and subsequent evolution. For a given mass, the total energy of the system is related solely to the semimajor axis of the orbit (), while the angular momentum depends on the orbital eccentricity (). Decades before it was known that nucleosynthesis powers stars, well-determined binary orbits were commonplace (e.g., orbits were published in the compilation of Aitken 1918) and were, for example, used to argue for a dynamical constraint on the age of the Galaxy of Gyr (Ambartsumian 1937) as opposed to the 10,000 Gyr age limit supported by Jeans (1935). Thus, the study of binary orbits has a rich heritage, predating and defining much of modern astrophysics.
It has only recently been possible to extend such studies below , to masses at the bottom of the main sequence and into the brown dwarf regime. The field population over this mass range encompasses spectral types , collectively referred to as “ultracool” owing to their shared low-temperature atmospheric physics. Only 10 years ago were the first large samples of ultracool dwarfs identified via wide-field surveys such as 2MASS (e.g., Burgasser et al. 1999), DENIS (e.g., Delfosse et al. 1999), and SDSS (e.g., Hawley et al. 2002). The underlying binary population was subsequently uncovered by high-resolution imaging surveys using HST (e.g., Bouy et al. 2003; Burgasser et al. 2003) and adaptive optics (AO) from the ground (e.g., Close et al. 2002; Liu & Leggett 2005). In the first half of the last decade, orbital monitoring of a few select binaries yielded three dynamical mass measurements: LHS 1070BC (M8.5+M9.5; Leinert et al. 2001); Gl 569Bab (M8.5+M9; Lane et al. 2001); and 2MASS J07462000AB (L0+L1.5; Bouy et al. 2004). These first direct mass constraints on ultracool models probed relatively warm temperatures ( K) and high masses (only Gl 569Bb is likely to be a brown dwarf; Dupuy et al. 2010).
Over just the last three years the number of dynamical masses sufficiently precise for meaningful model tests () has tripled, with components now extending down to masses of 30 and temperatures of 1000 K. This rapid expansion in dynamical masses has been driven by high-precision orbital monitoring programs that utilize the relatively new capability of laser guide star (LGS) AO to resolve the shortest period binaries from ground-based telescopes. Our program using Keck LGS AO has been ongoing since 2005 and has provided five of the six new high-precision dynamical masses. All nine ultracool binaries with high-precision dynamical masses are listed in Table 1. In the cases where multiple orbits have been published for a binary, the parameters from the highest quality orbit determination are given; previous orbit references are listed in parentheses.
| Name | Component | Period | Eccentricity | Total mass | Ref. |
|---|---|---|---|---|---|
| Sp. Types | [days] | [] | |||
| Gl 569Bab | M8.5+M9 | 1 (2–5) | |||
| LP 349-25AB | M7.5+M8 | 1 (5) | |||
| HD 130948BC | L4+L4 | 6 (5,7) | |||
| 2M074620AB | L0+L1.5 | 5 (8) | |||
| LHS 2397aAB | M8+L7 | 9 (5) | |||
| 2M153429AB | T5+T5.5 | 10 (5) | |||
| LHS 1901AB | M6.5+M6.5 | 1 | |||
| LHS 1070BC | M8.5+M9.5 | 11 (12) | |||
| 2M220620AB | M8+M8 | 13 (5) |
References. — (1) Dupuy et al. (2010); (2) Lane et al. (2001); (3) Zapatero Osorio et al. (2004); (4) Simon et al. (2006); (5) Konopacky et al. (2010); (6) Dupuy et al. (2011, revised); (7) Dupuy et al. (2009b); (8) Bouy et al. (2004); (9) Dupuy et al. (2009c); (10) Liu, Dupuy, & Ireland (2008); (11) Seifahrt et al. (2008); (12) Leinert et al. (2001); (13) Dupuy et al. (2009a).
2 Testing Evolutionary and Atmospheric Models
The growing sample of ultracool dwarf dynamical masses has enabled some of the strongest tests of theoretical models to date, particularly in the brown dwarf regime. Because brown dwarfs do not have a sustained source of internal energy generation, they simply grow colder and fainter over time. Thus, the sample of field brown dwarfs spans a wide range of masses at a given luminosity, and the only means of pinpointing a given brown dwarf’s evolutionary status is to measure its mass or age. As shown by Liu, Dupuy, & Ireland (2008), fundamental properties such as and are 5 better constrained (i.e., model tests are 5 stronger) with dynamical mass measurements as compared to age determinations, which are ordinarily of lower precision.
One of the major components of our work has been to develop an analysis method that produces rigorous, quantitative tests of models based solely on directly measured properties (i.e., mass and luminosity). This is of fundamental importance, as other previous approaches were sometimes based on estimates or the model-predicted color–magnitude diagram, both of which are often prone to severe systematic biases (e.g., see discussions in Gizis & Reid 2006 and Section 4.5 of Dupuy et al. 2010). The discrepancies we have found between observations and models to date fall into two categories: (1) problems with the luminosities predicted by evolutionary models, (2) problems with temperature estimates derived from model atmospheres and/or from evolutionary model radii.
2.1 “Luminosity Problem”
Conventional wisdom is that the most robust predictions of substellar models are bulk properties such as the radius and bolometric luminosity () since independent models put forth by different groups produce nearly identical (to within a few percent) values at ages beyond a few Myr. Consequently, evolutionary models have become trusted to provide accurate mass estimates in the many situations when luminosity and age are well constrained, such as cluster mass functions (e.g., Lodieu et al. 2007) and directly imaged extrasolar planets (e.g., Marois et al. 2008). However, until recently no direct measurements of luminosity and mass were available for any brown dwarfs that also had well determined ages.
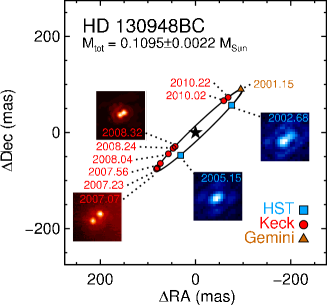
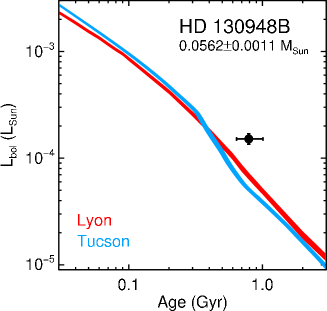
The first, and to date only, system that enables a direct test of substellar luminosity evolution is the L4+L4 binary HD 130948BC (Dupuy et al. 2009b). Its model-derived age (given its measured total mass and component luminosities) is significantly younger than the age of the primary G2V star in this triple system. This is a 2 discrepancy when accounting for the errors in the binary’s measured mass and luminosities and the gyrochronology relation used to age-date the primary star (Mamajek & Hillenbrand 2008). If we assume that the stellar age and its error are correct (i.e., HD 130948A is not simply an outlier as compared to the cluster rotation sequences), then the luminosities predicted by evolutionary models for HD 130948B and C are a factor of 2 lower than what is observed. In considering this potential luminosity problem, we will now address the following questions: (1) is there additional evidence for models underpredicting luminosities of substellar objects; and (2) what physical mechanism could be responsible for this effect?
(1) Is there additional evidence for the luminosity problem? If models underpredict luminosities, this would manifest as either model-derived masses (based on and age) that are 25% too high or model-derived ages (based on mass and ) that are too young. The former problem can be tested in the multiple planet system around HR 8799. Fabrycky & Murray-Clay (2010) have shown that there only two plausible scenarios for the three tightly packed, massive planets (model-derived masses of 7, 10, and 10 ) to be dynamically stable: (1) the inner planets must be in 2:1 resonance, and all three planets must have masses lower than predicted by models by at least 20%–30%; or (2) both the inner pair and outer pair of planets must be in 2:1 resonances, in which case the masses of the planets could be as much as a factor of 2 larger. The careful construction of the system required in the latter case may suggest that the first scenario is in fact more plausible, and the “luminosity problem” may also be seen here.
Further evidence for the luminosity problem can also come from objects with model-derived ages that appear to be too young. Dupuy et al. (2010) have observed this in the M7.5+M8 binary LP 349-25AB for which Lyon models give an age of Myr. This is essentially identical to the canonical Pleiades age of 125 Myr as determined from the lithium depletion boundary independent of model luminosity predictions (Stauffer et al. 1998). However, LP 349-25AB appears to be significantly older than the Pleiades given the strong upper limit on its Li 1 abundance (Reiners & Basri 2009), and it also does not show spectroscopic signatures of youth as is normally seen in young (100 Myr) field dwarfs (e.g., McGovern et al. 2004; Allers et al. 2007).
(2) What physical mechanisms could explain the luminosity problem? After a few Myr of evolution, model cooling tracks that adopt very different initial conditions converge to essentially the same luminosity (e.g., Baraffe et al. 2002), so accounting for different formation histories such as in “cold start” models with radiative energy losses due to accretion (e.g., Marley et al. 2007) will not alter model cooling tracks sufficiently to explain our observed luminosity discrepancy. Rather, it is more likely that a process sustained over these objects’ lifetimes, such as convection, is responsible for the problem. Mullan & MacDonald (2010) have recently constructed evolutionary models tailored to the components of HD 130948BC in which the onset of convection is inhibited by very strong magnetic fields throughout the interior. This effect can substantially alter the radius evolution of the components of HD 130948BC and thus explain the observed discrepancy on the H-R diagram reported by Dupuy et al. (2009b) because their new models yield larger radii, which shifts model tracks to lower . However, at the same time these models also lower the model-predicted luminosities by 0.2 dex (50%), increasing the observed luminosity discrepancy.
If the inhibition of the onset of convection has the opposite effect on the luminosity evolution, then perhaps the efficiency of convection must be changed. Chabrier et al. (2007) consider the impact of strong interior magnetic fields and fast rotation on the convective energy transport in low-mass stars. They find that these processes result in lowered convective efficiency, which in turn results in bloated radii for 0.3–0.8 stars, while lower mass fully convective stars are much less affected. The effect of reduced convective energy transport for brown dwarfs is not investigated in detail, but Chabrier et al. (2007) point out that its main effect will be to slow their contraction rate. This may effectively “slow down the clock” of substellar evolution, i.e., for a given mass and age objects would be larger and more luminous than predicted by conventional evolutionary models that do not include the effects of convective inhibition due to rotation or strong interior magnetic fields.
2.2 “Temperature Problem”
Model atmospheres offer the possibility of determining the temperature and surface gravity of an object from a single spectrum. This approach is widely used in the study of very low-mass stars, brown dwarfs, and directly imaged planets. However, the reliability of such estimates (and the conclusions drawn from them) depend entirely the fidelity of the model atmospheres being used. This can only be assessed in special cases where independent constraints on the mass, age, or radius are available. We have utilized our measured dynamical masses of ultracool field dwarfs to provide some of the strongest tests of model atmospheres to date. This is made possible by the fact that direct mass measurements effectively pin down the evolutionary status of a field object to a degree of certainty commensurate with the precision of the measured mass and luminosity (both typically ). The values of and then inferred from evolutionary models are limited to a very narrow range, typically exceeding the precision of the model atmosphere grid steps of 50–100 K and 0.5 dex. This evolutionary model-derived is essentially a restatement of the model radius given the measured luminosity, following the definition of effective temperature, . Therefore, these binaries provide precise temperature benchmarks that can be compared to results from model atmosphere fitting.
We have found that temperatures derived from model atmospheres are typically inconsistent with those from evolutionary models at the level of 100–300 K. The amplitude and the sign of this disagreement vary over the full range of our sample. For example, T dwarf model atmosphere fits give 100–200 K warmer temperatures than evolutionary model radii (Liu et al. 2008), but L dwarf model atmosphere fits give 200–300 K cooler temperatures (Dupuy et al. 2009b). The lack of a systematic offset for all objects indicates that the disagreement is not simply due to a uniform error in predicted radii at all masses and spectral types, but without directly measured radii, which would provide directly, it is impossible to distinguish whether evolutionary or atmospheric models are responsible for the observed discrepancies.
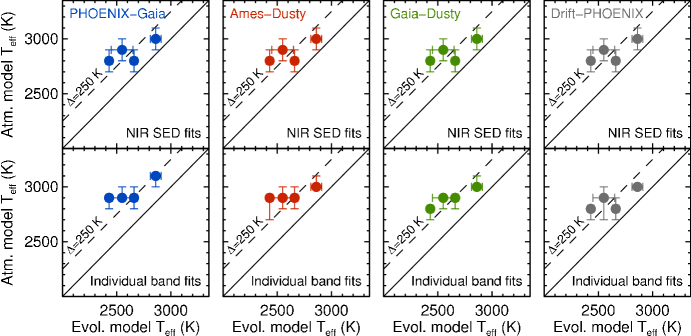
If we restrict our comparisons to a narrow range of temperatures, we can essentially remove one variable from the problem and focus on how the discrepancies vary with mass and age. To date, the largest subset of mass benchmarks at any given temperature are the late-M dwarfs (Table 1). We obtained integrated-light near-infrared spectroscopy of four nearly equal-flux late-M binaries with component mass determinations ranging from 0.06–0.10 (i.e., young brown dwarfs to old stars) and with a range of chromospheric activity levels (Dupuy et al. 2010). After fitting these spectra with four independent model atmosphere grids, we found that all best-fit temperatures were systematically 250 K warmer than the values derived from evolutionary models (Figure 2). Thus, the observed discrepancy is the same for objects with very similar spectra but with very different masses, ages, and activity levels, indicating that the model atmospheres are largely responsible for the observed discrepancy.
3 Testing Formation Models with Eccentricities
Some properties of very low-mass binaries, such as orbital semimajor axes, mass ratios, and multiplicity fractions, can be studied in a statistical fashion using a large sample without any knowledge of orbital motion (e.g., Allen 2007), and such studies have provided very important constraints on formation models at very low masses. However, only well-determined orbits can provide eccentricities (), which are directly related to the angular momentum of the formation process. In fact, the only two theoretical simulations that report eccentricities of very low-mass binaries predict very different types of orbits: (1) the cluster formation model of Bate (2009) yields a total of 16 binaries with typically modest eccentricities, and (2) the disk gravitational instability model of Stamatellos & Whitworth (2009) produces 12 binaries with typically high eccentricities (Figure 3).
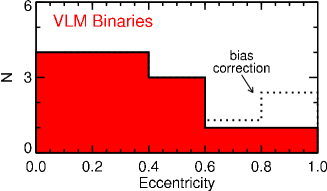
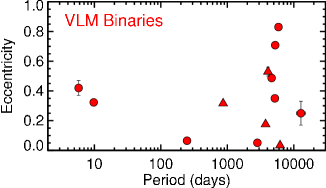
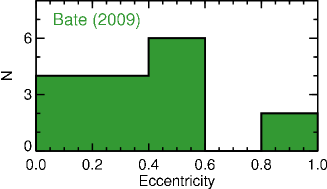
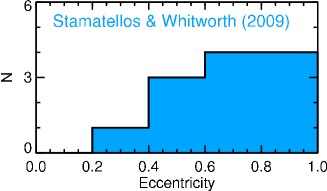
The sample of very low-mass binaries with well-determined orbits is now of comparable size to the binaries produced in theoretical simulations, and thus it can be used to try to discriminate between the very different model predictions. Figure 3 shows the eccentricity distribution for all very low-mass binaries with eccentricity uncertainties less than 0.1. This excludes the visual binary 2MASS J15342952AB (Table 1) and includes three spectroscopic binaries: PPl 15 (; Basri & Martín 1999), 2MASS J05350546 (; Stassun et al. 2006), and 2MASS J03200446 (; Blake et al. 2008). This sample populates a broad range in eccentricity from nearly circular to highly eccentric ( = 0.03–0.83) and shows a strong preference for modest eccentricities (, median of 0.32). The observed distribution of eccentricities is well-matched to that predicted by the cluster formation model of Bate (2009), although we note that this simulation is not in full agreement with observations as it produces much wider binaries than are observed in the field. In contrast, the gravitational instability model of Stamatellos & Whitworth (2009) produces too many high- binaries, with an absence of any modest eccentricity () orbits, which is highly inconsistent with the observed distribution.
References
- Aitken (1918) Aitken, R. G. 1918, The Binary Stars
- Allen (2007) Allen, P. R. 2007, ApJ, 668, 492
- Allers et al. (2007) Allers, K. N., Jaffe, D. T., Luhman, K. L., Liu, M. C., Wilson, J. C., Skrutskie, M. F., Nelson, M., Peterson, D. E., Smith, J. D., & Cushing, M. C. 2007, ApJ, 657, 511
- Ambartsumian (1937) Ambartsumian, V. A. 1937, Astron. Zhurn., 14, 207
- Baraffe et al. (2002) Baraffe, I., Chabrier, G., Allard, F., & Hauschildt, P. H. 2002, A&A, 382, 563
- Basri & Martín (1999) Basri, G., & Martín, E. L. 1999, AJ, 118, 2460
- Bate (2009) Bate, M. R. 2009, MNRAS, 392, 590
- Blake et al. (2008) Blake, C. H., Charbonneau, D., White, R. J., Torres, G., Marley, M. S., & Saumon, D. 2008, ApJ, 678, L125
- Bouy et al. (2003) Bouy, H., Brandner, W., Martín, E. L., Delfosse, X., Allard, F., & Basri, G. 2003, AJ, 126, 1526
- Bouy et al. (2004) Bouy, H., et al. 2004, A&A, 423, 341
- Burgasser et al. (2003) Burgasser, A. J., Kirkpatrick, J. D., Reid, I. N., Brown, M. E., Miskey, C. L., & Gizis, J. E. 2003, ApJ, 586, 512
- Burgasser et al. (1999) Burgasser, A. J., et al. 1999, ApJ, 522, L65
- Chabrier et al. (2007) Chabrier, G., Gallardo, J., & Baraffe, I. 2007, A&A, 472, L17
- Close et al. (2002) Close, L. M., Siegler, N., Potter, D., Brandner, W., & Liebert, J. 2002, ApJ, 567, L53
- Delfosse et al. (1999) Delfosse, X., et al. 1999, A&AS, 135, 41
- Dupuy et al. (2009a) Dupuy, T. J., Liu, M. C., & Bowler, B. P. 2009a, ApJ, 706, 328
- Dupuy et al. (2010) Dupuy, T. J., Liu, M. C., Bowler, B. P., & Cushing, M. C. 2010, ApJ, 721, 1725
- Dupuy et al. (2009b) Dupuy, T. J., Liu, M. C., & Ireland, M. J. 2009b, ApJ, 692, 729
- Dupuy et al. (2009c) — 2009c, ApJ, 699, 168
- Fabrycky & Murray-Clay (2010) Fabrycky, D. C., & Murray-Clay, R. A. 2010, ApJ, 710, 1408
- Gizis & Reid (2006) Gizis, J. E., & Reid, I. N. 2006, AJ, 131, 638
- Hawley et al. (2002) Hawley, S. L., et al. 2002, AJ, 123, 3409
- Jeans (1935) Jeans, J. H. 1935, Nat, 136, 432
- Konopacky et al. (2010) Konopacky, Q. M., Ghez, A. M., Barman, T. S., Rice, E. L., Bailey, J. I., White, R. J., McLean, I. S., & Duchêne, G. 2010, ApJ, 711, 1087
- Lane et al. (2001) Lane, B. F., Zapatero Osorio, M. R., Britton, M. C., Martín, E. L., & Kulkarni, S. R. 2001, ApJ, 560, 390
- Leinert et al. (2001) Leinert, C., Jahreiß, H., Woitas, J., Zucker, S., Mazeh, T., Eckart, A., & Köhler, R. 2001, A&A, 367, 183
- Liu et al. (2008) Liu, M. C., Dupuy, T. J., & Ireland, M. J. 2008, ApJ, 689, 436
- Liu & Leggett (2005) Liu, M. C., & Leggett, S. K. 2005, ApJ, 634, 616
- Lodieu et al. (2007) Lodieu, N., Dobbie, P. D., Deacon, N. R., Hodgkin, S. T., Hambly, N. C., & Jameson, R. F. 2007, MNRAS, 380, 712
- Mamajek & Hillenbrand (2008) Mamajek, E. E., & Hillenbrand, L. A. 2008, ApJ, 687, 1264
- Marley et al. (2007) Marley, M. S., Fortney, J. J., Hubickyj, O., Bodenheimer, P., & Lissauer, J. J. 2007, ApJ, 655, 541
- Marois et al. (2008) Marois, C., Macintosh, B., Barman, T., Zuckerman, B., Song, I., Patience, J., Lafrenière, D., & Doyon, R. 2008, Science, 322, 1348
- McGovern et al. (2004) McGovern, M. R., Kirkpatrick, J. D., McLean, I. S., Burgasser, A. J., Prato, L., & Lowrance, P. J. 2004, ApJ, 600, 1020
- Mullan & MacDonald (2010) Mullan, D. J., & MacDonald, J. 2010, ApJ, 713, 1249
- Reiners & Basri (2009) Reiners, A., & Basri, G. 2009, ApJ, 705, 1416
- Seifahrt et al. (2008) Seifahrt, A., Röll, T., Neuhäuser, R., Reiners, A., Kerber, F., Käufl, H. U., Siebenmorgen, R., & Smette, A. 2008, A&A, 484, 429
- Simon et al. (2006) Simon, M., Bender, C., & Prato, L. 2006, ApJ, 644, 1183
- Stamatellos & Whitworth (2009) Stamatellos, D., & Whitworth, A. P. 2009, MNRAS, 392, 413
- Stassun et al. (2006) Stassun, K. G., Mathieu, R. D., & Valenti, J. A. 2006, Nat, 440, 311
- Stauffer et al. (1998) Stauffer, J. R., Schultz, G., & Kirkpatrick, J. D. 1998, ApJ, 499, L199
- Zapatero Osorio et al. (2004) Zapatero Osorio, M. R., Lane, B. F., Pavlenko, Y., Martín, E. L., Britton, M., & Kulkarni, S. R. 2004, ApJ, 615, 958