at 7.5 pt
Published in PNAS 108, 3124–3129 (2011)
Dispensability of Escherichia coli ’s latent pathways
Abstract
Gene-knockout experiments on single-cell organisms have established that expression of a substantial fraction of genes is not needed for optimal growth. This problem acquired a new dimension with the recent discovery that environmental and genetic perturbations of the bacterium Escherichia coli are followed by the temporary activation of a large number of latent metabolic pathways, which suggests the hypothesis that temporarily activated reactions impact growth and hence facilitate adaptation in the presence of perturbations. Here we test this hypothesis computationally and find, surprisingly, that the availability of latent pathways consistently offers no growth advantage, and tends in fact to inhibit growth after genetic perturbations. This is shown to be true even for latent pathways with a known function in alternate conditions, thus extending the significance of this adverse effect beyond apparently nonessential genes. These findings raise the possibility that latent pathway activation is in fact derivative of another, potentially suboptimal, adaptive response.
keywords:
complex networks — flux balance analysis — metabolic networks — gene dispensability — synthetic rescuesLiving cells are surprisingly robust against mutations and, in particular, against gene knockouts [1, 2, 3, 4, 5]. The origin of mutational robustness—whether it is a directly evolved trait or a byproduct of evolutionary history—remains debatable [6]. In either case, metabolic network analysis shows that the nonessentiality of enzymes and associated genes is largely due to the inactivity of the corresponding metabolic reactions under laboratory conditions [7, 8, 9]. This leaves environmental robustness as the natural candidate to explain gene nonessentiality. Yet, apart from chemical stress-based assays [10], studies designed to test whether nonessential genes become essential under different conditions have failed to identify a phenotype for more than a small fraction of additional genes [11]. A recent groundbreaking study has shown, however, that a large fraction of reactions not active under standard laboratory conditions become transiently active after a genetic or environmental perturbation [12, 13]. Why? The prevailing interpretation has been that the transient activation of such latent pathways facilitates adaptation to new conditions, thereby attributing function to genes that have been classified as dispensable for the lack of phenotype in steady-state experiments. This is naturally formulated as the hypothesis that latent pathways have a positive impact on postperturbation growth (cellular reproduction), which is a measure of competitive advantage with a strong empirical basis [1, 2, 3, 10, 11, 13]. Even for genes with known functions under different conditions, this hypothesis is appealing as it suggests the possibility of an alternate phenotype that would not be detected in traditional high-throughput screens of knockout mutants [14].
Here we test this hypothesis using the most complete in silico reconstruction of the metabolic network of Escherichia coli K-12 MG1655 [15, 16] and perturbations caused by single-gene knockouts. The response of the metabolic network to knockout perturbations is modeled using both model-independent analysis and the two most accepted phenomenological approaches, minimization of metabolic adjustment (MOMA) [17] and regulatory on/off minimization (ROOM) [18] (Materials and Methods). Starting from a growth-maximizing state determined by flux balance analysis (FBA) [19], we compare the early postperturbation growth rate (Materials and Methods) of the original organism with that of a modified organism in which the latent reactions have been disabled. We consider glucose minimal medium and gene knockouts that necessarily change the original metabolic flux distribution but that nonetheless are compatible with nonzero growth according to FBA. There are 52 enzyme-coding genes associated with 97 metabolic reactions in the reconstructed network that satisfy this condition. We systematically predict the impact of latent pathway activation on growth rate following perturbations caused by the knockouts of each of these genes.
Results
Phenomenological analysis.
Figure 1 illustrates the essence of our approach. In an optimal growth state, as observed for E. coli after adaptive evolution in fixed environmental conditions [20], many metabolic reactions are inactive [8, 12]. Shortly after a perturbation, however, both the original and modified strain operate in a suboptimal growth state [17, 18], which we model using MOMA or ROOM (Fig. 1A). In silico [8] and laboratory [12] experiments show that this change is accompanied by a burst of reaction activity (Fig. 1B), reflecting regulatory changes that locally reroute fluxes in the short-term metabolic response to the perturbation [21, 22]. If the perturbation is nonlethal, the perturbed organisms will undergo adaptive evolution—adopting beneficial mutations over longer timescales [23, 24] to achieve a new optimal growth state, which can be predicted by FBA [25, 18].
For the perturbations considered in this study, the average and standard deviation of the number of transiently active reactions is and for MOMA and ROOM, respectively. This difference is expected since ROOM, by design, favors a small number of significant flux changes, which reflects the fact that ROOM may model a later stage in the adaptive response pictured in Fig. 1B than MOMA [18]. These numbers should be compared with the number of active reactions in the corresponding growth-maximizing states, which is in the wild type and remains on average in the knockout mutants, with an average of % overlap between the two sets for the simplex solutions we consider; these numbers are representative for other choices of optima [26, 27] within our models (Supporting Information, Sensitivity to Alternate Optima section). We emphasize that since the modified organism lacks only transiently active (latent) metabolic reactions, the optimal steady states are identical to those of the unmodified strain both before and after the perturbation. Our question is then whether the early postperturbation growth rate (before adaptive evolution) will be lower (red), remain equal (green), or become higher (blue) when these latent pathways are not present (Fig. 1A).
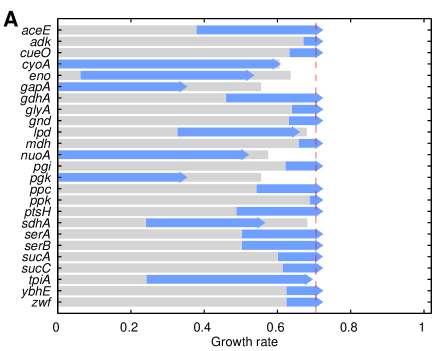
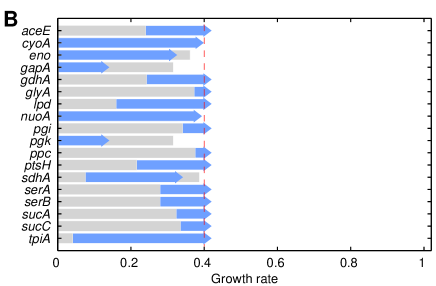
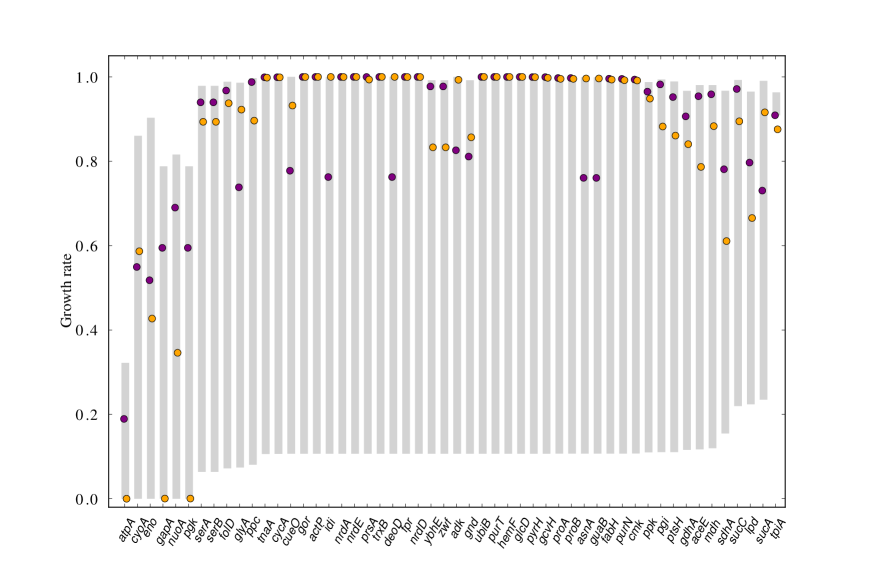
Our principal result is that the strains lacking latent pathways systematically show equal or better adaptation as determined by growth within our in silico model, regardless of the approach used to model the organisms’ response to perturbations. We assume that the organisms are in an optimal growth state both before and long after the perturbation, which accounts for cases that have received much attention in the literature [8, 12, 13], but we note that our conclusions remain equally valid when this assumption is relaxed (Supporting Information, Effects of Nonoptimal Reference States section). Table 1 summarizes the results for all 52 single-gene knockouts considered in our study. Relative to the unmodified strain in the suboptimal state following a gene knockout, the strain lacking the latent pathways exhibits equal or improved growth in 100% of the cases according to MOMA (Fig. 2 A) and in 98% of the cases according to ROOM (Fig. 2B). Across all knockout perturbations, this corresponds to an average change of % and % of the optimal wild-type growth rate, respectively. With either approach, a large fraction of mutants (50% for MOMA, 77% for ROOM) show a negligible difference in growth rate (within % of the wild-type growth rate) when the latent pathways are disabled. If only cases exhibiting significant changes are considered, the removal of latent pathways consistently increases the early postperturbation growth rate for all mutants, by an average of % for MOMA (Fig. 2A) and % for ROOM (Fig. 2B). Thus, for almost all knockouts, the strain lacking latent pathways is predicted to suffer no competitive disadvantage compared to the latent pathway-enabled strain. On the contrary, we predict that it more often shows improved growth in the suboptimal regime shortly after the perturbation.
| MOMA | ROOM | Random | |
|---|---|---|---|
| Latent reactions for individual perturbations: | |||
| All knockout perturbations | +8.5 (12.5)% | +1.2 (2.8)% | +70.0 (10.8)% |
| Significant differences\tablenoteBy more than 1% of the wild-type growth rate: 50% (MOMA), 23% (ROOM), and 100% (random) of the perturbations. | +16.9 (13.2)% | +4.6 (4.5)% | +70.0 (10.8)% |
| Number of reactions removed | 291 (83) | 120 (59) | 1,019 (5) |
| Simultaneously nonessential latent reactions: | |||
| All knockout perturbations | +7.4 (10.9)% | +1.2 (2.8)% | |
| Significant differences\tablenoteBy more than 1% of the wild-type growth rate: 50% (MOMA), and 19% (ROOM) of the perturbations. | +14.8 (11.4)% | +5.2 (4.6)% | |
| Number of reactions removed | 258 (79) | 109 (53) |
| Each column corresponds to the average (and standard deviation) of the difference in growth rate between the latent pathway-disabled and wild-type organisms for 52 different single-gene knockouts. The differences are expressed as percentages of the optimal wild-type growth rate. For all cases, the average postperturbation growth rate is higher for the strain without latent pathways. |
The set of transiently active (latent) reactions depends on the perturbation. Even though we predict that in general, the removal of one of these 52 sets increases growth under the corresponding knockout, the same removal may in principle have an adverse effect under a different knockout. To address this possibility, we first note that the sets of simultaneously nonessential latent reactions remain sizeable: an average of 258 79 for MOMA and 109 53 for ROOM. For a given knockout perturbation, this set is defined as the subset of the original latent reactions that are inactive in the optimal growth state we consider for each of the other 51 knockout mutants. These reactions are therefore dispensable for optimal growth, both in the wild type and all 52 single gene knockout strains we consider, but are nonetheless transiently activated in response to the given perturbation. We have tested the impact of disabling these reduced sets of latent reactions under the corresponding knockouts (Materials and Methods). As shown in Fig. 2 C and D, the presence of these simultaneously nonessential latent reactions has the same trend of inhibiting growth adaptation as found for the full sets of transiently activated reactions.
The possibility that latent pathway activation enhances cells’ viability following a perturbation is a compelling hypothesis, as it would reveal functions for genes that have thus far eluded high-throughput phenotype screens. We note, however, that our analysis also predicts the transient activation of pathways that do, in fact, have known phenotypes under different conditions. For example, activation of the glyoxylate shunt is known to mitigate growth defects of E. coli on glucose following phosphofructokinase mutations [28]. Since we focus on single knockouts, the genes affected by such mutations, pfkA and pfkB, are not among the perturbations we consider. Nonetheless, out of the 52 unrelated knockout perturbations in our study, our models show the transient activation of the glyoxylate shunt in response to 25 of them according to MOMA and 7 according to ROOM. The same phenomenon can be observed for reactions that are essential under different environmental conditions but inactive in the aerobic glucose medium employed in our simulations. Pyruvate formate lyase is required for anaerobic growth in xylose medium according to experiments [29] and our models, but is transiently active for 2 (MOMA) and 18 (ROOM) of the 52 genetic perturbations in this study. This interesting effect—the nonspecific use of pathways under an array of perturbations quite different from the conditions under which they have an observed phenotype—indicates that the phenomenon of latent pathway activation extends beyond the set of apparently nonessential genes.
Model-independent analysis.
The analysis above shows that the availability of latent pathways inhibits growth in the short term after a genetic perturbation. But how sensitive are these conclusions to the models we used to simulate the response of the network? To provide model-independent evidence, we have determined how the volume of the space of feasible metabolic states (Materials and Methods) depends on the growth rate. As shown in Fig. 3 A and B (green lines) for the cyoA and lpd knockout mutants, the volume systematically decreases as a function of growth rate for the single-gene knockout mutants considered in our study, indicating that the number of metabolic states available to the unevolved mutant is much larger at lower growth rates. When the latent reactions are disabled, however, the relative volume, and hence the relative number of available metabolic states, increases for large growth rates (Fig. 3 A and B; blue lines). Therefore, the principal effect of removing latent pathways appears to be an increase in the relative frequency of high-growth states due to the preferential elimination of low-growth states. It should be noted, however, that a large number of high-growth states are also disabled in this process due to the “entanglement” between latent pathways and biomass-producing pathways that exist under the metabolic steady-state conditions of our models (Supporting Information, Elementary Mode Analysis section).
To appreciate the constraints imposed by this structure, imagine that the organism responds to perturbations by moving to a random metabolic state in the feasible space of fluxes. We simulated this hypothetical response using an implementation of the hit-and-run sampling algorithm (Materials and Methods). As shown in Fig. 3C, the postperturbation growth rate is nearly zero for all mutants with latent pathways and close to the theoretical maximum for all mutants without them. This random response is arguably a lower bound for the actual response of organisms that have evolved to cope with perturbations, but the conclusion is clear: unless we assume that organisms have evolved to respond to perturbations in a highly specific manner, which appears to be inconsistent with experiments [30], the availability of latent pathways does not facilitate growth, and this prediction is largely independent of the network response to perturbation. This holds true in particular for MOMA and ROOM, which incorporate (in different ways) the main flux rerouting features observed in the activation of latent pathways in E. coli [12].
Further mechanistic insight comes from the recently identified synthetic rescue interactions [31], in which the knockout of a gene inhibits growth but, counterintuitively, the targeted concurrent knockout of additional genes recovers the ability of the organisms to grow. The reactions catalyzed by such rescue genes are predicted to be active in typical suboptimal states and inactive in growth-maximizing states of the knockout mutant [8, 31]. Now, given the observation above that the set of active reactions predicted by FBA is only slightly modified by a gene knockout, it follows that most rescue genes are in fact associated with latent pathways. This in turn explains why the latent pathway-disabled strains show improved growth. Note that this argument cannot be anticipated from intuition, because an enormous number of low-growth states (up to several orders of magnitude larger than for near-optimal growth) may exist even when latent pathways are disabled (Fig. 3 A and B). Furthermore, even in the extreme case when one disables all reactions that are inactive in the optimal state of the knockout mutant, metabolic states with a very low growth rate ( 10% or less of the wild-type optimum) exist in 47 out of the 52 mutants (Supporting Information, Elementary Mode Analysis section). This threshold is significant since all but 5 unmodified knockout mutants exceed this growth rate according to MOMA, and all but 1 according to ROOM. Thus, although our model-independent analysis suggests that latent pathway activation inhibits growth under a general choice of metabolic state after a perturbation, this is not directly imposed by the geometry of the solution space. Rather, the predicted growth benefit associated with latent pathway removal and synthetic rescues is partly a reflection of the cells’ adaptive response.
An extreme example of this rescue effect is provided by the cyoA-deficient mutant, which is predicted by MOMA to drop to 10% of the optimal wild-type growth rate following the perturbation, but recovers to 60% if the latent pathways are also disabled. In addition, cases in which the single-gene knockout mutant operates near the theoretical optimum but growth nonetheless improves upon the removal of latent pathways, such as for the folD mutant, can be related to weaker forms of synthetic rescues [31].
This surprising relation to synthetic rescues is particularly interesting when we note that latent reactions define several pathways whose participation in E. coli’s metabolism has been controversial or elusive. The Entner-Doudoroff (ED) pathway, an alternative to glycolysis for glucose catabolism, is inactive in wild-type E. coli according to in vivo experiments in glucose [32] but becomes transiently active in mutants lacking phosphoglucose isomerase [12]. This activation may serve to reduce NADPH accumulation accompanying increased flux through the pentose phosphate pathway [33]. Both MOMA and ROOM predict a small, transient flux through the ED pathway in response to the knockout of pgi, the gene coding phosphoglucose isomerase. In triphosphate isomerase-deficient strains, our model predicts the activation of the normally inactive methylglyoxal bypass [34]. Experimentally, this pathway is observed to channel excess dihydroxyacetone phosphate (DHAP) into pyruvate following glycolytic flux splitting into glyceraldehyde 3-phosphate and DHAP after the knockout of the associated gene, tpi [12]. These findings emphasize the importance of probing multiple gene knockouts or perturbations—previously suggested in the context of synthetic lethality [35], synthetic rescues [31, 36], multi-target drug discovery [37, 36], and neutral mutations [38]—as a means to determine the puzzling role of transients.
Discussion
Latent pathways and their associated genes are, by definition, dispensable for optimal growth under the given conditions both before and after a perturbation. Several explanations have been offered to justify the persistence of apparently nonessential metabolic genes within the genome. Environmental robustness is the most natural hypothesis, as it acknowledges the unpredictable, time-varying conditions that confront single-cell organisms in natural environments. Yet, in silico [7, 39] and experimental [11] studies of model organisms under various environmental conditions likely to occur in nature suggest that condition-dependent robustness is inadequate to fully explain the dispensability of metabolic genes. Part of the remaining redundancy may be attributed to the varying efficiencies of redundant pathways under different environments [40], or selective pressure for increased metabolic capacity across all conditions [39]. An alternative to environmental robustness is genetic robustness, in which redundant pathways buffer against null mutations [41, 42]. But regardless of which explanation might apply in the context of latent pathways, the question that follows from our analysis is not why these dispensable pathways are present in the genome, but rather what causes their transient activation in response to genetic perturbations. Our results indicate that this activation confers no advantage in fitness as measured by growth, and more often hinders growth in the short term following a perturbation.
The dispensability of latent pathway activation predicted in this study can be interpreted in three different ways, which are not necessarily mutually exclusive. First, it is possible that temporary reaction activation does not provide necessary intermediate states but is instead a byproduct of the network’s suboptimal response to perturbations. The fact that E. coli undergoes a period of suboptimal growth following genetic perturbations is well-established in both in silico and in vivo experiments [17, 18]. This interpretation is thus supported by the recent observation that typical suboptimal metabolic states have a much larger number of active reactions (more than times larger for the conditions considered here) than typical states that optimize growth [8].
A second interpretation is that cells activate a large number of reactions as a global nonspecific response to perturbations that nevertheless creates a library of possible metabolic states that can be subsequently fine-tuned by adaptive evolution. This scenario cannot be rejected by existing experimental results [30] and is appealing as it allows for an indirect, long-term benefit of temporary reaction activation even if, as predicted here, this activation inhibits growth in the short term. Although whole-cell regulation remains largely unexplained, there are known mechanisms that could subsequently lead to optimal growth [43, 44]. This interpretation suggests that fine-tuning of whole-cell reaction activity is best achieved by down-regulating specific over-expressed reactions rather than by the coordinated up-regulation of entire under-expressed pathways, a principle that is widely appreciated in metabolic engineering but that is yet to be demonstrated for natural systems. The recent observation that E. coli’s response to perturbations is more stable from the view point of metabolite concentration and protein or mRNA abundance [45] than reaction flux [12] may be relevant for the validation of this interpretation. The objection to the second interpretation is that it cannot explain (not even in the long term) the availability of pathways that are simultaneously dispensable for all known perturbations that have shaped the evolution of the organisms. This “paradox of latency” reinforces the need to study the mechanisms that govern latent pathway activation.
In experimental studies of gene function in microbial organisms, growth is the most often used indicator of fitness, owing to both its accessibility for measurement and its intrinsic importance in determining viability [1, 2, 3, 46]. Although the results of this study suggest that the availability of latent pathways does not promote faster growth following a perturbation, the conclusion that this negatively impacts adaptation is reached by studying these pathways in the context of metabolism alone. Thus, a third interpretation is that, in general, the cellular objective invoked in the adaptive response is not growth. Instead, the activation of otherwise latent metabolic pathways may accompany other cellular processes, either inside or outside metabolism, that are initiated to ensure survival. For example, yeast adopts changes in cell shape and internal pressure in response to osmotic shock, a process that recruits the metabolism to accumulate specific metabolites [47]. Moreover, enzymes and metabolic cofactors involved in transiently upregulated pathways may have regulatory or signaling roles in addition to their metabolic function [48]. This third possibility allows for an advantageous, external function for pathways whose activation appears disadvantageous when only the metabolism is considered. In this way, latent pathway activation is incorporated into a larger, more sophisticated adaptive response. This explanation, however, seems inconsistent with our observation of the apparently highly nonspecific activation of pathways in response to different perturbations.
Regardless of which interpretation proves to be correct, this study leads to a clear, experimentally testable prediction: that latent pathway activation does not enhance, and in fact often inhibits, early postperturbation growth. While we expect this behavior to be observed experimentally under a wide range of conditions, regardless of the specific suboptimal response of the cell, deviations from this behavior would also be highly informative since they would uncover growth phenotypes not detected in previous steady-state experiments. Varying environments can also generate strong [45] and sometimes counterintuitive responses, such as the possibility of accelerating the evolution of unevolved strains [49]. Therefore, it may well be the case that in time-varying environments, which are beyond current modeling capability, latent pathway activation will exhibit a different fitness effect.
1 Network and perturbations
We used the iAF1260 E. coli model [15], which is the most up-to-date reconstruction of the metabolic network of E. coli MG1655. The network consists of 2,082 unique reactions catalyzed by 1,260 genes and involves 1,369 metabolites, as well as 299 exchange fluxes and the biomass flux. We focused on the 52 single-gene knockout strains that are compatible with growth but for which the original growth-maximizing flux state becomes infeasible after the gene knockout. The volume calculation, which remains challenging for the full network, was performed using a reduced network consisting of 62 reactions, 101 genes, 49 metabolites, and 14 exchange fluxes representing the central metabolism of E. coli [50].
2 Medium and constraints
The simulated medium consisted of limited amount of glucose (8 mmol/g DW-h) and oxygen (18.5 mmol/g DW-h), and unlimited amount of carbon dioxide, iron (II), protons, water, potassium, sodium, ammonia, phosphate, and sulfate. Irreversible reactions are constrained to have nonnegative fluxes. The flux through the ATP maintenance reaction was set to 8.39 mmol/g DW-h. A total of 1,432 reactions in the iAF1260 model, including 61 reactions in the subnetwork of the central metabolism, can be active under these medium conditions. An analysis of the effect of regulatory limitations [51] that may constrain this reaction activity in vivo is considered in the Supporting Information (Regulatory Constraints section). There it is shown that our results remain valid under the additional constraints imposed by these limitations.
3 Feasible metabolic states
The state of the metabolic network is represented by a vector of all reaction fluxes . Since the time scale at which the network responds to perturbations is much shorter than the characteristic time for adaptive evolution, we focused on steady-state flux distributions both before and after perturbation. Steady-state fluxes are solutions of the mass-balance equation , where is the matrix of stoichiometric coefficients, under the constraint imposed by the medium, reaction irreversibility, ATP maintenance requirements, and possibly gene knockouts. A knockout of the enzyme-coding genes associated with reaction is implemented through the additional constraint . The solution space is the set of all such steady-state flux vectors and it has the form of a convex polytope. We refer to the individual solutions in this space as feasible metabolic states.
4 Objective functions
FBA [19] identifies a growth-maximizing state within the space of feasible metabolic states by maximizing the flux through a biomass reaction that drains biomass precursors. With respect to this original state, MOMA [17] and ROOM [18] identify feasible states that minimize the distance in the space of fluxes and the number of significant flux changes, respectively (Supporting Information, sections 2-3). Our implementations of FBA, MOMA, ROOM, and the hit-and-run algorithm used a commercial optimization package (ILOG CPLEX, version 11.0, www.ilog.com). For all FBA results, we have used the growth-maximizing states provided by the simplex algorithm. More information about the computational methods is provided in Supporting Information, where it is also shown that our results do not depend sensitively on the assumption of optimal growth in the reference states either before or after the perturbation (Effects of Nonoptimal Reference States), nor on particular choices for the growth-maximizing states used throughout the paper (Sensitivity to Alternate Optima).
5 Biomass flux and growth rates
The in silico model predicts the biomass flux, but for exponential growth the result can be expressed in terms of a normalized growth rate . This follows from the observation that biomass production is governed by , where is the growth rate, measures the population size, and is proportional to the biomass flux . Therefore, when normalized with respect to the wild-type or theoretical maximum, the normalized biomass flux equals the corresponding normalized growth rate used throughout the paper.
6 Identification of latent pathways
We define the latent reactions (pathways) associated with the knockout of gene to be the set of all reactions predicted to be transiently active in the unevolved mutant shortly after the perturbation (according to MOMA, ROOM, or the hit-and-run algorithm), but inactive in both the optimal wild-type and mutant strains (according to FBA). This set is therefore nonessential for optimal growth under the knockout of , although in principle some of these reactions may be necessary for growth under the knockout of a different gene, . To account for this, we tested the impact of a set of latent reactions that are simultaneously nonessential in the optimal growth states of the other 51 single-gene knockout mutants that we consider.
7 Volume calculation
The exact calculation of the volume of the (high-dimensional) solution space is computationally intractable and, because this set is very skewed [52], even approximate calculations are computationally demanding. To determine the volume of the solution space as a function of growth rate, we used an approximate inference algorithm based on Belief Propagation [53]. In this approach, the convex polytope representing the constrained flux space is tiled with hypercubes of size . We then use a message-passing algorithm to approximate the probability distribution over the discretized space. Using this, we define the associated entropy , which counts the log of the number of -hypercubes that overlap the space of feasible states. The total volume covered by these cubes is then , where is the dimension of the space. If is the number of linearly independent mass balance constraints and is the number of available fluxes after a given knockout, then the dimension of the unmodified metabolic space is while the solution space for the modified organism has dimension , where is the number of independent latent reactions removed. We used a granularity of for all calculations presented in the paper.
8 Hit-and-run algorithm
To randomly sample the metabolic solution space, we implemented a hit-and-run algorithm [54] with artificial centering [55], which is a quickly converging sampler for high-dimensional convex sets. The algorithm is based on selecting a randomly oriented line passing through the current sample point, and then selecting the point for the next iteration from a uniform distribution along . For efficient sampling, we employed artificial centering [55], where the orientation of the line is obtained from the direction defined by the current sample point and the center (mean) of a subset of already-sampled points. The subset was initially created by taking 10,000 warm-up points on the boundary of the space, and was updated recursively by replacing a randomly selected point of with the currently sampled point. In all calculations presented in the paper, we generated a set of 5 x 10 points to sample the solution space. All calculations were performed with the COBRA Toolbox [56].
Acknowledgements.
This work was supported by the National Science Foundation under Grant DMS-0709212, the National Cancer Institute under Grant 1U54CA143869-01, and a Sloan Research Fellowship to A.E.M.8.1 Author contributions
S.P.C. and A.E.M. designed research; S.P.C. and J.S.L. performed research; S.P.C. and J.S.L. analyzed data; and S.P.C. and A.E.M. wrote the paper.
8.2 Conflict of interest statement
The authors declare no conflict of interest.
References
- [1] Baba T, et al. (2006) Construction of Escherichia coli K-12 in-frame, single-gene knockout mutants: the Keio collection. Mol Syst Biol 2:2006.0008.
- [2] Gerdes SY, et al. (2003) Experimental determination and system level analysis of essential genes in Escherichia coli MG1655. J Bacteriol 185:5673–5684.
- [3] Giaever G, et al. (2002) Functional profiling of the Saccharomyces cerevisiae genome. Nature 418:387–391.
- [4] DeLuna A, et al. (2008) Exposing the fitness contribution of duplicated genes. Nat Genet 40:676–681.
- [5] D’Elia MA, Pereira MP, Brown ED (2009) Are essential genes really essential? Trends Microbiol. 10:433–438.
- [6] Kupiec M, Sharan R, Ruppin E (2007) Genetic interactions in yeast: is robustness going bust? Mol Syst Biol 3:97.
- [7] Papp B, Pál C, Hurst LD (2004) Metabolic network analysis of the causes and evolution of enzyme dispensability in yeast. Nature 429:661–664.
- [8] Nishikawa T, Gulbahce N, Motter AE (2008) Spontaneous reaction silencing in metabolic optimization. PLoS Comp Biol 4:e1000236.
- [9] Blank LM, Kuepfer L, Sauer U (2005) Large-scale 13C-flux analysis reveals mechanistic principles of metabolic network robustness to null mutations in yeast. Genome Biol 6:R49.
- [10] Hillenmeyer ME, et al. (2008) The chemical genomic portrait of yeast: uncovering a phenotype for all genes. Science 320:362–365.
- [11] Harrison R, Papp B, Pál C, Oliver SG, Delneri D (2007) Plasticity of genetic interactions in metabolic networks of yeast. Proc Natl Acad Sci USA 104:2307–2312.
- [12] Fong SS, Nanchen A, Palsson BØ, Sauer U (2006) Latent pathway activation and increased pathway capacity enable Escherichia coli adaptation to loss of key metabolic enzymes. J Biol Chem 281:8024–8033.
- [13] Fong SS, Joyce AR, Palsson BØ (2005) Parallel adaptive evolution cultures of Escherichia coli lead to convergent growth phenotypes with different gene expression states. Genome Res 15:1365–1372
- [14] Ito M, Baba T, Mori H (2005) Functional analysis of 1440 Escherichia coli genes using the combination of knock-out library and phenotype microarrays. Metab Eng 7:318–327.
- [15] Feist AM, et al. (2007) A genome-scale metabolic reconstruction for Escherichia coli K-12 MG1655 that accounts for 1260 ORFs and thermodynamic information. Mol Syst Biol 3:121.
- [16] Feist AM, Palsson BØ (2008) The growing scope of applications of genome-scale metabolic reconstructions using Escherichia coli. Nat Biotech 26:659–667.
- [17] Segre D, Vitkup D, Church GM (2002) Analysis of optimality in natural and perturbed metabolic networks. Proc Natl Acad Sci USA 99:15112–15117.
- [18] Shlomi T, Berkman O, Ruppin E (2005) Regulatory on/off minimization of metabolic flux changes after genetic perturbations. Proc Natl Acad Sci USA 102:7695–7700.
- [19] Edwards JS, Palsson BØ (2000) The Escherichia coli MG1655 in silico metabolic genotype: its definition, characteristics, and capabilities. Proc Natl Acad Sci USA 97:5528–5533.
- [20] Ibarra RU, Edwards JS, Palsson BØ (2002) Escherichia coli K-12 undergoes adaptive evolution to achieve in silico predicted optimal growth. Nature 420:186–189.
- [21] Emmerling M, et al. (2002) Metabolic flux responses to pyruvate kinase knockout in Escherichia coli. J Bacteriol 184:152–164.
- [22] Huang Q, Yang C, Baba T, Mori H, Shimizu K (2003) Responses of the central metabolism in Escherichia coli to phosphoglucose isomerase and glucose-6-phosphate dehydrogenase knockouts. J Bacteriol 185:7053–7067.
- [23] Herring CD et al. (2006) Comparative genome sequencing of Escherichia coli allows observation of bacterial evolution on a laboratory timescale. Nat Genet 38:1406–1412.
- [24] Lee DH, Palsson BØ (2010) Adaptive evolution of Escherichia coli K-12 MG1655 during growth on a nonnative carbon source, L-1,2-propanediol. Appl Environ Microbiol 76:4158–4168.
- [25] Fong SS, Palsson BØ (2004) Metabolic gene-deletion strains of Escherichia coli evolve to computationally predicted growth phenotypes. Nat Genet 36:1056–1058.
- [26] Mahadevan R, Schilling CH (2003) The effects of alternate optimal solutions in constraint-based genome-scale metabolic models. Metab Eng 5:264–276.
- [27] Reed JL, Palsson BØ (2004) Genome-scale in silico models of E. coli have multiple equivalent phenotypic states: assessment of correlated reaction subsets that comprise network states. Genome Res 14:1797–1805.
- [28] Vinopal RT, Fraenkel DG (1974) Phenotypic suppression of phosphofructokinase mutations in Escherichia coli by constitutive expression of the glyoxylate shunt. J Bacteriol 118:1090–1100.
- [29] Hasona A, Kim Y, Healy FG, Ingram LO, Shangmugam KT (2004) Pyruvate formate lyase and acetate kinase are essential for anaerobic growth of Escherichia coli on xylose. J Bacteriol 186: 7593-7600.
- [30] Stern S, Dror T, Stolovicki E, Brenner N, Braun E (2007) Genome-wide transcriptional plasticity underlies cellular adaptation to novel challenge. Mol Syst Biol 3:106.
- [31] Motter AE, Gulbahce N, Almaas E, Barabási AL (2008) Predicting synthetic rescues in metabolic networks. Mol Syst Biol 4:168.
- [32] Flores S, Gosset G, Flores N, de Graaf AA, Bolívar F (2002) Analysis of carbon metabolism in Escherichia coli strains with an inactive phosphotransferase system by 13C labeling and NMR spectroscopy. Metab Eng 4:124–137.
- [33] Hua Q, Yang C, Baba T, Mori H, Shimizu K (2003) Responses of the central metabolism in Escherichia coli to phosphoglucose isomerase and Glucose-6-Phosphate dehydrogenase knockouts. J Bacteriol 185:7053–7067.
- [34] Ferguson GP, Tötemeyer S, MacLean MJ, Booth IR (1998) Methylglyoxal production in bacteria: suicide or survival? Arch Microbiol 170:209–218.
- [35] Deutscher D, Meilijson I, Kupiec M, Ruppin E (2006) Multiple knockout analysis of genetic robustness in the yeast metabolic network. Nat Genet 38:993–998.
- [36] Motter AE (2010) Improved network performance via antagonism: From synthetic rescues to multi-drug combinations. BioEssays 32:236–245.
- [37] Hopkins AL (2008) Network pharmacology: the next paradigm in drug discovery. Nat Chem Biol 4:682–690.
- [38] Wagner A (2008) Neutralism and selectionism: a network-based reconciliation. Nat Rev Genet 9:965–974.
- [39] Freilich S et al. (2010) Decoupling environment-dependent and independent genetic robustness across bacterial species. PLoS Comp Biol 6:e1000690.
- [40] Wang Z, Zhang J (2009) Abundant indispensable redundancies in cellular metabolic networks. Genome Biol Evol 1:23–33.
- [41] Barabasi AL, Oltvai Z (2004) Network biology: understanding the cell’s functional organization. Nat Rev Genet 5:101–113.
- [42] Gu Z et al. (2003) Role of duplicate genes in genetic robustness against null mutations. Nature 421:63–66.
- [43] Goyal S, Yuan J, Chen T, Rabinowitz JD, Wingreen NS (2010) Achieving optimal growth through product feedback inhibition in metabolism. PLoS Comp Biol 6:e1000802.
- [44] Pelosi L, et al. (2006) Parallel changes in global protein profiles during long-term experimental evolution in Escherichia coli. Genetics 173:1851–1869.
- [45] Ishii N, et al. (2007) Multiple high-throughput analyses monitor the response of E. coli to perturbations. Science 316:593–597.
- [46] Typas, A et al. (2006) High-throughput, quantitative analyses of genetic interactions in E. coli. Nat Methods 5:781–787.
- [47] Klipp E, Nordlander B, Krüger R, Gennemark P, Hohmann S (2005) Integrative model of the response of yeast to osmotic shock. Nat Biotechnol 23:975–982
- [48] Shi Y, Shi Y (2004) Metabolic enzymes and coenzymes in transcription – a direct link between metabolism and transcription? Trends Genet 20:445-452.
- [49] Kashtan N, Noor E, Alon U (2007) Varying environments can speed up evolution. Proc Natl Acad Sci USA 104:13711–13716.
- [50] Reed JL, Vo TD, Schilling CH, Palsson BØ (2003) An expanded genome-scale model of Escherichia coli K-12 (iJR904 GSM/GPR). Genome Biol 4:R54.
- [51] Covert MW, Knight EM, Reed JL, Herrgard MJ, Palsson BØ (2004) Integrating high-throughput and computational data elucidates bacterial networks. Nature 429:92–96.
- [52] Bianconi, G (2008) Flux distribution of metabolic networks close to optimal biomass production. Phys Rev E 78:035101.
- [53] Braunstein A, Mulet R, Pagnani A (2008) Estimating the size of the solution space of metabolic networks. BMC Bioinformatics 9:240.
- [54] Smith RL (1984) Efficient Monte Carlo procedures for generating points uniformly distributed over bounded regions. Oper Res 32:1296–1308.
- [55] Kaufman DE, Smith RL (1998) Direction choice for accelerated convergence in hit-and-run sampling. Oper Res 46:84–95.
- [56] Becker SD, et al. (2007) Quantitative prediction of cellular metabolism with constraint-based models: The COBRA Toolbox. Nat Protoc 2:727–738.
Supporting Information
A metabolic network of metabolites and reactions is represented by a matrix , where is the stoichiometric coefficient of metabolite i in reaction . The state of the metabolic network is represented by a vector of reaction fluxes , where is the flux through reaction . In our analysis, the steady-state solutions of the system are determined by mass balance constraints,
| (S1) |
and additional constraints that limit the range of the individual fluxes,
| (S2) |
where the inequalities in this notation are assumed to apply to each component
individually. The bounds on individual fluxes are determined by substrate
availability in the given medium, the ATP maintenance requirement, and
thermodynamic constraints that limit the reversibility of the corresponding
reaction. The knockout of the genes associated with enzymes catalyzing reaction
corresponds to the additional constraint . The exchange fluxes
and the biomass flux are excluded from our implementation of the MOMA and ROOM
objective functions.
Flux Balance Analysis (FBA). FBA [1] is used to identify flux vectors satisfying (S1) and (S2) that maximize biomass production, which is represented by an additional reaction that drains biomass components. The problem is implemented as a linear program:
| max | (S3) | ||||
| s.t. | |||||
In general, the FBA solution is not unique, and the results in this paper were
obtained by selecting the optimal solution provided by the simplex algorithm.
For a discussion of the effects of choosing alternate FBA solutions, see
Sensitivity to Alternate Optima below.
Minimization of Metabolic Adjustment (MOMA). MOMA [2] selects a suboptimal growth state by minimizing the Euclidean distance in flux space from the wild-type optimal growth state, . This is implemented as a quadratic programming problem:
| min | (S4) | ||||
| s.t. | |||||
where is the set of indices corresponding to reactions deactivated by gene
knockouts.
Regulatory On/Off Minimization (ROOM). Unlike MOMA, which favors a potentially large number of small-magnitude flux changes, ROOM [3] chooses a suboptimal growth solution with a minimal number of “significant” flux changes from the original state. This is usually implemented as a mixed-integer programming problem (integer ROOM):
| min | (S5) | ||||
| s.t. | |||||
where and are as for MOMA, and and express tolerances for relative and absolute change from the original state, respectively.
In our numerical experiments we chose to use a linear programming variant of the method (linear ROOM) obtained by allowing the above binary constraints to be continuous in the interval and setting . Linear ROOM is biologically well-motivated, given that gene activity is best described by a continuous variable, and has the advantage of being computationally inexpensive for all mutants. Table S1 shows a comparison of the growth impacts predicted by integer ROOM and the linear variant upon latent pathway removal. For most mutants, the two methods show similar change in growth rate (increase, decrease, or an insignificant change) when the latent pathways are removed, even though the exact growth rate predictions may differ.
For the integer variant, we followed Shlomi et al.
[3] in choosing the values and
, which yielded reasonable running times for most knockout
strains. Even for larger values of these tolerances values there are a handful
of cases for which no optimal solution is found in any reasonable amount of
time. For these cases, in the comparison of Table S1, we take the best solution
found after one hour of computation on a 3.4 GHz CPU. The integer ROOM solutions
were further constrained to minimize the aggregate flux change from the
wild-type optimal state, .
Sensitivity to Alternate Optima. In general, the optimal flux distribution given by FBA is not unique, neither before nor after a given gene knockout [4, 5]. The implications of this nonuniqueness must be considered for two reasons. First, the set of transiently active reactions is defined with respect to the exact optimal flux distribution before and after the knockout perturbation, as well as the suboptimal flux distribution after the perturbation (see Effects of Nonoptimal Reference States below for an analysis of the effects of choosing suboptimal reference states in this definition of latent pathways). Second, the postperturbation flux distribution is itself dependent on a particular choice for the original optimal state, since both MOMA and ROOM operate by minimizing some distance to a reference flux state.
To test the sensitivity of our results to a particular choice of FBA solutions,
we repeated our simulations for numerous combinations of wild-type and optimal
mutant flux distributions. We sampled the available FBA-predicted states by
fixing the corresponding growth rate (either wild type or optimal mutant) and
maximizing or minimizing each of the reaction fluxes allowed to vary under this
additional constraint. After choosing a particular pair of optimal flux
distributions in this way, we determined the corresponding set of latent
pathways according to MOMA and ROOM, and the associated suboptimal growth rates
before and after the removal of these latent pathways. Figure S1 shows
the results of this analysis for the ppk- and tpiA-knockout
perturbations. The distributions of growth rate predictions for the strains with
(green) and without (blue) latent pathways do not overlap. A less extensive
sampling for each of the other 50 knockout mutants considered in our study
shows similar behavior. Altogether, these results suggest that our predictions
about the growth effect of latent pathway availability are robust with respect
to alternate optimal flux distributions.
Regulatory Constraints. All results for the full E. coli iAF1260 model presented in the main text were computed under the uptake and steady-state constraints listed in the Materials and Methods section. These constraints do not take into account regulatory effects, which may limit the set of genes that can be transcribed under the nutrient conditions we consider. Regulatory effects are thus expected to constrain the set of steady-state metabolic states predicted by FBA, MOMA, and ROOM that can actually be realized in vivo [7]. To address the possible impact of regulatory constraints on our predictions, we have repeated all calculations in the paper for a modified version of the iAF1260 model, following Feist et al. [8] in disabling a set of 152 reactions beforehand. There is evidence that, due to regulatory constraints, these reactions are inactive in the aerobic glucose conditions we simulate. Under these additional constraints, there are 46 single-gene knockouts that change the original flux distribution but nonetheless allow nonzero growth in the resulting knockout mutants according to FBA, which is the same criterion we used to select knockout perturbations in the main text for the unmodified iAF1260 model.
Table S2 summarizes the predicted growth impact of disabling latent pathways in
the modified iAF1260 model. Regardless of the approach used to simulate the
response (MOMA, ROOM, or hit-and-run sampling), all 46 knockout mutants in this
model show nearly equal (within % of the wild type) or improved growth
in the short term following the perturbation when the latent pathways are
disabled. Moreover, the average growth increases and the numbers of transiently
activated reactions are comparable to those presented in Table 1 of the main text for the
unmodified iAF1260 model. Our results are therefore not dependent on having
the full complement of metabolic reactions in the network available for
activation in the organisms’ initial response to perturbations. Indeed, the
predicted adverse growth effect of latent pathway activation is expected to hold
even under additional constraints that may reflect other limitations of the
metabolic response in vivo.
Effects of Nonoptimal Reference States. The phenomenological models used in the main text predict a suboptimal metabolic state by minimizing the value of a distance metric with respect to the preperturbation reference state, which is assumed to be growth-maximizing as predicted by FBA. The postperturbation reference state was also assumed to be growth-maximizing after adaptive evolution. These simplifications overlook the possibility that in many natural environments the metabolic state may be nonoptimal even before and long after an external perturbation. This situation could arise, for example, under time-varying conditions, where environmental changes prevent the organisms from approaching optimal growth states. In this case, some of the pathways we have classified as latent may fail to qualify in vivo since they carry nonzero flux in one or both of the reference states.
Geometrically, this scenario corresponds to the appropriate (nonoptimal) reference states lying in the interior of the feasible metabolic solution space, where many more reactions are active, as opposed to the boundary of the space, where reaction activity is limited by irreversibility constraints [9]. This situation can be accommodated with a variant of our modeling approach. We have systematically tested the growth impact of reaction upregulation relative to nonoptimal reference states, which is the natural generalization of the latent reaction activation considered in our original analysis. Given two optimal states (wild type) and (evolved mutant) and their associated biomass fluxes, and , we now limit the biomass flux to some fraction of these optimal values. This is imposed within our in silico models by the additional constraints and , where . The nonoptimal reference states are then defined by replacing the optimal states before and long after a knockout with the closest feasible metabolic states that satisfy these growth constraints. We performed this analysis for and .
With respect to the new choices of nonoptimal reference states, the short term
response of the metabolic network to single-gene knockouts still exhibits a
transient burst of reaction activity. According to MOMA, the average and
standard deviation of the number of fluxes with larger magnitude than in both
reference states is 260 83 () and 263 82 (). These numbers are comparable to the reactions that are
transiently activated by MOMA with respect to optimal reference states (main
text, Table 1). Figure S2 shows the MOMA-predicted difference in growth
rate when these transiently upregulated fluxes are constrained to not exceed
the reference states in magnitude. In all cases, downregulation of
the transiently upregulated pathways is predicted to improve growth in the short
term following a knockout perturbation, by an average of 6.0% ()
and 10.4% () of the optimal wild-type growth rate. This analysis
is therefore in agreement with the prediction presented in the main text for
optimal reference states, namely, that the transient activation (or otherwise
upregulation) of latent pathways generally inhibits growth in the short term
following a perturbation.
Elementary Mode Analysis. The results of Fig. 3 (main text) suggest that the primary effect of latent pathway removal is to favor the availability of high-growth metabolic states by preferentially eliminating low-growth states following a genetic perturbation. This is accomplished by eliminating reactions that are silent in the optimal states we consider before and after the knockout, thereby increasing the likelihood that the initial metabolic response will activate pathways associated with higher growth. It should be noted, however, that a given reaction can in general be active in many metabolic states, spanning both low- and high-growth phenotypes. It is therefore likely that many high-growth states will by eliminated by disabling latent pathways as well.
To systematically examine this connection between high-growth states and latent pathways, we have used Elementary Mode (EM) Analysis, which is an approach for analyzing metabolic networks in terms of interconnected sets of reactions [10]. An EM is defined as a unique set of active reactions in the network (represented by a vector in flux space) that i) satisfies the steady-state constraints , ii) obeys all reversibility constraints (negative entries in must correspond to reversible reactions), and iii) is minimal in the sense that no reaction may be removed from the set while still satisfying (i) and (ii) [11]. Any steady-state flux distribution can be represented as a linear combination of EMs with nonnegative coefficients.
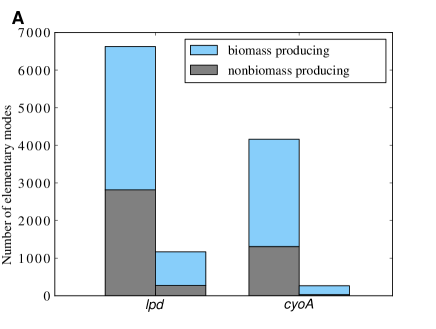
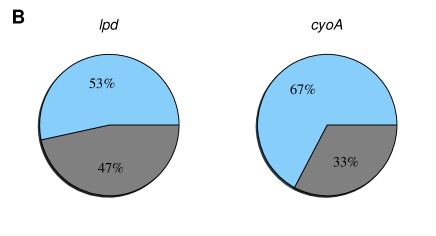
The number of EMs of grows combinatorially with the size of the metabolic network, making their calculation computationally infeasible for the full E. coli iAF1260 model. Therefore, we focused on the subnetwork comprising E. coli’s central metabolism, which was also used for the volume calculation (main text, Model-Independent Analysis). Using the program METATOOL [12], we obtained the full set of 18,656 EMs available on glucose. We have classified each mode as “biomass-producing” or “nonbiomass-producing”, based on whether it has a positive or zero entry corresponding to the (irreversible) biomass flux, respectively. It follows that a linear combination of EMs representing a general zero or low-growth metabolic state will be composed primarily of non biomass-producing EMs, with only a small aggregate contribution from the EMs that produce biomass. Figure S3 shows the effect of latent pathway removal on these two types of EMs for the cyoA and lpd mutants. A significant fraction of the original 18,656 EMs are eliminated by the knockout perturbation (namely, those that involve a disabled reaction). Further EMs will be eliminated when the latent pathways are disabled. As expected from the solution space volume calculation and hit-and-run analysis in the main text (Model-Independent Analysis section), the effect of latent pathway removal is to skew the distribution of EMs toward those that produce biomass (Fig. S3A). But, surprisingly, a large number of biomass-producing modes are sacrificed as well, and in fact comprise the majority of EMs disabled in this process (Fig. S3 A and B).
Additional insight comes from analyzing the growth capabilities of the metabolism when one eliminates every reaction that is silent in the corresponding FBA-predicted optimal state of the knockout mutant. This corresponds to an average of 1,967 6 reactions across all 52 knockout mutants, roughly 7 and 16 times larger than the number of latent pathways removed for MOMA and ROOM, respectively (main text, Table 1). Figure S4 shows the range of growth rates that can be realized by each mutant in this scenario. For the majority of the mutants, metabolic states with very low growth ( 10% of the optimal wild-type growth rate) exist, even when this large set of optimally silent reactions is disabled. This is particularly significant given that, with few exceptions (5 according to MOMA, 1 according to ROOM), the unadapted states of the 52 tested knockout mutants exceed this growth threshold in our models when the latent pathways are enabled.
Taken together, these effects confirm that latent pathways cannot be considered
in isolation from biomass production, particularly in optimal growth states.
Comparison with iJR904 E. coli Model.
We have repeated our calculations for the extensively curated iJR904
reconstruction of the E. coli metabolic network
[6], which has been previously analyzed in great detail
in connection with synthetic rescue interactions. This network consists of 931
reactions, 904 enzyme-coding genes, 618 metabolites, 143 exchange
fluxes, and the biomass flux.
Within this model, there are 36 single-gene knockout strains that are compatible with growth
but for which the original growth-maximizing metabolic state becomes infeasible after the knockout.
For this set of genes, the average and standard deviation changes in growth rate are
+12.0 (15.8)% (MOMA) and +1.1 (3.1)% (ROOM) and +65.6 (11.4)% (random) for
the removal of the latent reactions associated with the individual knockout
perturbations. The results are therefore consistent with those presented in
Table 1 for the iAF1260 model (main text).
References
- [1] Edwards JS, Palsson BØ (2000) The Escherichia coli MG1655 in silico metabolic genotype: its definition, characteristics, and capabilities. Proc Natl Acad Sci USA 97:5528–5533.
- [2] Segre D, Vitkup D, Church GM (2002) Analysis of optimality in natural and perturbed metabolic networks. Proc Natl Acad Sci USA 99:15112–15117.
- [3] Shlomi T, Berkman O, Ruppin E (2005) Regulatory on/off minimization of metabolic flux changes after genetic perturbations. Proc Natl Acad Sci USA 102:7695–7700.
- [4] Mahadevan R, Schilling CH (2003) The effects of alternate optimal solutions in constraint-based genome-scale metabolic models. Metab Eng 5:264–276.
- [5] Reed JL, Palsson BØ (2004) Genome-scale in silico models of E. coli have multiple equivalent phenotypic states: Assessment of correlated reaction subsets that comprise network states. Genome Res 14:1797–1805.
- [6] Reed JL, Vo TD, Schilling CH, Palsson BØ (2003) An expanded genome-scale model of Escherichia coli K-12 (iJR904 GSM/GPR). Genome Biol 4: R54.
- [7] Covert MW, Knight EM, Reed JL, Herrgard MJ, Palsson BØ (2004) Integrating high-throughput and computational data elucidates bacterial networks. Nature 429:92–96.
- [8] Feist AM, et al. (2007) A genome-scale metabolic reconstruction for Escherichia coli K-12 MG1655 that accounts for 1260 ORFs and thermodynamic information. Mol Syst Biol 3:121.
- [9] Nishikawa T, Gulbahce N, Motter AE (2008) Spontaneous reaction silencing in metabolic optimization. PLoS Comp Biol 4:e1000236.
- [10] Trinh CT, Wlaschin A, Sriene F (2009) Elementary mode analysis: A useful metabolic pathway analysis tool for characterizing cellular metabolism. Appl Microbiol Biotechnol 81: 813–826.
- [11] Schuster S, Dandekar T, Fell DA (1999) Detection of elementary flux modes in biochemical networks: A promising tool for pathway analysis and metabolic engineering. Trends Biotechnol 17:53–60.
- [12] von Kamp A, Schuster S (2006) Metatool 5.0: Fast and flexible elementary modes analysis. Bioinformatics 22:1930–1931.
| Integer ROOM | |||
| + | = | ||
| Linear ROOM | |||
| + | 12 | 0 | 0 |
| = | 12 | 27 | 1 |
| 0 | 0 | 0 |
| The rows and columns indicate the number of single-gene knockout perturbations for which the early post-perturbation growth-rate is larger (), smaller (), or negligibly different () when the latent pathways are disabled beforehand compared to the case in which they are available. As in the main text, we define a change to be negligible if its magnitude is less than 1% of the wild-type growth rate. The majority of cases are on the diagonal, indicating that the two methods predict the same growth impact of latent pathway removal. There are no mutants for which the two methods predict a significant change in opposite directions. |
| MOMA | ROOM | Random | |
|---|---|---|---|
| Latent reactions for individual perturbations: | |||
| All knockout perturbations | +10.5 (13.2)% | +1.5 (3.8)% | +61.0 (9.4)% |
| Significant differences \tablenoteBy more than 1% of the wild-type growth rate: 57% (MOMA), 26% (ROOM), and 100% (random) of the perturbations. | +18.4 (12.8)% | +5.5 (5.9)% | +61.0 (9.4)% |
| Number of reactions removed | 267 (82) | 96 (45) | 902 (5) |
| Simultaneously nonessential latent reactions: | |||
| All knockout perturbations | +8.8 (11.2)% | +1.5 (3.8)% | |
| Significant differences \tablenoteBy more than 1% of the wild-type growth rate: 52% (MOMA) and 24% (ROOM) of the perturbations. | +16.7 (10.4)% | +5.8 (5.9)% | |
| Number of reactions removed | 235 (76) | 82 (38) |
| Corresponds to Table 1 of the main text for 46 knockout mutants in a modified iAF1260 E. coli model in which 152 reactions have been disabled to account for known regulatory constraints in aerobic glucose medium conditions. |