Supernova discoveries 2010-2011: statistics and trends
Abstract
We have inspected all supernova discoveries reported during 2010 and 2011, a total of 538 events during 2010 and 926 events during 2011. This number includes a small number of “supernova impostors” (bright extragalactic eruptions) but not novae or events that turned out to be Galactic stars. We examine the statistics of all discovered objects, as well as those of the subset of spectroscopically-confirmed events. In these two years we see the rise of wide-field non-targeted supernova surveys to prominence, with the largest numbers of events reported by the CRTS and PTF surveys (572 and 393 events in total respectively, contributing together of all reported discoveries in 2011), followed by the integrated contribution of numerous amateurs (184 events). Among spectroscopically-confirmed events the PTF (393 events) leads, followed by CRTS (170 events), and amateur discoveries (144 events). Traditional galaxy-targeted surveys, such as LOSS and CHASE, maintain a strong contribution (86 and 61 events, respectively) with high spectroscopic completeness (). It is interesting to note that the community managed to provide substantial spectroscopic follow-up for relatively brighter amateur discoveries ( mag), but significant less help for fainter (and much more numerous) events promptly released by the CRTS ( mag). Inspecting discovery magnitude and redshift distributions we find that PS1 discoveries have similar properties ( mag, ) to events found in previous seasons by cosmology-oriented projects (e.g., SDSS-II), while PTF ( mag, ) and CRTS ( mag, ) populate the relatively unexplored phase space of faint SNe ( mag) in nearby galaxies (mainly PTF), and events at (CRTS and PTF). Examining the specific question of reporting channels over the previous dozen years, we find that traditional reports via CBET telegrams now account only for a minority of SN discoveries.
1 introduction
The study of supernovae (SNe) has a long history, going back to pioneers like Zwicky, Baade and Minkowski. During the decades the numbers of SN discoveries reported every year have increased from a handful to hundreds. With improved instrumentation, fainter and more distant SNe are discovered. Here, we inspect the SN discoveries reported during the years 2010 and 2011 in detail. We also provide a report on the use of various reporting channels during the past decade. Our goal is to point out general trends seen, some of which have operational implications to the community, in particular in allocation of follow-up resources and consideration of reporting mechanisms.
2 Data
We have used the yearly summary provided by one of us (D. B.) via the “latest supernovae” webpage111http://www.rochesterastronomy.org/snimages/ to count the number of supernova discoveries during 2010-2011. As this page indexes discoveries reported via different channels (IAUCs, CBETs, ATELs, the TOCP page) and attempts to cross-link objects reported by different projects at different times, it seems optimal for this purpose222We have not included objects reported for the first time in refereed papers, e.g., those released by the PTF project in Arcavi et al. (2010) and Ofek et al. (2012; 2013), or those reported by PS1 in Chornock et al. (2013) and Berger et al. (2012). We have included in our statistics all objects initially reported as supernovae (including “possible supernovae”). We have separately counted spectroscopically-confirmed events. In principle, we did not count the few events that turned out to be “supernova impostors”, i.e., eruptions of Luminous Blue Variables (LBVs; e.g., Van Dyk 2005, Smith et al. 2011) or members of the class of Luminous Red Novae (LRN; Kulkarni et al. 2007; for example, PTF10fqs, Kasliwal et al. 2011), and have eliminated reported events that turned out to be Galactic stars or extragalactic novae. A handful of such events (reported in 2010) may have been retained, but these should not influence our results. Objects reported independently by two projects were counted twice (so the total discovery number is slightly less than the sum of listed discovery numbers by project). The number of such “double-counting” events we identified is small (34 cases in 2011).
In general, the number of reported transients in 2011 was much larger than in 2010. In total there were 975 objects reported (551 in 2010), of these 49 () were novae, Luminous Blue Variables (LBVs), other extra-galactic variables or Galactic variable stars. These are not covered by this paper.
We list in Table 1 below the number of SN discoveries broken by projects. We have grouped all discoveries reported by individuals into an “amateur” class, and all discoveries by projects with a few SNe each into one “other” class. These data were manually harvested from the “latest Supernovae” webpage (accessed on Dec. 31, 2010 and again during spring and summer 2012) and may contain errors either inherent to the webpage or introduced by us (if so, we apologize). Analysis of reports from 2011 was more complicated due to the larger number of events and additional reporting channels (e.g., private webpages) so we have tried to cross-check reported discoveries against the source of each report. We estimate that any remaining errors that may exist are negligible, and the trends seen in this summary should not be affected.
| Project | Total number of | Spectroscopically | Mean | Mean |
|---|---|---|---|---|
| SN discoveries | confirmed events | redshift | magnitude [mag] | |
| (2010,2011,total) | (2010,2011,total) | (2010,2011,total) | (2010,2011,total) | |
| CRTS | 190, 382, 572 | 67, 103, 170 | 0.057, 0.045, 0.049 | 18.0, 18.9 18.6 |
| PTF | 88, 305, 393 | 88, 305, 393 | 0.086, 0.097, 0.095 | 19.3, 19.2, 19.2 |
| Amateurs | 82, 102, 184 | 69, 75, 144 | 0.019, 0.020, 0.020 | 16.7, 16.4, 16.5 |
| LOSS | 50, 36, 86 | 48, 28, 76 | 0.024, 0.020, 0.022 | 18.2, 17.3, 17.8 |
| PS1 | 63, 11 74 | 63, 11, 74 | 0.240, 0.169, 0.229 | 21.7, 20.8, 21.6 |
| CHASE | 36, 25, 61 | 32, 23, 55 | 0.023, 0.016, 0.020 | 16.6, 16.8, 16.7 |
| MASTER | 5, 23, 28 | 3, 9, 12 | 0.034, 0.159, 0.137 | 16.2, 17.6, 17.4 |
| ROTSE | 13, 6, 19 | 11, 5, 16 | 0.051, 0.061, 0.054 | 17.9, 17.6, 17.8 |
| LSSSS | 13, 6, 19 | 9, 3, 12 | 0.033, 0.035, 0.034 | 17.4, 16.8, 17.2 |
| ISSP | 0, 19, 19 | 0, 18, 18 | 0.022 | 16.8 |
| LSQ | 0, 7, 7 | 0, 7, 7 | 0.061 | 18.9 |
| Others | 11, 6, 17 | 9, 6, 15 |
3 Discussion
We scanned publically-accessible sources and have attempted to extract for as many events as we could the redshift of spectroscopically-confirmed SNe, and their discovery magnitudes. The data were available for the majority of events. We calculated the mean values and present them in Table 1. In the few cases where some data were missing (mostly redshifts) we calculated the means without these data; the incompleteness appears unlikely to change the reported numbers significantly. We did not calculate mean values for the “other” category, as these SNe were discovered by very different means and projects.
Inspecting Table 1, we note the following trends.
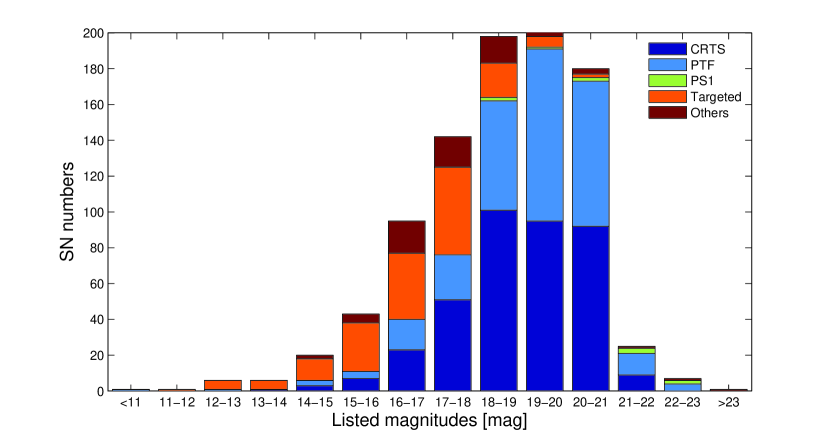
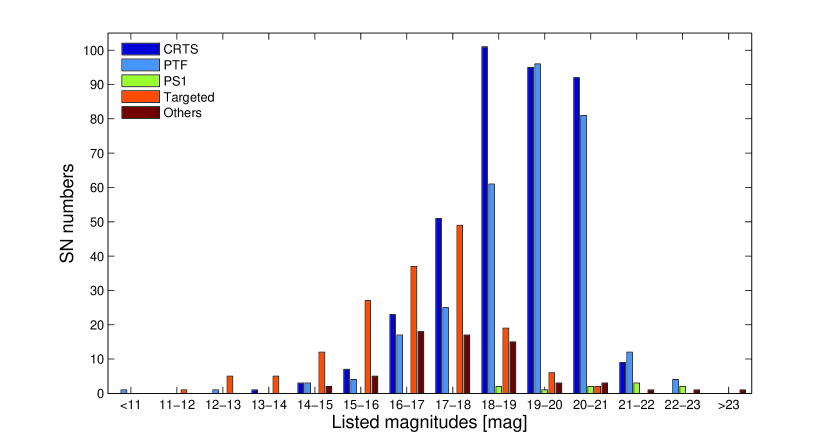
The most prolific source of SN candidates in 2010-2011 was the CRTS survey. However, only of the candidates discovered by this survey have been spectroscopically confirmed, many by observers that appear to be affiliated with the survey. It is interesting to note that the larger SN community managed to provide substantial spectroscopic follow-up for relatively brighter amateur discoveries (), but did not provide significant help for slightly fainter (and much more numerous) events promptly released by the CRTS (). One can speculate that the amount of large telescope time set aside specifically for spectroscopic follow-up of SNe of unspecified origins (“public events”), in addition to flexible spectroscopic resources (nights during which observers can “squeeze in” recently discovered SNe) are saturated by the discovery stream from CRTS. In contrast, the LOSS survey that led this field in the previous decade (Leaman et al. 2011, Li et al. 2011) and which discovers SNe of similar or fainter magnitudes to those discovered by the CRTS, enjoyed high spectroscopic completeness (), probably due to its dedicated long-standing follow-up program. The southern CHASE project typically discovered brighter events () and had a comparable spectroscopic completeness to that achieved for LOSS and amateur discoveries (which also have similar magnitudes). Since PTF and PS1 only report spectroscopically-confirmed events, their spectroscopic completeness cannot be determined.
Inspecting the discovery magnitude and redshift distributions (Figures 1 and 2.) we find that PS1 discoveries have similar properties (, ) to events found in previous seasons by cosmology-oriented projects such as the SDSS-II supernova search (Frieman et al. 2008; Sako et al. 2008) and to a lesser degree also ESSENCE (Miknaitis et al. 2007) and SNLS (Astier et al. 2006)333The bulk of the PS1 discoveries which have been announced (in 2010) are from the PS1 Medium Deep Field survey, which covers a relatively narrow field (88 square degrees total) to deep limiting magnitudes ( mag), and hence provides fainter targets. A small number of SNe (and other transients) have been found (mostly in 2011) in the shallower, wider field “3Pi Faint Galaxy Supernova Survey” (e.g., Valenti et al. 2010), with discovery magnitudes in the range mag.. The two other new untargeted surveys, PTF (, ) and CRTS (, ) populate a relatively unexplored phase space. PTF is finding faint SNe ( mag) in nearby galaxies, while both CRTS and PTF discover events in the redshift range , previously little explored as it lies beyond the reach of the nearby targeted surveys (LOSS and CHASE) and yet requires a wide survey to discover numerous events (c.f., narrow and deep cosmological surveys).

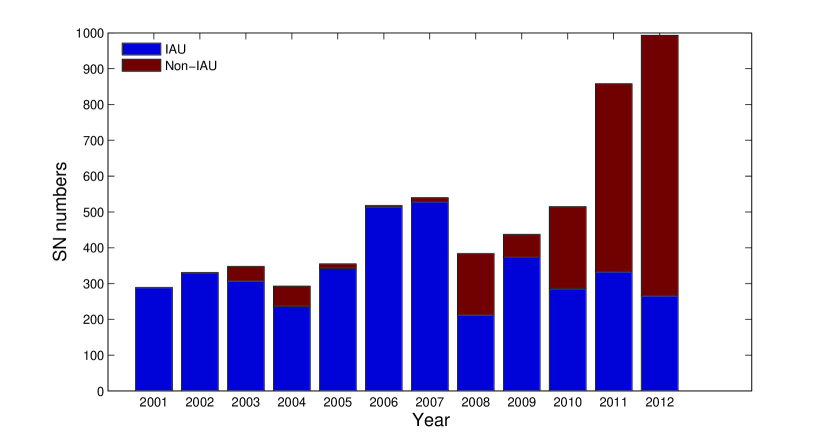
In terms of reporting channels, in 2011 only 281 SNe () were reported via CBET circulars, 580 SNe () were reported in ATels, 57 SNe () were reported only via the CBAT TOCP page, and 10 SNe () were reported using the SNHunt project webpage. Some SNe were reported separately in both CBETs and ATels. We note that a change in CBET policy implemented in 2011 (reporting only spectroscopically-confirmed events) further complicates analysis and record-keeping (if one includes also SNe without spectroscopic confirmation). It may seem that a revision should be considered by the community regarding the mode SN discoveries are reported, tracked and circulated. Using statistics extracted from the “latest supernovae” webpage for the years 2001-2012, we plot in Figure 3 the fractions of events reported to the IAU during this period. As can be seen, starting in 2010, a significant number of events are no longer reported to the IAU, and during 2011 (and more so, 2012) the non-IAU reports have become the majority.
4 Summary
We enumerate the reported SN discoveries during 2010-2011 and point out several statistical trends. The impact of the new generation of untargeted surveys has been substantial during these years, with CRTS and PTF providing the largest number of the total and spectroscopically-confirmed events released to the community, respectively. The large number of CRTS SN candidates that have not been spectroscopically confirmed may indicate that the SN community cannot provide follow-up to the emerging large numbers of faint SNe. The inception and recent launch of the Public ESO Spectroscopic Survey of Transient Objects (PESSTO; PI Smartt444www.pessto.org) may improve this situation. New surveys continue to provide access to new observational parameter space, including very faint events in nearby galaxies, and SNe in the relatively uncharted redshift range .
References
- Arcavi et al. (2010) Arcavi, I., et al. 2010, ApJ, 721, 777
- Astier et al. (2006) Astier, P., et al. 2006, A&A, 447, 31
- Berger et al. (2012) Berger, E., Chornock, R., Lunnan, R., et al. 2012, ApJ, 755, L29
- Chornock et al. (2013) Chornock, R., Berger, E., Rest, A., et al. 2013, ApJ, 767, 162
- Drake et al. (2009) Drake, A. J., et al. 2009, ApJ, 696, 870
- Filippenko et al. (2001) Filippenko, A. V., Li, W. D., Treffers, R. R., & Modjaz, M. 2001, IAU Colloq. 183: Small Telescope Astronomy on Global Scales, 246, 121
- Frieman et al. (2008) Frieman, J. A., et al. 2008, AJ, 135, 338
- Kasliwal et al. (2011) Kasliwal, M. M., Kulkarni, S. R., Arcavi, I., et al. 2011, ApJ, 730, 134
- Kulkarni et al. (2007) Kulkarni, S. R., et al. 2007, Nature, 447, 458
- Law et al. (2009) Law, N. M., et al. 2009, PASP, 121, 1395
- Leaman et al. (2011) Leaman, J., Li, W., Chornock, R., & Filippenko, A. V. 2011, MNRAS, 412, 1419
- Li et al. (2011) Li, W., Leaman, J., Chornock, R., et al. 2011, MNRAS, 412, 1441
- Lipunov et al. (2010) Lipunov, V., et al. 2010, Advances in Astronomy, 2010,
- Miknaitis et al. (2007) Miknaitis, G., et al. 2007, ApJ, 666, 674
- Ofek et al. (2013) Ofek, E. O., Fox, D., Cenko, S. B., et al. 2013, ApJ, 763, 42
- Ofek et al. (2013) Ofek, E. O., Sullivan, M., Cenko, S. B., et al. 2013, Nature, 494, 65
- Pignata et al. (2009) Pignata, G., Maza, J., Hamuy, M., Antezana, R., & Gonzales, L. 2009, Revista Mexicana de Astronomia y Astrofisica Conference Series, 35, 317
- Rau et al. (2009) Rau, A., et al. 2009, PASP, 121, 1334
- Sako et al. (2008) Sako, M., et al. 2008, AJ, 135, 348
- Smith et al. (2011) Smith, N., Li, W., Silverman, J. M., Ganeshalingam, M., & Filippenko, A. V. 2011, MNRAS, 415, 773
- Valenti et al. (2010) Valenti, S., et al. 2010, The Astronomer’s Telegram, 2981, 1
- van Dyk (2005) van Dyk, S. D. 2005, The Fate of the Most Massive Stars, 332, 47