H emitters in proto-clusters: evidence for faster evolution in dense environments
Abstract
This is a study of H emitters in two dense galaxy proto-clusters surrounding radio galaxies at . We show that the proto-cluster surrounding MRC 1138-262 contains times more H candidates than the average field ( significance), and the radio galaxy 4C 10.48 is surrounded by times more emitters than the field (), so it is also likely to reside in a dense proto-cluster environment. We compared these H emitters, situated in dense environments, to a control field sample selected from 3 separate fields forming a total area of arcmin2.
We constructed and compared H and rest-frame continuum luminosity functions of the emitters in both environments. The star formation density is on average 13 times greater in the proto-clusters than the field at , so the total star formation rate within the central 1.5 Mpc of the proto-clusters exceeds 3000. However, we found no significant difference in the shape of the H luminosity functions, implying that environment does not substantially affect the strength of the H line from strongly star forming galaxies.
The proto-cluster emitters are typically 0.8 mag brighter in rest-frame continuum than field emitters, implying they are twice as massive as their field counterparts at the same redshift. We also show the proto-cluster galaxies have lower specific star formation rates than field galaxies, meaning the emitters in the dense environments formed more of their stars earlier than the field galaxies. We conclude that galaxy growth in the early Universe was accelerated in dense environments, and that cluster galaxies differed from field galaxies even before the cluster had fully formed.
keywords:
galaxies:clusters:general – galaxies: high-redshift1 Introduction
Dense large-scale structures have been discovered in the vicinity of high redshift radio galaxies (HzRGs) up to (e.g., Le Fevre et al., 1996; Pentericci et al., 2000; Kurk et al., 2000, 2004a; Best et al., 2003; Overzier et al., 2006; Venemans et al., 2007; Overzier et al., 2008; Hatch et al., 2011; Galametz et al., 2010). These overdense fields are some of the densest regions in the early Universe. They are generally referred to as proto-clusters, since: (i) their high masses suggest they may evolve into group or cluster-sized structures (Venemans et al., 2007), (ii) kinematic analysis shows that these structures have already begun to collapse (Kuiper et al. submitted) but are not yet fully collapsed, and (iii) the lack of extended X-ray emission expected from a shock-heated intracluster medium suggests they are not yet virialized (Carilli et al., 2002).
These proto-clusters comprise of concentrations of star forming galaxies, and there is little evidence of an accompanying passively evolving population. However, passive galaxies are hard to observe and spectroscopically confirm at , so the lack of evidence does not mean passively evolving galaxies do not exist in proto-clusters. Recently, Gobat et al. (2011) found a red galaxy population in a cluster.
In the absence of strong feedback, galaxy formation is predicted to be more efficient in dense environments due to the abundance of surrounding gas (Gunn & Gott, 1972). Therefore one may expect the galaxies in dense environments to be more massive and further developed than galaxies in the field or in voids. Indeed low and intermediate redshift clusters contain more massive galaxies than the field (Baldry et al., 2006; Scodeggio et al., 2009), and their early-type members are Gyrs older than field galaxies at the same redshift (Thomas et al., 2005; van Dokkum & van der Marel, 2007; Gobat et al., 2008). When do these differences develop and what drives them? Are the differences between cluster and field galaxies inherent to the galaxies, driven by the initial matter distribution and abundance of gas supply, or does environment metamorphose galaxies?
Proto-clusters provide us with a laboratory to test how environment affects galaxy formation and evolution during the formation epoch of cluster galaxies (), when early-type galaxies formed the bulk of their stellar mass. Determining whether cluster galaxies differ from field galaxies before they even belonged to a cluster, tells us whether any of the difference observed today is driven by nature as apposed to nurture.
To observe and interpret environmental dependences it is essential to select a clean sample of proto-cluster galaxies and compare with a large field sample. Therein lies the challenge. Photometric redshifts at obtained with broad-band photometry have a limited accuracy, no more than , which is insufficient to determine cluster membership at (Cooper et al., 2005). This problem is compounded further by the star-forming nature of the proto-cluster galaxies, as their spectral breaks at Å are weak, which yields a less accurate photometric redshift. Proto-cluster studies that use broad-band photometric redshifts are plagued by sample contamination (e.g. Kuiper et al., 2010; Tanaka et al., 2010), and any signature of environmental dependance may be washed out.
The most efficient method to obtain a clean sample of proto-cluster galaxies is to select line-emitting galaxies using narrow-band imaging. Spectroscopic confirmation of line-emitting protocluster candidates have high success rates (% e.g. Venemans et al. 2007; Kurk et al. 2004b; Maschietto et al. 2008). In addition to selecting a relatively clean sample of proto-cluster galaxies, selection based on H flux identifies star-forming galaxies that have strong continua (in comparison to Ly emitters), therefore their properties can be obtained through modelling of multi-band photometry. Thus they are the ideal population with which to study the environmental dependancy of galaxies.
The high density of proto-clusters means large samples of proto-cluster H emitters can be obtained using instruments with relatively small fields-of-view, however, the rarer field samples require wide-field instruments. With the advent of large near-infrared imagers, a large field sample of H emitters has recently been obtained to similar depths as proto-cluster samples (primarily through the HiZELS program; Best et al. 2010).
In this article we constructed H and rest-frame band continuum luminosity functions of the H candidates in proto-clusters, and compared them to field H emitters at the same redshift. For the proto-cluster environment we selected the fields surrounding the HzRGs MRC 1138-262 at and 4C 10.48 at . Both of these radio galaxies have redshifts that place H emission from nearby galaxies within the bandpasses of available ESO/ISAAC filters.
MRC 1138-262 lies within a well-studied proto-cluster, with more than 30 spectroscopic redshifts (Pentericci et al. 2000; Kurk et al. 2004a, b; Doherty et al. 2010; Kuiper et al. sumbitted). 4C 10.48, also known as USS , has similar properties to MRC 1138-262. It has a stellar mass of (Seymour et al., 2007), clumpy optical and near-infrared morphology, and is surrounded by several nearby galaxies (Pentericci et al., 1999, 2001). However, at the start of this project, little was known about its large-scale environment. Using narrow-band near-infrared images we searched for H emitting galaxy candidates at the same redshift as 4C 10.48. We compared the number densities of this population to those of the proto-cluster surrounding MRC 1138-262, and a control field, to show that 4C 10.48 also lies in a proto-cluster environment.
In Section 2 we describe the observations, data reduction and source selection for the radio galaxy and control fields. In Section 3 we compare the densities of H emitters in the 3 fields, and present the H and rest-frame continuum luminosity functions of each field. In Section 4 we interpret our findings in terms of the star formation rate, stellar masses and specific star formation rates of galaxies in proto-clusters, and we summarise our findings in Section 5. Throughout we used the Vega magnitude scale and assumed CDM cosmology, with H0=70, , and .
2 Observations, data reduction and candidate selection
2.1 4C 10.48
2.1.1 Observations and data reduction
4C+10.48 was observed in service mode using HAWK-I (Kissler-Patig et al., 2008) to obtain the image, and ISAAC to obtain the and narrow-band 2.19µm ( hereafter) images. The , and data were obtained in September 2008, March 2009, and April 2005 respectively. Details of the observations are given in Table 1. The radio galaxy was positioned at the centre of the ISAAC detector, and at the centre of one of HAWK-I’s 4 detectors.
The data were reduced with the ESO/MVM data reduction pipeline (Vandame, 2004), and underwent the usual near-infrared reduction steps of dark subtraction, flat-field removal, sky-subtraction, and creation of bad pixel and weight maps. The 4 chips of the HAWK-I images were normalised. The first-guess astrometric solutions were derived from 2MASS catalogues, but the relative astronomy was corrected with IRAF tasks geomap. The pixel scale of the HAWK-I image (0.106″/pixel) was degraded to the ISAAC pixel scale of 0.148″/pixel.
To ensure the image depth was approximately consistent across the whole image, regions which had less than 30% of the maximum exposure time were masked out. The 1 image depths given in Table 1 were measured by placing apertures at multiple random locations. The total overlapping area of the and images is 6.9 arcmin2, and the overlapping area of the , and images is 5.7 arcmin2.
The and images were each flux calibrated using 2 standard stars taken before and after the science observations. The image was flux calibrated using 2MASS stars in the field of view, and further adjustments were made to this calibration by comparing the colour of stars in the images to the predicted colours of stars in the Pickles stellar library. Uncertainties in the flux calibration are mag. No correction was applied to account for Galactic extinction as this is negligible.
Source catalogues were obtained with SExtractor in double image mode. The image, weighted by the square root of the exposure time was used as the detection image for selecting excess galaxies. A similarly weighted image was used as the detection image to obtain matched catalogues from the and images. The SExtractor detection parameters were optimised to increase the image completeness whilst minimising spurious detections. Sources were selected as objects with 9 connected pixels with fluxes 1 above the local background noise. This selection resulted in no detections in the inverted detection image, thus we do not expect spurious sources in the catalogues. Total magnitudes were taken as auto magnitudes from SExtractor. To obtain accurate colours, the image was convolved to matched the image using the iraf task psfmatch. The PSF in the and images were so similar that no convolution was required. colours were measured in 1.5″ (10 pixel) diameter apertures, whilst colours were measured in 16 pixel diameter apertures, i.e. three times the seeing FWHM. This ensured that 90% of the flux from a point source lay within the colour aperture.
| Filter | Exposure time | 1 depth | Seeing | Completeness |
|---|---|---|---|---|
| (hours) | (mag) | (FWHM) | 95% | |
| Ks | 1 | 23.8 | 0.46″ | 21.9 |
| NB_2.19 | 3.25 | 22.9 | 0.44″ | 20.8 |
| Js | 0.4 | 24.25 | 0.78″ | – |
Image completeness was measured by simulating 1500 galaxies on the NB and Ks images using the iraf packages gallist and mkobject. Objects were detected with Sextractor and the 95% completion level for the and images are 20.8 and 21.9 mag respectively.
2.1.2 Selection of candidate H emitters
H emitted at is redshifted into the passband, therefore candidate H emitters were selected as sources with excess flux relative to their broad-band flux (known as excess sources). To select candidate H emitters we followed the method and criteria of Bunker et al. (1995). The H candidates must have (i) sufficient equivalent width () and (ii) a colour sufficiently larger than the combined noise () of the and images.
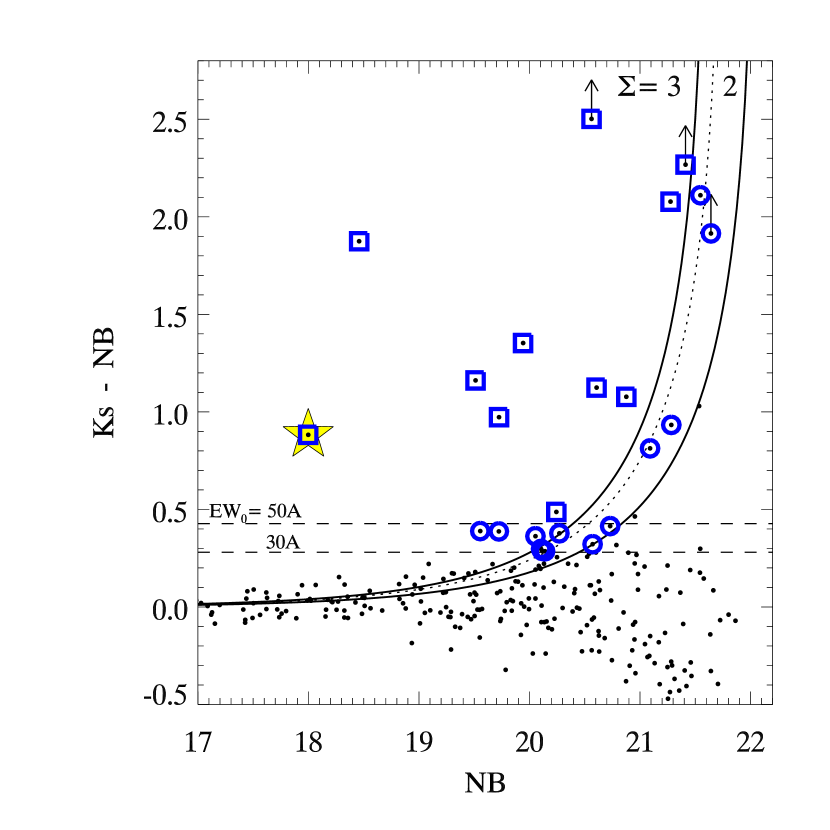
The colour-magnitude diagram for all sources detected in the image is shown in Fig. 1. H candidates were selected as sources with Å and . We also highlight the more-secure H candidates as those that satisfy Å and . 24 sources are candidate H emitters with Å and , of which 11 are selected by the stricter Å and criteria.
To compare these data to the control fields and the MRC 1138-262 proto-cluster, we ensured that the selection criteria of excess galaxies are identical in all fields. The shallowest data we use are the COSMOS field data described in Section 2.3.1. The dotted line in Fig. 1 marks the location of the detection limit of the COSMOS data. There are 19 excess galaxies near 4C 10.48 with and Å.
2.2 The MRC 1138-262 proto-cluster
The proto-cluster surrounding the radio galaxy MRC 1138-262 is one of the best studied dense regions at (e.g. Kurk et al., 2000; Pentericci et al., 2000; Kurk et al., 2004a, b; Miley et al., 2006; Hatch et al., 2008, 2009; Tanaka et al., 2010). We used the results of Kurk et al. (2004a) who identified H emitters in a 12.5 arcmin2 field surrounding MRC 1138-262. The field was observed using ISAAC through both the NB 2.07µm and filters. The total exposure time was 1.6 h in and 4.8 h in NB_2.07µm, and the FWHM of the seeing was 0.45 arcsec and 0.55 arcsec respectively. The NB_2.07µm filter has a FWHM bandwidth of 26Å, which slightly narrower than the NB_2.19µm filter. However the transmission function of the filters differ slightly, such that the total spectral width covered by both filters is comparable.
Details on the data reduction, object detection, and selection of NB-excess sources can be found in Kurk et al. (2004a). Candidate H emitters were selected following the same procedure as described above, in particular, the curve for the MRC 1138-262 data follows closely the dotted curve in Fig. 1 (see Fig. 6 in Kurk et al. 2004a). To allow a robust comparison we only selected NB-excess sources with rest-frame Å. There are 38 sources with and EW Å, of which 3 are within the Ly halo of the radio galaxy, and thus not counted as part of the overall large-scale structure.
Spectroscopy of 9 of the brightest candidate H emitters are presented in Kurk et al. (2004b). All are confirmed to have an emission line and 3 of which are confirmed to be H due to the presence of [Nii]. The other 6 objects with just one emission line are also clustered in velocity space near the redshift of the radio galaxy, which strongly suggests that they are located in a large-scale structure associated with the radio galaxy.
2.3 Control Fields
| Field | Filter | Exposure time | 1 depth | Seeing |
|---|---|---|---|---|
| (hours) | (mag) | (FWHM) | ||
| GOODS-S | 2.18 | 24.0 | 0.5″ | |
| NB_2.09µm | 14.4 | 23.6 | 0.6″ | |
| COSMOS | 0.78 | 22.9 | 0.7″ | |
| NB H2 2.12µm | 5.4 | 22.9 | 0.7″ | |
| UDS | DR8 | 24.5 | 0.8″ | |
| NB H2 2.12µm | 5.3 | 23.2 | 0.6″ |
2.3.1 NB-excess galaxies
Field H emitting candidates at were selected using 2µm HAWK-I narrow-band images of the GOODS-S, UDS and COSMOS fields obtained through programs 081.A-0932(A) (see Hayes et al. 2010 for details), and 083.A-0826(A) (P.I. P. Best). The image of the GOODS-S was obtained with the 2.095µm HAWK-I narrow-band filter which is 191.5Å wide, so captures H emitted from galaxies at . The images of COSMOS and the UDS were obtained with the 2.124µm narrow-band filter which is 300Å wide, so they capture H emitted from galaxies at . All 3 fields have a similar field-of-view of 57 arcmin2.
The data were reduced using MVM in the same manner as described above. Images taken in poor seeing were not included in the final combined dataset. The UDS was not observed in the by HAWK-I so the DR8 image from UKIDSS was used instead. Final exposure times, seeing full width at half maximum (FWHM), and resulting 1 limiting magnitudes are given in Table. 2. The band data were flux calibrated using the publicly available catalogues of Retzlaff et al. (2010), Simpson et al. (2010 in prep.) and Ilbert et al. (2009). The NB data were flux calibrated using standard stars, and further adjustments made after examining the colours of stars in the fields. The resolution of the images were homogenised to match that of the lowest-resolution images, and colours were measured in apertures that were 3 times the seeing FWHM (1.8″ for GOODS-S, 2.4″ for the UDS, and 2.1″for COSMOS). In all 3 control fields approximately 90% of the light from a point source lies within these apertures.
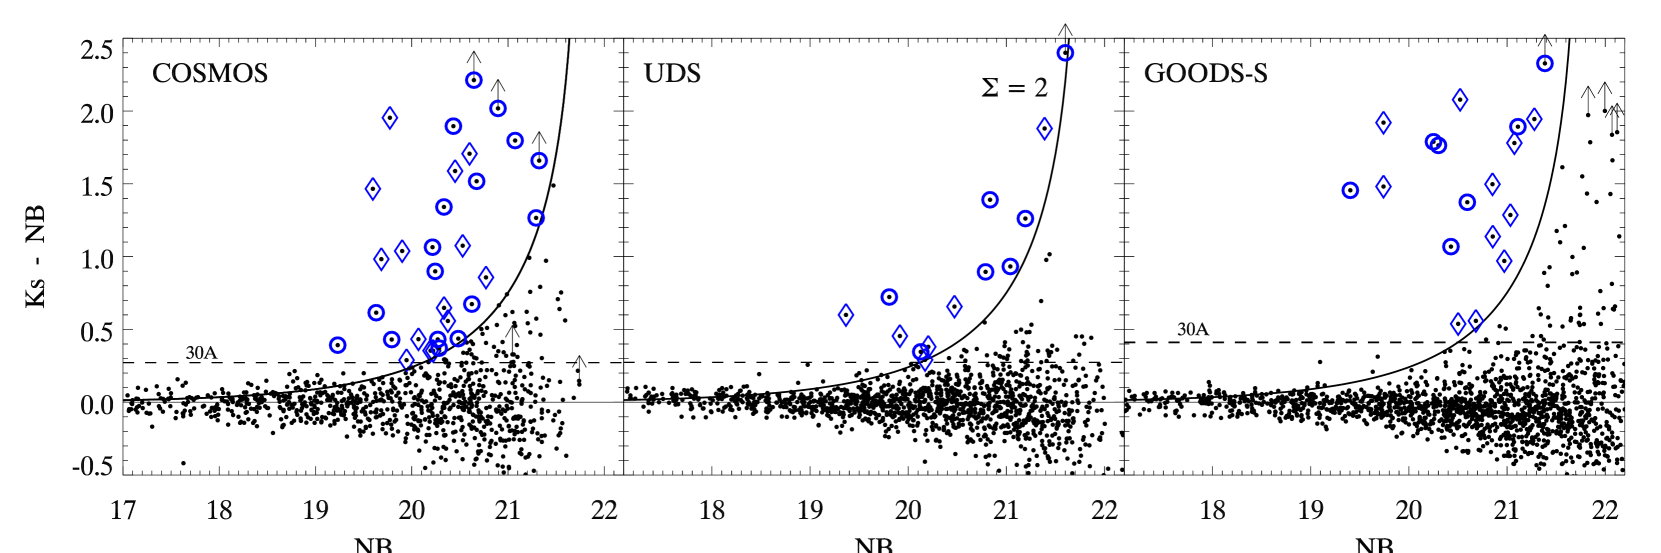
Objects were detected using Sextractor in double image mode, using a weighted image as the detecting image. The same Sextractor parameter file used for the 4C 10.48 data was also used for the control field data to ensure the source detection was as similar as possible. excess galaxies were selected as objects with Å and (see Fig. 2). We ensured that the selection of candidates was identical to the 4C 10.48 field by selecting galaxies to the same limit. The COSMOS data are the shallowest data therefore only sources up to the depth of the COSMOS data were selected. This selection resulted in 18 excess galaxies in GOODS-S, 13 in the UDS, and 31 in COSMOS. All candidates were checked by eye to ensure they were real sources. The total combined area of all 3 control fields is 172 arcmin2.
2.3.2 Emission-line contaminants and selecting H emitters
Galaxies with excess flux in the 2µm narrow-band may be H emitters at , but they could also be emission line galaxies at low redshift (e.g. P, P or [Fe ii] emitters) or [Oiii] emitters at . These contaminants may be identified and removed by examining their optical colours.
To remove low redshift contaminants we selected only excess objects that are galaxies (Daddi et al., 2004), since low redshift contaminants will not lie within the BzK criteria. galaxies comprise both evolved () and star-forming () populations. The H emitters are likely to be star-forming s and have similar colours to galaxies. To remove the [Oiii] emitters from our sample we use the Lyman break in the spectral energy distribution of galaxies. The Lyman break of galaxies is redshifted into the band, so [Oiii] emitters have red colours or are band dropouts, whereas H emitters have bluer colours. Thus we used the colour to segregate and remove [Oiii] contaminants.
The optical and near-infrared colours of the excess objects were obtained from the catalogues of Santini et al. (2009), Simpson et al. (2010) and Ilbert et al. (2009). However, the Ilbert et al. (2009) and Simpson et al. (2010) catalogues of the COSMOS and DR3 UDS fields do not contain counterparts for many excess objects. This difference may arise because Simpson et al. (2010) used the DR3 version of the UDS data to create their catalogue, whilst we use the much deeper DR8 images, and the Ilbert et al. (2009) catalogue is an band selected catalogue, so some of the faint, red sources may not be detected in the band.
The colours of the objects missing from the catalogues were measured from the publicly available , , and images of the COSMOS and UDS fields (see Furusawa et al. 2008 and Capak et al. 2007 for details). magnitudes of the UDS candidates were obtained from a 5.8 hour CFHT image reduced by H. Hildebrandt (see Hildebrandt et al. 2009 and Erben et al. 2009 for details regard the reduction procedure). The , and images were homogenised to the same resolution and colours were measured in 3 arcsec diameter apertures. The colours of galaxies in the public catalogues were compared to our measurements, and no significant differences were found.
In Fig. 3 we show the and colours of all 25 NB-excess objects with photometric redshifts in the Santini et al. (2009) and Ilbert et al. (2009) catalogues. The selection efficiently removes all low redshift contaminants, and objects have red colours. Thus we separated the H emitters from the low and high redshift contaminates by selecting galaxies with the following AB colours:
| (1) |
32% of the NB-excess galaxies with photometric redshifts are H emitters at . But photometric redshifts are only determined for the brightest subset of candidates, so the total fraction of excess sources that are H emitters may be higher.
55 out of the 62 control field excess objects were detected in the , , and images, of which 33 are galaxies. Only 25 of the galaxies have colours and are therefore likely to be H emitters. We estimate that only 45 per cent of the selected excess objects in the control fields are H emitters. This fraction is slightly higher, but still consistent given our low number statistics, with the estimates of Geach et al. (2008) and Hayes et al. (2010).
3 Results
3.1 H candidates near 4C 10.48
This is the first study on the large-scale environment of 4C 10.48, so before we compare the H candidates in the radio galaxy fields and control fields, we first present the properties of the H candidates near 4C 10.48.
3.1.1 Colours of 4C 10.48 H candidates
Fig. 4 plots the verses colour-magnitude diagram for all sources detected in the image of 4C 10.48. The 16 H candidates detected in both and images are marked by blue circles. Unfortunately both the and bandwidths cover strong emission lines from galaxies at : the band includes [Oii], whilst the band includes H+[Nii]. So the colour is not a good indicator of the continuum colour for high objects.
Most of the H emitters have blue colours in the range , but five of the H emitters lie on a possible red sequence at . One of these red H emitters is the radio galaxy. The red colour of the other two 50Å candidates is due to the strong H emission that falls within the band.
There are 3 red H candidates with relatively low s, whose red colour is likely to be due to red continuum. To cause their red colour, these galaxies must either contain a large amount of dust, or their light is dominated by an old stellar population.
3.1.2 Spatial distribution of H emitters
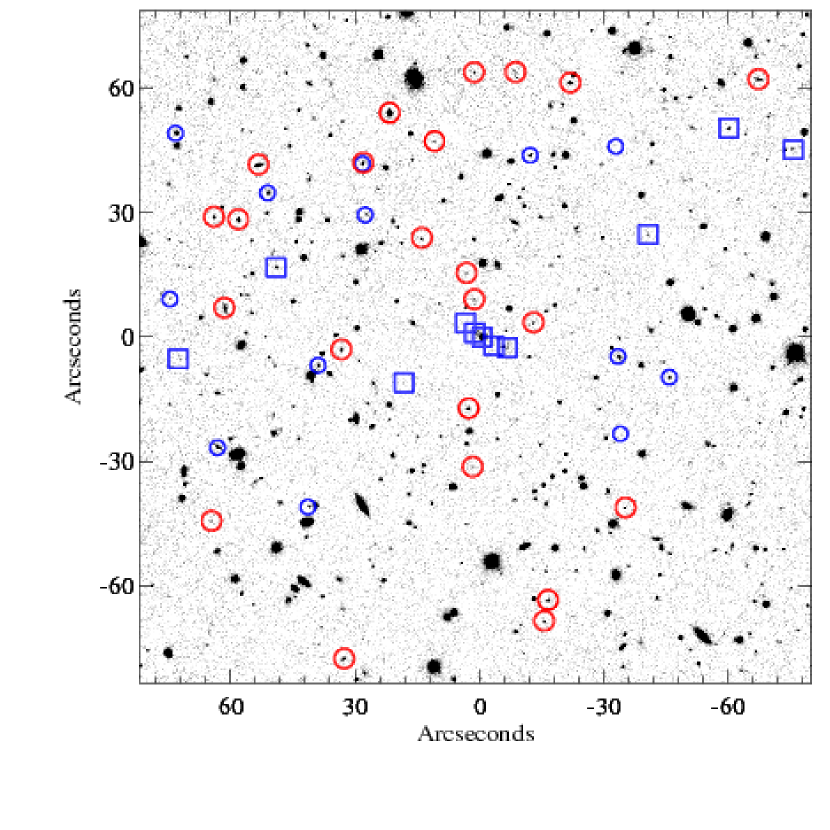
The spatial distribution of the z candidates around 4C 10.48 is plotted in Fig. 5. The H candidates are not highly clustered, except for a strong clustering around the radio galaxy. Most of the H emitters lie in the northern half of the image, and the high sources lie in a large East-West filament.
Also marked by red circles are distant red galaxies (DRGs), which were selected from the catalogues as objects with , in accordance with the criteria of Franx et al. (2003). These galaxies generally lie at , so some of them may be associated with the radio galaxy. One DRG is also selected as a H candidate which suggests it lies at the same redshift as 4C 10.48.
3.1.3 The radio galaxy 4C 10.48
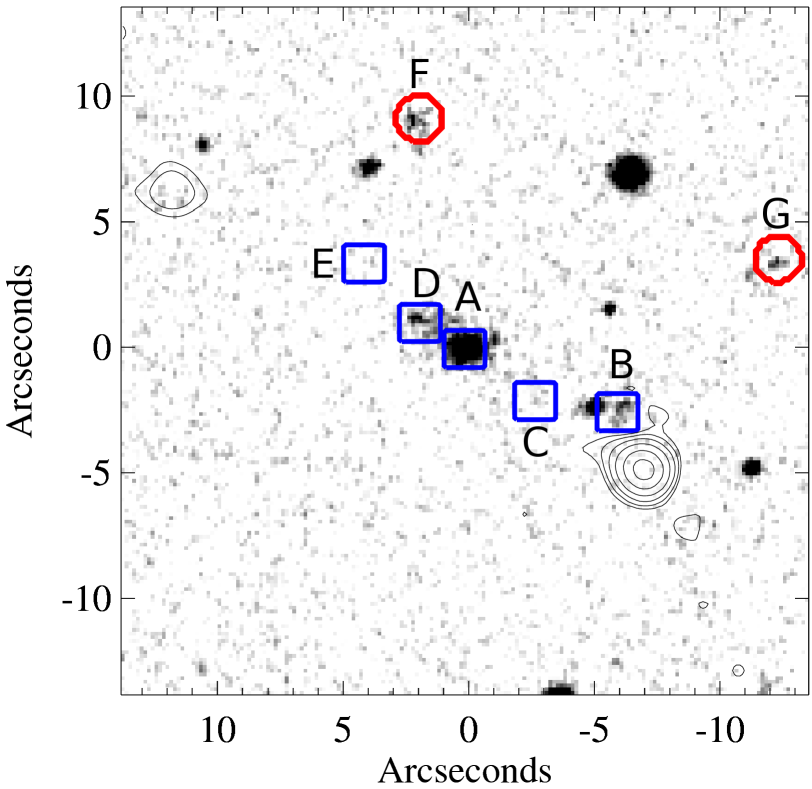
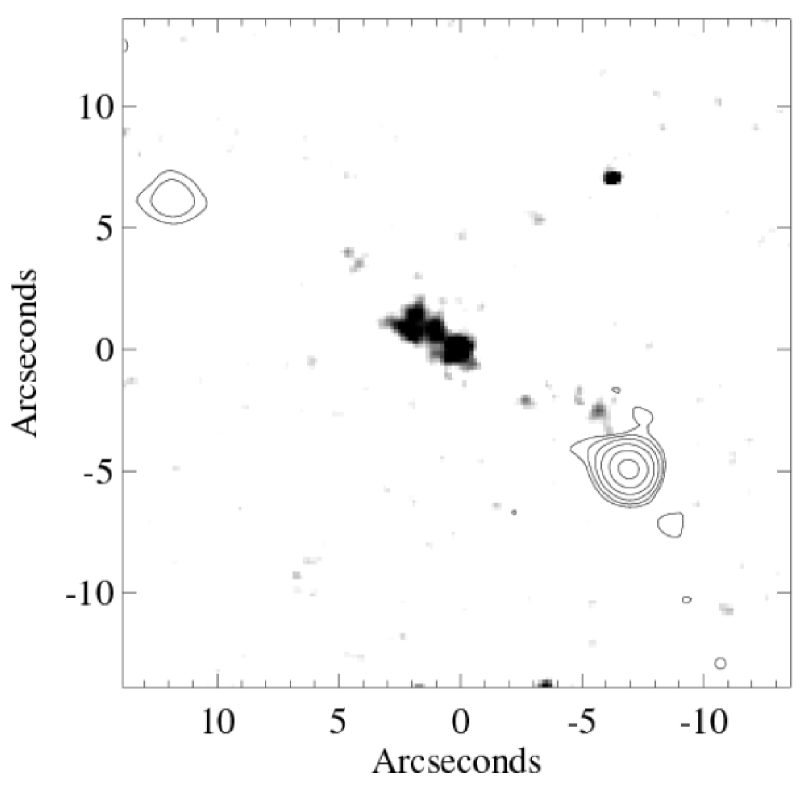
The distribution of z candidates within 100 kpc of 4C 10.48 is shown in Fig. 6, and their properties are listed in Table 3. Within 100 kpc of the radio galaxy there are 5 H candidates, and 2 DRGs. The DRG selection identifies galaxies across a wide redshift range so we cannot assume these DRGs have the same redshift as the radio galaxy. Never the less we show their derived masses assuming they are at .
The stellar masses of the z candidates were estimated from their magnitudes. Contamination by H emission was removed by subtracting the excess flux in the image from the images. The resulting continuum magnitudes are labelled . The relationship between stellar mass and for galaxies at was estimated using Bruzual & Charlot (2003) stellar synthesis models. Six stellar synthesis models were used, all of which assumed the Salpeter (1955) initial mass function (with stellar masses between 0.1 and 100). They have a range of star formation histories, including continuous, and exponentially declining with , , , and Gyr. These models were redshifted to and moderate amounts of dust extinction were applied to the models (up to =2 mag). Finally the models were convolved with the HAWK-I and ISAAC filter bandwidths to obtain the following relation: .
Star formation rates (SFRs) were estimated from the H luminosity of the z candidates assuming they are at and correcting for a 25% contribution from the [Nii] doublet in the bandwidth. SFRs were derived using the Kennicutt (1998) relation appropriate for the Salpeter (1955) initial mass function. This allows one to easily compare with values in the literature. To scale these SFRs and masses to the Chabrier (2003) initial mass function they should be multiplied by a factor of 0.66.
Most of the stellar mass within 100 kpc of the radio galaxy is concentrated in the object A, which presumably is the radio host galaxy. If we only consider the H emitters, more than 80% of the stellar mass lies within the clump labelled A. The instantaneous star formation is more spread out, although object A still contributes 40% of the total SFR. This central concentration of mass and widespread star formation is reminiscent of MRC 1138-262 (Hatch et al., 2009).
We must be cautious about the mass and SFR estimates for object A as this object may contain an active galactic nucleus (AGN) that can contribute to both the H and continuum luminosity. However, object A is significantly extended in both the and images, and there is no evidence of point-like emission from a central unobscured AGN. So it is unlikely that there is a large contribution of light from the AGN. However, a partially obscured AGN could still contaminate the and Hfluxes, and our stellar mass and SFR estimate of this object could be too high.
3.1.4 Radio triggered star formation
The H emitters near the radio galaxy are aligned along the radio jets at a position angle of 58∘. A Monte Carlo simulation of the distribution of the H emitters results in only a 0.08% chance that the H emitters will be randomly orientated in a cone within 13∘ of the radio jets. Therefore their alignment with the radio jets imply a causal connection.
Radio triggered star formation has been observed in several nearby and distant radio galaxies (e.g van Breugel et al., 1985; Bicknell et al., 2000). The alignment of the H emitters with the radio jets suggest this system may be a good candidate for such jet-triggered star formation. However the emitters may also be material that is ionized by the central AGN (see Miley & De Breuck 2008 for a review).
| ID | Mass | SFR | notes | |
|---|---|---|---|---|
| () | () | |||
| A | 141 | 127 | 2.0 | presumed HzRG host |
| B | 12 | 27 | 1.4 | |
| C | 9 | – | ||
| D | 10 | 120 | 1.4 | labelled D+E in |
| Pentericci et al. (2001) | ||||
| E | 19 | – | ||
| F | – | 2.5 | ||
| G | – | 2.6 |
In order to determine whether these are dwarf galaxies or simply clumps of ionized gas we searched for stellar continuum in other wavebands. Objects A, B and D have relatively strong continuum fluxes, likely emitted from an underlying stellar population. The stellar masses of these objects range from to . Object A and its nearest neighbour D lie at approximately the same redshift (Iwamuro et al., 2003), and are possibly interacting or merging as they are joint by a single emission line halo.
Object C is detected in both F606W (25.6 mag) and F160W (22.1 mag) in the Hubble Space Telescope (HST) images of Pentericci et al. (1999, 2001), but object E is not detected in either image. Nebular emission (both continuum and emission lines) contributes to the flux in each of these HST bands so it is difficult to unambiguously determine whether any of the emission is stellar continuum.
We conclude that objects A, B and D are galaxies, whose star formation may be triggered or enhanced by the radio jets. Object D is very bright in H, and has a similar SFR to clump A, however it contains a relatively small amount of mass. If stars were continuously forming in object D at its current rate, its stellar mass could be formed in only 65 Myrs, which is a similar timescale to the lifetime of the radio emission.
The nature of objects C and E is unclear, they may be dwarf galaxies with masses less than , or simply pockets of dense gas ionized by the AGN or undergoing their first burst of star formation. However, the location of these objects suggest that the radio jets are responsible for the enhanced H emission that makes them visible. The massive radio galaxy may be surrounded by several dwarf galaxies, or pockets of Hi gas, that cannot be detected, but may become visible when their line emission increases as they pass through the radio jets.
3.2 Surface density of candidate H galaxies
In this section we compare the density of H emitters in the radio galaxy fields to the control fields. MRC 1138-262 lies in a dense proto-cluster, with many spectroscopically confirmed H emitting members (Kurk et al., 2004a, b). If 4C 10.48 also lies within a proto-clusters, it should be surrounded by a large overdensity of H emitters, of comparable density to the MRC 1138-262 proto-cluster.
3.2.1 NB-excess galaxies

The surface density of excess galaxies per magnitude is the most basic observed quantity which can determine whether a region is overdense or not. The uncertainties and significance of this measurement can be well determined from a counts-in-cells analysis of the control field.
Five of the line-emitters in the 4C 10.48 field are influenced by the radio galaxy (see Section 3.1.2), whilst 3 galaxies lie within the Ly halo of MRC 1138-262, so may also be influenced by the radio source in this field. We are interested in the large-scale structure surrounding these radio galaxies, beyond the immediate influence of the radio jets, so these sources were removed from the catalogues and not included in the remainder of this study.
The surface densities of H candidates surrounding the two radio galaxies 4C 10.48 and MRC 1138-262 are shown in Fig. 7, where they are compared to the control field. The density of excess objects in the GOODS-S field was adjusted to account for the difference in narrow-band filter bandwidths.
The quoted uncertainties are 1 standard deviations resulting from a counts-in-cells analysis measured from 6.9 or 12.5 arcmin2 cells in the control fields. These are the sizes of the 4C 10.48 and MRC 1138-262 fields respectively. The 1 standard deviation of the density of galaxies in a 6.9 arcmin2 cell is 0.27 arcmin-2, and 0.2 arcmin-2 for a 12.5 arcmin2 cell.
There is a large overdensity of NB-excess objects in the radio galaxy fields, with 5 and times more objects surrounding 4C 10.48 and MRC 1138-262 respectively than the control field. The galaxy overdensity111defined as , where is the surface density. of the excess galaxies around 4C 10.48 is , and in the MRC 1138-262 field. The significance222Significance of these overdensities are 5 for 4C 10.48 and 8 for the MRC 1138-262 proto-cluster.
The highly significant overdensity around 4C 10.48 implies this radio galaxy also resides in a dense large-scale structure that extends beyond the immediate influence of the radio galaxy, at least out to distances of 0.75 Mpc (physical). 4C 10.48 probably lies within a proto-cluster, or proto-group environment of a similar density as that of MRC 1138-262.
3.2.2 H candidates
In Section 2.3.2 we showed that more than half of the excess objects selected in the control fields were not H emitters at , but rather line-emitting contaminants at other redshifts. To measure the true surface overdensity of H emitters in the radio galaxy fields, the excess sources that are not H emitters must be removed. Unfortunately we are unable to apply the same colour selection we applied to the control field samples as we do not have the same multi-band data.
The density of excess objects in the control field that are not H emitters is 0.13 arcmin-2 ( mag). Therefore less than 1 excess contaminant is expected in the 6.87 arcmin2 field around 4C 10.48, and less than 2 excess contaminants in the arcmin2 field around MRC 1138-262. Whereas we observed 11 and 24 excess objects with mag near 4C 10.48 and MRC 1138-262 respectively. Hence less than 10% of these objects are likely to be contaminants. We ignored this negligible fraction of contaminants and assumed that all the excess objects in the MRC 1138-262 and 4C 10.48 fields are H emitters at .
This assumption is supported by the spectroscopic data on µm excess objects near radio galaxies. Kurk et al. (2004b) showed that all spectroscopically confirmed excess sources near MRC 1138-262 are likely to be H emitters associated with the radio galaxy, as their velocity distribution is much more peaked than the filter response curve. Furthermore, µm excess objects have recently been studied around the proto-cluster near 4C 23.56 (Tanaka et al., 2010). All 3 excess objects, for which spectra were obtained, exhibited an emission line within 230 of 4C 23.56, indicating they lie in a proto-cluster associated with the radio galaxy.
The H emitters in the control fields were separated from the contaminants using their optical colours (see Section 2.3.2). However, 7 galaxies were not detected in one or more of the , or images. Three (45%) of these excess objects are likely to be H emitters, and their flux distribution was obtained using a bootstrap analysis. We resampled 3 out of the 7 galaxies not detected in the , or images 1000 times to obtain the flux distribution of the non-detected galaxies. This distribution was then combined with the flux distribution of detected galaxies.
The surface density of field H emitters is shown as the triple dot-dashed line in Fig. 7. The overdensity of H emitters is (5) near 4C 10.48, and (9) near MRC 1138-262. We conclude that both radio galaxies lie within dense environments, of comparable density, and are possibly the progenitors of present day galaxy clusters or groups.
The narrow-band filters used to detect the H candidates cover a co-moving radial distance of Mpc at , but the large-scale structures associated with the radio galaxies are likely to extend only Mpc (Hatch et al., 2011). Therefore the surface overdensities given above are lower limits to the volume overdensity of the large-scale structures associated with the radio galaxies.
3.3 Comparison of proto-cluster and control field H emitters
We have shown that the H emitters near the radio galaxies exist in an environment that is at least 10 times denser than the control fields. In this Section we examine how the star formation rate and stellar mass of the H emitting galaxies depend on environment, by comparing the H and continuum luminosity functions of emitters in the dense radio galaxy fields to emitters in the control fields.
3.3.1 H luminosity function
Continuum magnitudes in the band, labelled , were determined by subtracting the flux observed in the image from the images:
| (2) |
where wx is the width of filter , and is the flux in filter . H+[Nii] line fluxes (abbreviated to ), were then obtained by subtracting the flux from the flux:
| (3) |
We assumed all excess sources in the radio galaxy fields are H emitters since less than 10 per cent are expected to be interlopers (see discussion in Section2.3.2). However contaminants were removed from the control field sample using optical and infrared colour selection, since more than half of the excess sources are not H emitters at .
In order to compare the field and proto-cluster samples it is essential that galaxies in the different fields are selected to the same limit. Therefore both the radio galaxy and control field catalogues were limited to galaxies brighter than mag, i.e., including only galaxies that are brighter than the 95% completion limit of the shallowest field. Sources within 100 kpc of the radio galaxies were excluded as these may be influenced by the radio jets, however, including these galaxies does not change our results.
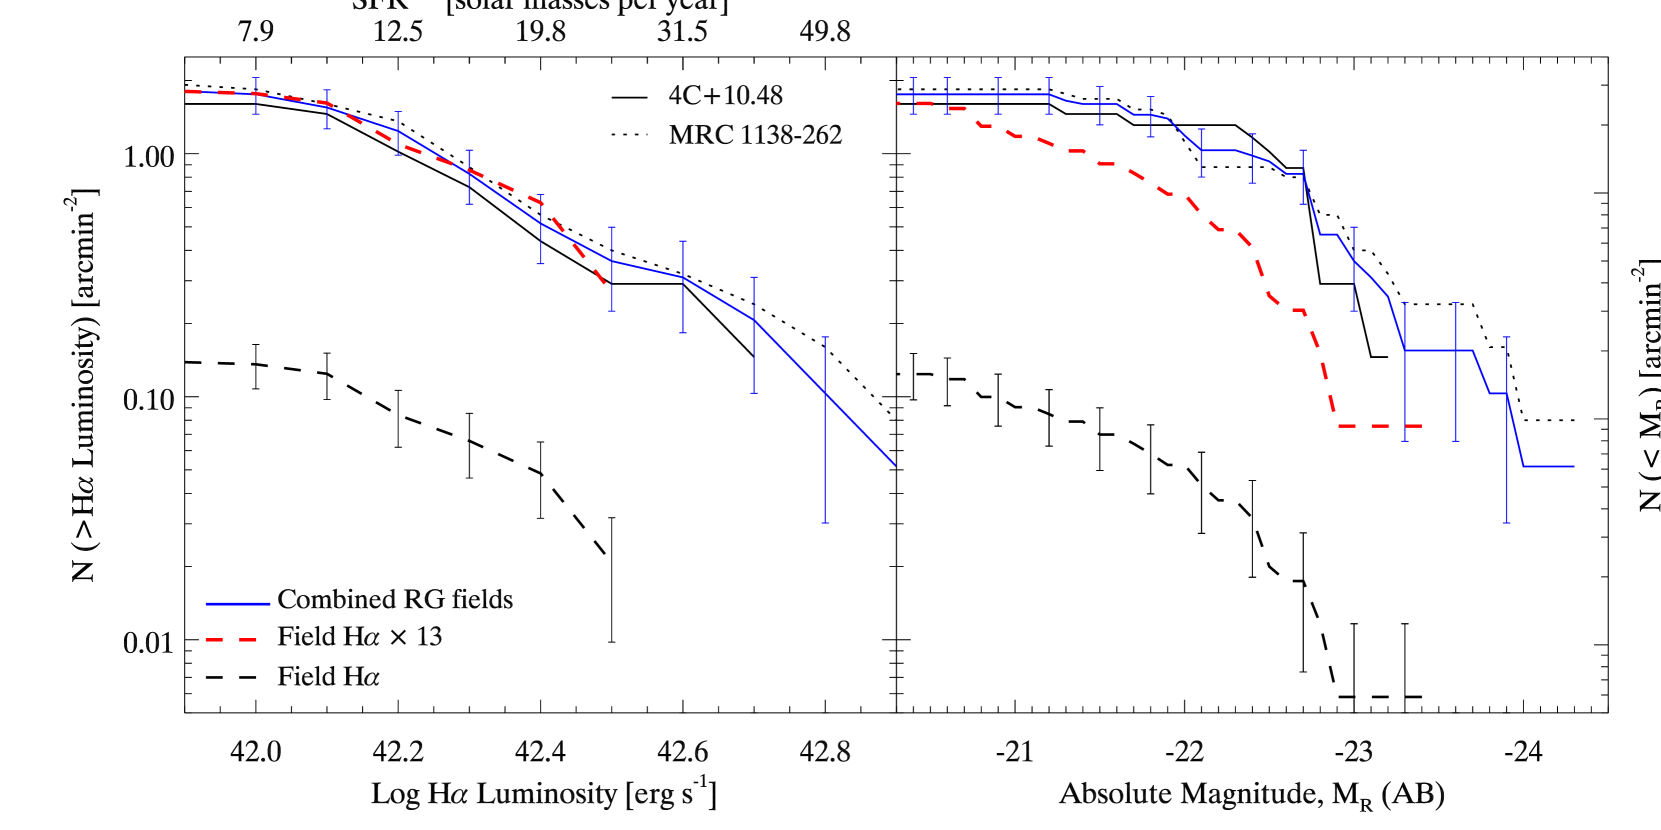
The left panel of Fig. 8 compares the cumulative H LF of H emitting candidates detected in the dense radio galaxy fields to the control field. The normalisation of the control field H LF is times below that of the 4C 10.48 field, and times below the MRC 1138-262 proto-cluster, at all H luminosities.
We combined the galaxies in the 4C 10.48 and MRC 1138-262 fields together to form the distribution of the ‘average’ radio galaxy field (or average proto-cluster), and plot this as a blue line. The dashed red line shows the control field H LF re-normalised to match the density of the averaged radio galaxy fields. The re-normalised LF is in complete agreement with the LF of the radio galaxy fields. A Kolmogorov-Smirnov (KS) test of the two groups results in a probability of 97%, so there is no difference in H luminosities of galaxies in different environments at . The simplest interpretation of this is that there are more star forming galaxies in the proto-clusters, but the dense environment does not greatly alter the H luminosities of the star forming galaxies.
3.3.2 Rest-frame band luminosity function
For galaxies at the observed luminosity approximately corresponds to the light within the rest-frame band, so the observed magnitudes were converted into continuum absolute magnitudes. The band luminosity functions (-LFs) of the H emitters in the dense radio galaxy fields and the control field are shown in the right panel of Fig. 8.
The completion limit of the -LFs is hard to define since the galaxies were selected in not . However the H emitters were selected in exactly the same manner from each dataset, and only galaxies up to the 95% completion limit of the shallowest field were included. Therefore all datasets are consistent and we can robustly compare the LFs at faint magnitudes.
The density of control field galaxies with is times below that of the density in the 4C 10.48 field and times below the MRC 1138-262 field. This is consistent with the overdensities derived from the H LFs. The shape of the MRC 1138-262 and 4C 10.48 -LFs are similar suggesting that the H emitters in both dense fields have similar luminosities.
The red dashed line is the control field -LF re-normalised to the average proto-cluster density. By construction, the faint end of these cumulative LFs match, and the red line cannot be shifted up any further. Any discrepancy in the shapes of the LFs must therefore be due to differences in the luminosities of the galaxies in different environments.
Although the -LFs of the two dense radio galaxy fields are in close agreement, the shape of the control field -LF does not resemble the proto-clusters -LFs. The slope of the control field -LF is steeper and lies below the proto-cluster LFs. A KS test of the two groups of H emitters results in a probability of 0.05. This means there is a statistically significant difference between the continuum luminosities of galaxies from the different environments. The median difference in band luminosity between the two samples is magnitudes. Therefore the H emitting galaxies within the dense environment are typically 0.8 mag brighter than their field counterparts.
These -LFs provide further evidence that the H candidates near 4C 10.48 are associated with the radio galaxy. The 4C 10.48 -LF matches the proto-cluster -LF of the MRC 1138-262 field, but not the control field -LF. Therefore the H emitters near 4C 10.48 are likely to be in a large-scale structure such as a proto-cluster.
4 Discussion
4.1 SFRs and stellar masses of galaxies in dense environments
In the previous section we derived the LFs of the observed quantities. In this section we discuss the physical quantities that are derived from the observables, namely star formation rate (SFR) and stellar mass.
4.1.1 Star formation rates
The H luminosities may be converted into SFRs if the H flux is due to photoionisation by young stars, and not AGN. Only 1 out of the 13 H emitters in the COSMOS field were detected in X-rays (Brusa, 2007), whilst only 1 out of 40 candidates near MRC 1138-262 were detected in X-rays (not including the radio galaxy), to a similar detection limit of in the soft X-ray band (Pentericci et al., 2002). Additionally, only 1 out of 7 of the GOODS H emitters was detected in the 2 Msec Chandra Deep Field South image (Luo et al., 2010), however, it has a soft X-ray flux slightly below the detection limit of the MRC 1138-262 data. From these low detection rates we infer that the H emitters are predominantly star forming galaxies, and the AGN contamination of both proto-clusters and field samples is likely to be low.
Fig. 8 shows that the normalisation of the proto-cluster H LFs differ from the control field, but the shape of the LFs are consistent. Thus there are more star forming galaxies in the proto-clusters than the field, but the dense environment does not alter the star formation rates of these star forming galaxies. If the SFRs of the proto-cluster galaxies were lower than that of field galaxies, the slope of the proto-cluster H LF would be steeper and would lie below the field H LF. Therefore the shape of the H LFs imply that the SFRs of strongly star-forming galaxies are not greatly affected by their environment.
This is similar to what is observed in low and intermediate redshift clusters (e.g. Balogh et al., 2002; Koyama et al., 2010). The normalisation of the LFs differ, but the shape of the bright-end of the cluster H LFs matches the field. We did not probe the faint end of the H LF, which may depend on environment (at least at ; Sobral et al. 2010). So deeper narrow-band images are required to determine whether the proto-cluster environment affects SFR at .
The SFR-density relation in the distant Universe is a controversial topic as some studies find the fraction of star forming galaxies decreases with density (Patel et al., 2009), while others find that it stays constant or even increases (Elbaz et al., 2007; Cooper et al., 2008; Ideue et al., 2009; Tran et al., 2010). Unfortunately we have no measure of the non-star forming galaxy population in the proto-clusters, so we are unable to measure the fraction of star forming galaxies. The passive and weakly star forming populations within proto-cluster remain elusive as photometric redshifts at are not reliable enough to determine cluster membership.
We used the difference in normalisation between the proto-clusters and control field H LFs to derive the SFRs for the entire proto-clusters. The SFR density of the field at , determined from H emission, is 0.215Mpc-3 (Hayes et al., 2010), so the total SFR observed within the 6.87 arcmin2 field around 4C 10.48 is , and within the 12.5 arcmin2 field around MRC 1138-262. There is no observed edge to the extent of the galaxy overdensity in these fields, and the rates do not include the radio galaxies, so these are lower limits to the total SFR in the proto-clusters. These proto-clusters are sites of intense star formation, much more so than local clusters, whose SFRs are typically only a few hundred solar masses per year (Koyama et al., 2010).
4.1.2 Stellar masses
The rest-frame band luminosity may be used as a proxy for stellar mass, however, the mass-to-light ratio of galaxies depends on the age of the stellar population. In order to use the band luminosities to compare the masses of the field and proto-cluster galaxies, we first checked whether the ages of the stellar populations in these samples are consistent.
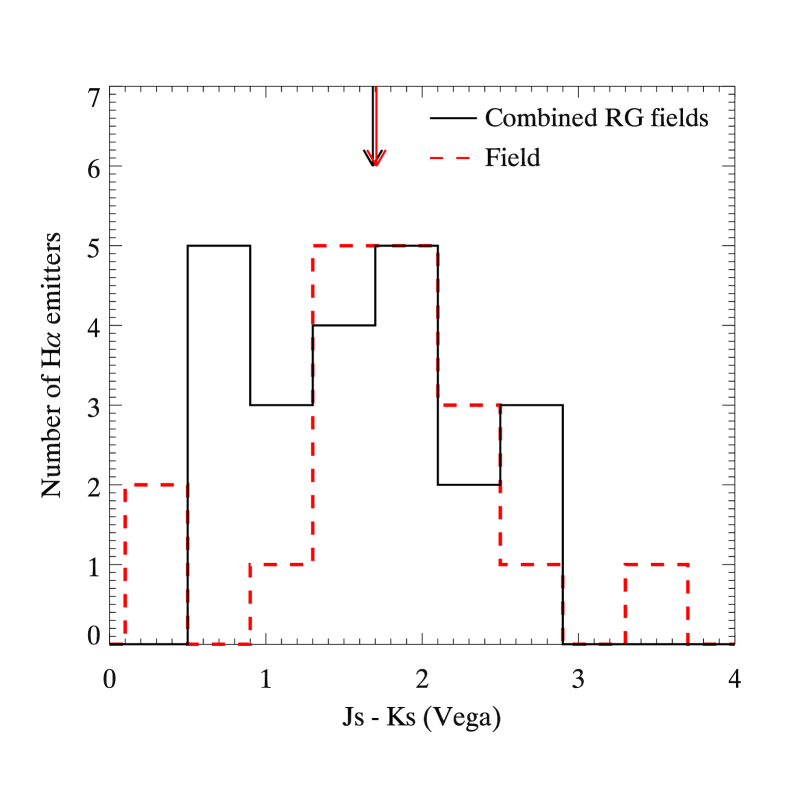
For H emitters at the colour is the rest-frame colour. This colour is a good indicator of the average age of the stellar population, (although this colour is also affected by dust reddening). Fig. 9 compares the colours of the H emitters within the proto-clusters to those in the control field. No correction was applied to account for the difference in filter passband (e.g., and ).
The colour distributions are broad, implying H is emitted from galaxies with a wide range of stellar ages and dust contents. But the median colours of both populations are very similar () and there is no significant difference in the distribution of these populations: a KS test results in a probability of 67%.
Since the colours of the field galaxies do not differ from the proto-cluster galaxies we conclude that the mass-to-light ratios of the populations are similar, so the band luminosity can be considered a proxy for stellar mass. However the distributions do differ slightly: there are a higher fraction of blue galaxies in the proto-clusters than in the field sample.
We have shown that H emitters in dense environments are typically 0.8 mag brighter than similarly selected galaxies from the control field. This luminosity difference corresponds to a factor of 2 increase in stellar mass, so the proto-cluster galaxies are typically twice as massive as the control field galaxies.
We have interpreted the observed luminosity difference between the proto-cluster and field galaxies as a difference in stellar mass, however, this is not the only possible interpretation. A similar luminosity offset could be observed if the proto-cluster galaxies were younger and had shorter star formation timescales than the field galaxies. We do not have enough information in the limited dataset presented in this article to decisively differentiate between these two interpretations, however the similar colours implies the ages of the galaxies in both samples do not differ greatly. This suggests that the luminosity difference is likely caused by a difference in stellar mass.
The literature provides further supporting evidence for this interpretation. Steidel et al. (2003) also found that the stellar masses of galaxies in a proto-cluster are twice as massive as similarly selected galaxies in the field, and Kuiper et al. (2010) found a similar result for Lyman break galaxies in a proto-cluster. Furthermore, Tanaka et al. (2010) found the ages of galaxies in the MRC 1138-262 proto-cluster were similar to those in the field. Thus is it likely that the luminosity difference observed in the -LF is caused by a systematic difference in stellar mass between proto-cluster and field galaxies.
In the nearby Universe, both the galaxy mass and luminosity functions change with environment. The characteristic mass and luminosity increase with density, such that clusters typically contain a higher fraction of massive galaxies than the field (e.g. De Propris et al., 2003; Croton et al., 2005; Baldry et al., 2006). This segregation of stellar mass with large-scale environment is seen up to (Salimbeni et al., 2009; Scodeggio et al., 2009), and we have now shown that this segregation persists in the early Universe, at .
Our results suggest that the mass function of cluster galaxies differed from field galaxies, even before the cluster virialized. There is a well-documented relation between galaxy mass and other properties, such as star formation activity and morphology. Therefore the difference in galaxy properties between cluster and field environments may evolve from this difference in mass function at early times.
4.2 Specific star formation rates of proto-cluster galaxies
The proto-cluster and control field galaxies have similar SFRs, but the proto-cluster galaxies are more massive. Hence the proto-cluster galaxies have lower specific star formation rates (SSFRs – SFR per unit stellar mass) than the field galaxies.
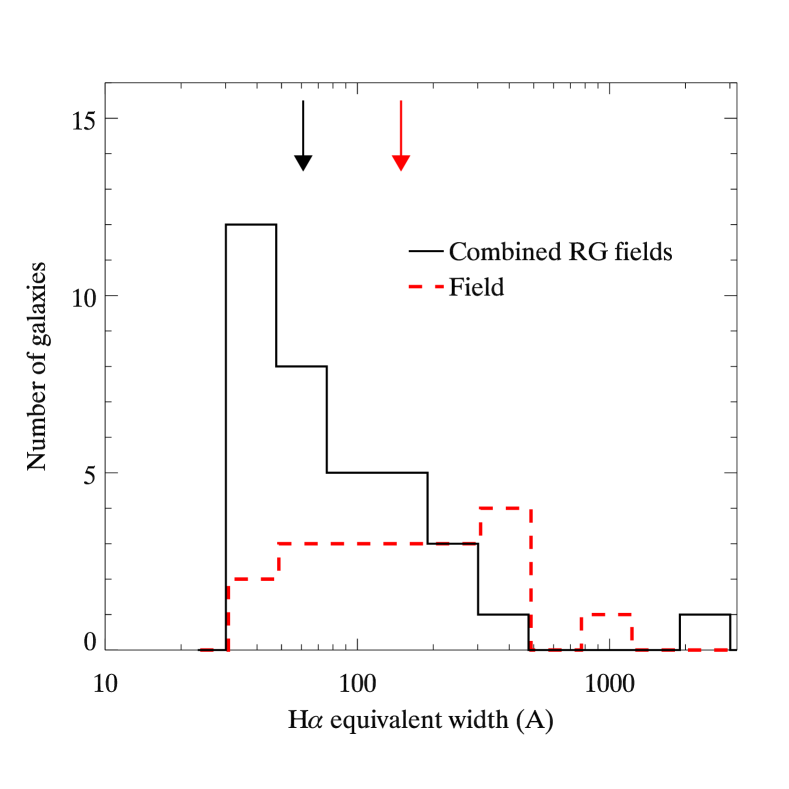
A complementary method to examine the SSFRs of the H emitters is to study their rest-frame H equivalent widths (). The is the ratio of the H line strength (a measure of the SFR of the galaxy) to the underlying continuum (a measure of the stellar light and mass). Hence the of the H emission line measures the SSFR of the galaxy. Since the LFs in Fig. 8 suggest that the SSFRs of the proto-cluster and field galaxies differ, we expect a significant difference between the distribution of s from these two populations.
Fig. 10 compares the s of galaxies in the 2 radio galaxy field, to the H emitters in the control fields. Only galaxies with magnitudes brighter than the 95% completeness limit of the shallowest data are included in the sample.
The proto-cluster galaxies typically have lower s than the field galaxies. The median of the field population is 150Å, whilst the median of the proto-cluster population is only 60Å. Comparing the s of these populations with the KS test results in a probability of 0.13, which is low, but not significant. The Mann-Whitney U-test, which compares the difference in the mean of the two populations results in a probability of 0.01. Thus these populations have statistically different means, and are therefore not likely to be drawn from the same parent distribution. Therefore we confirm our finding that proto-cluster galaxies have lower SSFRs than their counterparts in the field.
The lower SSFRs of the proto-cluster galaxies imply they formed more of their stars earlier than field galaxies. A similar result was found by Tanaka et al. (2010), who performed spectral energy distribution fitting of proto-cluster candidates near MRC 1138-262. They found that the proto-cluster galaxies have shorter star formation timescales than field galaxies, but similar ages. Thus they also found that the MRC 1138-262 proto-cluster galaxies formed most of their stars earlier than field galaxies. These results suggest that galaxy growth is accelerated in proto-clusters relative to the field, as predicted by Gunn & Gott (1972).
4.3 Measuring the galaxy overdensity of proto-clusters
Three different measures of the overdensity of star forming galaxies near the radio galaxies have been presented: (i) the overdensity of H emitters per unit magnitude, (ii) the overdensity of SFR determined by the relative normalisations of the H LFs, (iii) the overdensity of H emitters per unit rest-frame band (continuum) magnitude. All three measures show that there is a larger number of star forming galaxies near the radio galaxies than in the control field. To estimate the mass and collapse time of the proto-cluster we need the galaxy and mass overdensity of the proto-cluster. Do any of these measurements provide us with the true galaxy overdensity of a proto-cluster?
Since we do not know whether the fraction of star forming galaxies increases or decreases in dense environments at , we cannot use the normalisation of the H LF relative to the field to obtain the galaxy overdensity of the proto-cluster. This normalisation only tells us the overdensity of star-forming galaxies in the proto-cluster, not about the total number of galaxies in the proto-cluster. For example, using the density of H emitters to measure the galaxy overdensity of a local cluster would underestimate the true galaxy overdensity because star formation is suppressed in local clusters.
The continuum LF in proto-clusters (and the stellar mass function by inference) differs from the field. So the galaxy overdensity cannot be determined by the excess number of galaxies up to a magnitude limit, as the overdensity will depend on the limit used. For example, there are 12 times more emitters with near 4C 10.48 compared to the field, but 25 times more emitters if we only consider galaxies with .
Finally, since the magnitude of the H emitter is a combination of the continuum and H flux, the density of galaxies per magnitude is affected by both of the above issues. The overdensity per magnitude is therefore hard to interpret in terms of the physical overdensity of galaxies.
To obtain the true galaxy overdensity we must measure the galaxy stellar mass function of all galaxies (passive and star forming) in a proto-cluster, and compare it to the field. This provides a significant observational challenge as precise photometric redshifts at are difficult to achieve, and many proto-cluster galaxies are too faint to obtain a spectroscopic redshift in a reasonable observing time.
5 Summary and conclusions
We compared star forming galaxies in 2 dense proto-clusters to similarly-selected field galaxies. The proto-cluster galaxies were selected from the catalogue of candidate H emitters from the well-studied proto-cluster near MRC 1138-262, and is supplemented with H candidates surrounding the massive radio galaxy 4C 10.48.
We showed that 4C 10.48 is situated in a dense environment, with times more H emitters than in the average field ( significance). This is similar to the density of H emitters in the MRC 1138-262 proto-cluster, which has times more H emitter than in the field (). Due to the similar galaxy densities, we suggest that the structure surrounding 4C 10.48 may also evolve into a group or cluster by the present day.
A field sample of H emitters was constructed from 3 separate fields covering a total area of 172 arcmin2. Special care was taken to ensure the field and proto-cluster H emitters were selected in the same fashion, so they could be robustly compared. Other line contaminants (e.g. [Oiii] emitters at ) were removed from the field sample using optical and NIR colours. Based on the density of contaminants in the control fields, the contamination fraction of H candidates in the radio galaxy fields was expected to be negligible ( objects in each field), so no correction was made to remove foreground or background objects in the radio galaxy fields.
We constructed H and continuum luminosity functions of the H emitters in both environments. From a comparison of the two samples we conclude:
-
1.
The normalisation of the H luminosity in these proto-clusters is times greater than the field. Thus the total star formation rate within the central 1.5 Mpc of these proto-clusters exceeds . This is an order of magnitude more than observed in clusters today.
-
2.
Although the normalisation of the H luminosity functions differ, the shape of the field and proto-cluster H luminosity functions are very similar (KS probability of 0.97). We infer this to mean the star formation rate of star forming galaxies does not greatly depend on their environment.
-
3.
The star forming proto-cluster galaxies are typically 0.8 mag brighter in rest-frame than field star forming galaxies. We showed that the (rest-frame ) colours of field and proto-cluster galaxies are consistent, so we used luminosity as a proxy for stellar mass to infer that the proto-cluster galaxies are typically a factor of 2 more massive than their field counterparts. Since many galaxy properties correlate with stellar mass, the mass segregation present in embryonic clusters destines the future cluster galaxies to differ from field galaxies.
-
4.
The specific star formation rates of proto-cluster galaxies are lower than field galaxies, so proto-cluster galaxies form more of their stars earlier than field galaxies. This suggests that, in the early Universe, galaxy growth proceeds at a faster rate in dense environments.
The differences observed between cluster and field galaxies today may not only be driven by environmental nurture effects. They may also arise because the cluster galaxies differed from field galaxies even before the cluster formed, when the Universe was less than a quarter of its current age. Nature, as well as nurture, plays a role in the construction of cluster galaxies.
6 Acknowledgments
We thank Roderik Overzier for providing comments on an early draft of the article, Will Hartley for providing us with the DR8 UDS data and catalogues, and Hendrik Hildebrandt for the UDS band image. We thank the referee for providing helpful suggestions that improved the paper. NAH acknowledges support from STFC and the University of Nottingham Anne McLaren Fellowship. JK thanks the DFG for support via the German-Israeli Project Cooperation grant STE1869/1-1.GE625/15-1.This work is based on observations with ESO Telescopes at the Paranal Observatories under programme IDs: 0.81.A-0932, 082.A-0330 and 0.83.A-0826.
References
- Baldry et al. (2006) Baldry I. K., Balogh M. L., Bower R. G., Glazebrook K., Nichol R. C., Bamford S. P., Budavari T., 2006, MNRAS, 373, 469
- Balogh et al. (2002) Balogh M. L., Couch W. J., Smail I., Bower R. G., Glazebrook K., 2002, MNRAS, 335, 10
- Best et al. (2010) Best P. et al. 2010, ArXiv e-prints
- Best et al. (2003) Best P. N., Lehnert M. D., Miley G. K., Röttgering H. J. A., 2003, MNRAS, 343, 1
- Bicknell et al. (2000) Bicknell G. V., Sutherland R. S., van Breugel W. J. M., Dopita M. A., Dey A., Miley G. K., 2000, ApJ, 540, 678
- Brusa (2007) Brusa M. e. a., 2007, ApJS, 172, 353
- Bruzual & Charlot (2003) Bruzual G., Charlot S., 2003, MNRAS, 344, 1000
- Bunker et al. (1995) Bunker A. J., Warren S. J., Hewett P. C., Clements D. L., 1995, MNRAS, 273, 513
- Capak et al. (2007) Capak P. et al., 2007, ApJS, 172, 99
- Carilli et al. (2002) Carilli C. L., Harris D. E., Pentericci L., Röttgering H. J. A., Miley G. K., Kurk J. D., van Breugel W., 2002, ApJ, 567, 781
- Chabrier (2003) Chabrier G., 2003, PASP, 115, 763
- Cooper et al. (2005) Cooper M. C., Newman J. A., Madgwick D. S., Gerke B. F., Yan R., Davis M., 2005, ApJ, 634, 833
- Cooper et al. (2008) Cooper M. C. et al., 2008, MNRAS, 383, 1058
- Croton et al. (2005) Croton D. J. et al. 2005, MNRAS, 356, 1155
- Daddi et al. (2004) Daddi E., Cimatti A., Renzini A., Fontana A., Mignoli M., Pozzetti L., Tozzi P., Zamorani G., 2004, ApJ, 617, 746
- De Propris et al. (2003) De Propris R. et al. 2003, MNRAS, 342, 725
- Doherty et al. (2010) Doherty M. et al., 2010, A&A, 509, A83+
- Elbaz et al. (2007) Elbaz D., et al., 2007, A&A, 468, 33
- Erben et al. (2009) Erben T. et al., 2009, A&A, 493, 1197
- Franx et al. (2003) Franx M. et al., 2003, ApJ, 587, L79
- Furusawa et al. (2008) Furusawa H. e. a., 2008, ApJS, 176, 1
- Galametz et al. (2010) Galametz A., et al., 2010, A&A, 522, A58+
- Geach et al. (2008) Geach J. E., Smail I., Best P. N., Kurk J., Casali M., Ivison R. J., Coppin K., 2008, MNRAS, 388, 1473
- Gobat et al. (2008) Gobat R., Rosati P., Strazzullo V., Rettura A., Demarco R., Nonino M., 2008, A&A, 488, 853
- Gobat et al. (2011) Gobat R., et al., 2011, A&A, 526, 133
- Gunn & Gott (1972) Gunn J. E., Gott III J. R., 1972, ApJ, 176, 1
- Hatch et al. (2011) Hatch N. A., et al., 2011, MNRAS, 410, 1537
- Hatch et al. (2009) Hatch N. A., Overzier R. A., Kurk J. D., Miley G. K., Röttgering H. J. A., Zirm A. W., 2009, MNRAS, 395, 114
- Hatch et al. (2008) Hatch N. A., Overzier R. A., Röttgering H. J. A., Kurk J. D., Miley G. K., 2008, MNRAS, 383, 931
- Hayes et al. (2010) Hayes M., Schaerer D., Östlin G., 2010, A&A, 509, L5+
- Hildebrandt et al. (2009) Hildebrandt H., Pielorz J., Erben T., van Waerbeke L., Simon P., Capak P., 2009, A&A, 498, 725
- Ideue et al. (2009) Ideue Y. et al., 2009, ApJ, 700, 971
- Ilbert et al. (2009) Ilbert O. et al., 2009, ApJ, 690, 1236
- Iwamuro et al. (2003) Iwamuro F. et al., 2003, ApJ, 598, 178
- Kennicutt (1998) Kennicutt Jr. R. C., 1998, ARA&A, 36, 189
- Kissler-Patig et al. (2008) Kissler-Patig M. et al., 2008, A&A, 491, 941
- Koyama et al. (2010) Koyama Y., Kodama T., Shimasaku K., Hayashi M., Okamura S., Tanaka I., Tokoku C., 2010, MNRAS, 403, 1611
- Kuiper et al. (2010) Kuiper E. et al., 2010, MNRAS, pp 512–+
- Kurk et al. (2004b) Kurk J. D., Pentericci L., Overzier R. A., Röttgering H. J. A., Miley G. K., 2004, A&A, 428, 817
- Kurk et al. (2004a) Kurk J. D., Pentericci L., Röttgering H. J. A., Miley G. K., 2004, A&A, 428, 793
- Kurk et al. (2000) Kurk J. D. et al., 2000, A&A, 358, L1
- Le Fevre et al. (1996) Le Fevre O., Deltorn J. M., Crampton D., Dickinson M., 1996, ApJ, 471, L11+
- Luo et al. (2010) Luo B. et al., 2010, ApJS, 187, 560
- Maschietto et al. (2008) Maschietto F. et al., 2008, MNRAS, 389, 1223
- Miley & De Breuck (2008) Miley G., De Breuck C., 2008, ARA&A, pp 1–+
- Miley et al. (2006) Miley G. K. et al., 2006, ApJ, 650, L29
- Overzier et al. (2008) Overzier R. A. et al., 2008, ApJ, 673, 143
- Overzier et al. (2006) Overzier R. A., Miley G. K., Bouwens R. J., Cross N. J. G., Zirm A. W., Benítez N., Blakeslee J. P., Clampin M. e. a., 2006, ApJ, 637, 58
- Patel et al. (2009) Patel S. G., Holden B. P., Kelson D. D., Illingworth G. D., Franx M., 2009, ApJ, 705, L67
- Pentericci et al. (2002) Pentericci L., Kurk J. D., Carilli C. L., Harris D. E., Miley G. K., Röttgering H. J. A., 2002, A&A, 396, 109
- Pentericci et al. (2000) Pentericci L. et al., 2000, A&A, 361, L25
- Pentericci et al. (2001) Pentericci L., McCarthy P. J., Röttgering H. J. A., Miley G. K., van Breugel W. J. M., Fosbury R., 2001, ApJS, 135, 63
- Pentericci et al. (1999) Pentericci L., Röttgering H. J. A., Miley G. K., McCarthy P., Spinrad H., van Breugel W. J. M., Macchetto F., 1999, A&A, 341, 329
- Retzlaff et al. (2010) Retzlaff J., Rosati P., Dickinson M., Vandame B., Rité C., Nonino M., Cesarsky C., GOODS Team 2010, A&A, 511, A50+
- Salimbeni et al. (2009) Salimbeni S. et al., 2009, A&A, 501, 865
- Salpeter (1955) Salpeter E. E., 1955, ApJ, 121, 161
- Santini et al. (2009) Santini P. et al., 2009, A&A, 504, 751
- Scodeggio et al. (2009) Scodeggio M. et al. 2009, A&A, 501, 21
- Seymour et al. (2007) Seymour N. et al., 2007, ApJS, 171, 353
- Sobral et al. (2010) Sobral D. et al., 2010, MNRAS, pp 1657–+
- Steidel et al. (2003) Steidel C. C., Adelberger K. L., Shapley A. E., Pettini M., Dickinson M., Giavalisco M., 2003, ApJ, 592, 728
- Tanaka et al. (2010) Tanaka I., et al., 2010, ArXiv e-prints
- Tanaka et al. (2010) Tanaka M., De Breuck C., Venemans B., Kurk J., 2010, A&A, 518, A18+
- Thomas et al. (2005) Thomas D., Maraston C., Bender R., Mendes de Oliveira C., 2005, ApJ, 621, 673
- Tran et al. (2010) Tran K. et al., 2010, ApJ, 719, L126
- van Breugel et al. (1985) van Breugel W., Filippenko A. V., Heckman T., Miley G., 1985, ApJ, 293, 83
- van Dokkum & van der Marel (2007) van Dokkum P. G., van der Marel R. P., 2007, ApJ, 655, 30
- Vandame (2004) Vandame B., 2004, PhD Thesis, Nice University, France
- Venemans et al. (2007) Venemans B. P. et al., 2007, A&A, 461, 823