The VAST Survey – I. Companions and the unexpected X-ray detection of B6–A7 stars
Abstract
With an adaptive optics imaging survey of 148 B6-A7 stars, we have tested the hypothesis that unresolved lower-mass companions are the source of the unexpected X-ray detections of stars in this spectral type range. The sample is composed of 63 stars detected in X-rays within the ROSAT All-Sky Survey and 85 stars that form a control sample; both subsets have the same restricted distribution of spectral type, age, X-ray sensitivity and separation coverage. A total of 68 companion candidates are resolved with separations ranging from 03 to 262, with 23 new detections. The multiple star frequency of the X-ray sample based on companions resolved within the ROSAT error ellipse is found to be . The corresponding control sample multiple star frequency is three times lower at – a difference of . These results are presented in the first of a series of papers based on our Volume-limited A-Star (VAST) survey – a comprehensive study of the multiplicity of A-type stars.
keywords:
binaries: general – stars: early-type, imaging – X-rays: stars – techniques: high angular resolution1 Introduction
The detection of X-ray emission from Main Sequence stars is common (Vaiana et al., 1981), with the notable exception of late B- and early A-type stars (e.g. Stauffer et al., 1994). Two distinct generation mechanisms are responsible for the X-ray emission, related to the different stellar structure of massive O- and B-type stars and lower mass F- to M-type stars. For the massive stars, the hot stellar winds cause X-ray emission, while the lower mass stars produce X-rays from the confinement of superheated plasma within their magnetic fields.
Radiative winds driven by line-absorption and re-emission within the extended atmospheres of O- and early B-type stars form a key component of the model for X-ray emission from these massive stars (e.g. Lucy & White, 1980). Wind shocks caused either through instability generated through radiative driving (Owocki et al., 1988), or due to collisions of magnetically driven wind streams (Feldmeier et al., 1997) are thought to be the primary X-ray generation mechanisms. Interaction between stellar winds and surrounding material is also thought to produce X-rays (e.g. Giampapa et al., 1998).
For lower mass stars, stellar winds are too weak to generate X-rays, and the stellar corona is responsible for the emission of X-rays and is intrinsically linked to the magnetic field. For late A- to early M-type stars, magnetic fields arise from the dynamo caused by the differential rotation at the interface between the convective envelope and the radiative core (Spiegel & Weiss, 1980). The magnetic field generated by the dynamo process is essential for confining the superheated plasma necessary for X-ray generation (Güdel, 2004). The heating mechanism required to maintain the corona at temperatures greater than K was originally thought to be acoustic waves (e.g. Schwarzschild, 1948; Schatzman, 1949), while current models involve Alfvén waves travelling perpendicular to the magnetic field (e.g. De-Pontieu et al., 2007; Jess et al., 2009). Localised magnetic reconnection events within the chromosphere are also a potential source of coronal heating through Joule heating (e.g. Sturrock, 1999). Beginning at a spectral type of M3 (), the stars become fully convective (Chabrier & Baraffe, 1997) and the high level of magnetic activity observed (e.g. Randich, 2000) may be due to an -type dynamo generation mechanism (Chabrier & Küker, 2006), in which turbulent motions are able to generate large-scale magnetic fields.
In addition to the emission mechanisms intrinsic to the star, X-rays can be generated by processes involving binary systems. Accretion of material within cataclysmic variable systems (e.g. Patterson & Raymond, 1985) and compact object binaries (e.g. Shapiro et al., 1976) can produce X-ray fluxes. For stars between spectral types B6 to A7, which are expected to be X-ray quiet, the presence of a low-mass companion can lead to the detection of X-rays which are assigned to the primary if the companion is unknown. This study is designed to explore the hypothesis that unresolved lower mass companions are the true source of the unexpected X-ray detections from B6-A7 stars.
2 Previous observations
2.1 X-ray detection of B6-A7 stars
Early studies of stellar X-ray emission conducted with the Einstein Observatory measured a notable decrease in the fraction of X-ray detected A-type stars () compared to bluer and redder stars (Topka et al., 1982; Schmitt et al., 1985). Out of the 35 A-type stars observed by Schmitt et al. (1985), only 7 were detected and 4 were listed as having a secondary component which could be the source of the X-ray emission. Einstein observations of coeval stellar groups also showed a similar decrease in the fraction of X-ray detections of A-type stars between (e.g. Micela et al., 1985; Schmitt et al., 1990).
The increased sensitivity provided by the ROSAT mission and all-sky coverage led to the detection and characterisation of a significant number stellar X-ray sources (Voges et al., 1999). A search by Huensch et al. (1998b) of the Bright Star Catalogue (Hoffleit, 1964) and the ROSAT Bright Source Catalogue for objects within 90 of the same position defined a population of 232 B6-A7 X-ray detected stars. To investigate possible sources of the X-ray emission for this sample, the X-ray luminosity was compared with spectral type, spectral peculiarities and rotational velocities (e.g. Simon et al., 1995; Schröder & Schmitt, 2007). The lack of a dependence on any of these factors was taken as evidence of unresolved companions. Without a comprehensive binary survey of A-type stars, it was not possible to test the companion hypothesis directly. Similarly, X-ray data from Chandra which could resolve the emission source in tight () binary systems does not exist for a significant sample of X-ray B6-A7 stars.
2.2 High-resolution imaging companion searches
High resolution AO imaging studies of X-ray detected B- and A-type stars have been employed to search for lower mass stars capable of producing X-rays. Pointed observations of late B-type stars with known lower mass companions (e.g. Schmitt et al., 1993; Berghofer & Schmitt, 1994) wide enough to be resolved with the ROSAT High Resolution Imager were obtained to determine the source of the X-ray emission. These observations typically identified the B-type star as the source of X-ray emission, although subsequent high-resolution AO imaging has revealed additional components to several of these systems (e.g. Shatsky & Tokovinin, 2002). Sub-arcsecond binary companions have also been resolved with high-resolution AO imaging of pre-Main Sequence companions to late B-type stars (e.g. Hubrig et al., 2001).
Recent discoveries of low-mass companions to Alcor (Mamajek et al., 2010; Zimmerman et al., 2010) and Virginis (Hinkley et al., 2010) have both noted that the unexplained X-ray emission from the primary can be explained by the lower-mass companion, and demonstrate how X-ray emission from A-type stars could be a useful tool in searching for low-mass companions. The current study expands upon the existing imaging results of X-ray detected B6-A7 stars by observing a large sample of both X-ray stars and a control sample.
3 Sample
| HIP | Name | Hipparcos | Distance | ROSAT Source | Observations | Magnitude | Band | Integration | 2MASS | |||
|---|---|---|---|---|---|---|---|---|---|---|---|---|
| Spectral | Designation | Offset | Error Radius | Tel. | Date | Sources | ||||||
| Type | pc | B - BSC, F - FSC | arcsec | arcsec | sec | arcmin-2 | ||||||
| 5310 | Psc | A3V | 49.42.0 | B - J010757.4+204424 | 4.9 | 14 | Gemini | 16/10/2008 | 5.220.02 | K | 200 | 0.156 |
| 9480 | 48 Cas | A3IV | 35.80.7 | B - J020156.9+705432 | 7.6 | 8 | CFHT | 01/09/2009 | 4.250.27 | K | 480 | 0.868 |
| 11569 | Cas | A5p | 43.41.5 | B - J022902.9+672407 | 6.4 | 8 | CFHT | 05/02/2010 | 4.250.03 | K | 330 | 1.088 |
| 13133 | RZ Cas | A3Vv+ | 62.52.4 | B - J024854.7+693804 | 4.3 | 7 | Gemini | 14/11/2008 | 5.470.02 | K | 400 | 0.767 |
| 17608 | Merope | B6IVe | 110.112.6 | F - J034620.7+235713 | 24.5 | 13 | AEOS | 04/02/2002 | 4.140.03 | I | 300 | 0.207 |
| 17664 | B9.5V | 150.122.3 | F - J034659.4+243049 | 23.5 | 23 | AEOS | 02/03/2003 | 6.790.01 | I | 599 | 0.216 | |
| 17923 | A0V | 158.736.8 | B - J034958.2+235109 | 13.8 | 14 | AEOS | 03/02/2002 | 6.740.01 | I | 289 | 0.212 | |
| 19949 | A2Vn | 108.28.8 | F - J041642.9+533649 | 6.7 | 16 | AEOS | 05/02/2002 | 5.150.00 | I | 300 | 0.749 | |
| 20070 | b Per | A2V | 97.68.3 | B - J041814.8+501747 | 3.7 | 7 | AEOS | 05/02/2002 | 4.440.03 | I | 300 | 0.800 |
| 20156 | A7V | 79.45.3 | B - J041913.6+500254 | 3.6 | 8 | AEOS | 05/02/2002 | 5.230.01 | I | 300 | 0.781 | |
| 20380 | A3V | 95.06.1 | F - J042149.8+563020 | 16.8 | 27 | AEOS | 05/02/2002 | 5.790.00 | I | 300 | 0.677 | |
| 20400 | 60 Tau | A3m | 45.72.0 | F - J042204.5+140440 | 14.7 | 27 | AEOS | 04/02/2002 | 5.380.03 | I | 300 | 0.150 |
| 20484 | 63 Tau | A1m | 47.21.8 | F - J042325.5+164633 | 8.1 | 28 | AEOS | 04/02/2002 | 5.330.03 | I | 300 | 0.180 |
| 20648 | Tau | A2IV | 45.31.6 | F - J042528.4+175512 | 31.8 | 14 | AEOS | 04/02/2002 | 4.240.03 | I | 300 | 0.189 |
| CFHT | 04/02/2010 | 4.100.03 | K | 352 | 0.317 | |||||||
| 21402 | 88 Tau | A5m | 46.11.7 | B - J043538.5+100941 | 11.6 | 8 | AEOS | 04/02/2002 | 4.060.02 | I | 300 | 0.171 |
| 22287 | 4 Cam | A3m | 49.72.0 | F - J044758.6+564531 | 14.6 | 18 | AEOS | 05/02/2002 | 5.080.03 | I | 300 | 0.506 |
| 23040 | 7 Cam | A1V | 115.210.8 | B - J045714.3+534442 | 34.8 | 10 | AEOS | 05/02/2002 | 4.390.03 | I | 300 | 0.545 |
| 23179 | Aur | A1V | 48.82.2 | B - J045915.4+375330 | 5.2 | 7 | Gemini | 15/11/2008 | 4.920.03 | K | 200 | 1.125 |
| 23875 | Eri | A4III | 27.20.6 | B - J050750.5-050455 | 17.3 | 10 | Gemini | 19/12/2009 | 2.400.22 | K | 200 | 0.274 |
| 24019 | A5m | 54.73.9 | F - J050945.2+280209 | 20 | 12 | AEOS | 04/02/2002 | 5.690.01 | I | 300 | 0.466 | |
| 26126 | 38 Ori | A2V | 105.88.3 | F - J053416.4+034623 | 23.4 | 17 | AEOS | 05/02/2002 | 5.250.03 | I | 300 | 0.322 |
| 28614 | Ori | A1Vm | 46.51.8 | B - J060222.9+093854 | 4.6 | 9 | Gemini | 19/12/2009 | 3.640.26 | K | 200 | 0.995 |
| 29997 | A0Vn | 53.91.9 | F - J061849.6+691929 | 18.7 | 14 | CFHT | 01/09/2009 | 4.670.02 | K | 480 | 0.310 | |
| 30060 | 2 Lyn | A2Vs | 45.72.0 | F - J061938.6+590019 | 22.4 | 20 | AEOS | 05/02/2002 | 4.400.00 | I | 300 | 0.243 |
| CFHT | 01/09/2009 | 4.350.02 | K | 480 | 0.364 | |||||||
| 30419 | Mon | A5IV | 39.41.6 | B - J062346.2+043544 | 9.9 | 10 | CFHT | 01/09/2009 | 3.920.04 | K | 480 | 1.133 |
| 35643 | A7s | 34.50.9 | F - J072119.0+451327 | 20.9 | 22 | AEOS | 02/02/2002 | 5.380.01 | I | 300 | 0.183 | |
| 39095 | A1V | 73.14.3 | F - J075951.6-182353 | 7.4 | 17 | AEOS | 02/02/2002 | 4.510.02 | I | 300 | 0.756 | |
| 39847 | 27 Lyn | A2V | 66.83.1 | F - J080828.5+513040 | 19.3 | 16 | AEOS | 02/02/2002 | 4.710.04 | I | 300 | 0.126 |
| 41564 | A5m | 85.26.8 | B - J082828.5-023051 | 13.9 | 9 | AEOS | 03/02/2002 | 6.060.01 | I | 300 | 0.235 | |
| 42313 | Hya | A1Vnn | 54.92.7 | B - J083740.1+054217 | 11.2 | 11 | AEOS | 04/02/2002 | 4.120.02 | I | 300 | 0.166 |
| AEOS | 01/03/2003 | 4.120.02 | I | 300 | 0.166 | |||||||
| 44127 | Uma | A7V | 14.60.2 | B - J085913.0+480227 | 5.9 | 11 | Palomar | 12/04/2008 | 2.660.24 | K | 71 | 0.145 |
| CFHT | 05/02/2010 | 2.660.24 | K | 352 | 0.145 | |||||||
| 45688 | 38 Lyn | A3V | 37.41.1 | B - J091850.2+364814 | 7.5 | 8 | AEOS | 06/02/2002 | 3.810.03 | I | 300 | 0.081 |
| Palomar | 12/04/2008 | 3.420.35 | K | 71 | 0.124 | |||||||
| 51200 | A2V | 66.33.1 | F - J102728.3+413613 | 9.7 | 13 | CFHT | 04/02/2010 | 5.530.02 | K | 440 | 0.104 | |
| 52913 | 40 Sex | A2IV | 95.910.8 | F - J104917.1-040123 | 4.7 | 14 | AEOS | 02/03/2003 | 6.380.01 | I | 300 | 0.083 |
| 57646 | A3m | 62.73.2 | F - J114915.1+161430 | 6.4 | 12 | AEOS | 02/03/2003 | 5.750.01 | I | 300 | 0.058 | |
| CFHT | 05/02/2010 | 5.350.02 | K | 352 | 0.091 | |||||||
| 58001 | Phecda | A0Ve | 25.60.4 | B - J115352.3+534153 | 25 | 16 | Palomar | 11/04/2008 | 2.490.17 | H | 71 | 0.090 |
| CFHT | 05/02/2010 | 2.430.29 | K | 352 | 0.102 | |||||||
| 59504 | A5m | 33.70.6 | B - J121210.1+773702 | 7.3 | 20 | AEOS | 29/05/2002 | 4.770.00 | I | 300 | 0.103 | |
| 62394 | 34 Vir | A3V | 74.65.2 | F - J124714.4+115723 | 12.5 | 19 | AEOS | 29/05/2002 | 5.980.00 | I | 300 | 0.059 |
| 62572 | A1IIIshe | 93.015.1 | F - J124909.8+832448 | 6.7 | 13 | AEOS | 29/05/2002 | 5.260.00 | I | 300 | 0.126 | |
| 65198 | A2V | 65.33.4 | B - J132141.7+020521 | 7.2 | 8 | AEOS | 02/03/2003 | 5.640.00 | I | 300 | 0.075 | |
| CFHT | 13/06/2008 | 5.600.05 | H | 450 | 0.103 | |||||||
| CFHT | 04/02/2010 | 5.510.02 | K | 440 | 0.115 | |||||||
| 65241 | 64 Vir | A2m | 63.72.9 | B - J132209.8+050918 | 2.6 | 10 | AEOS | 03/03/2003 | 5.820.03 | I | 319 | 0.066 |
| CFHT | 14/06/2008 | 5.670.03 | H | 450 | 0.094 | |||||||
| 65477 | Alcor | A5V | 24.90.3 | F - J132513.8+545920 | 3.9 | 13 | Palomar | 11/04/2008 | 3.300.23 | H | 71 | 0.100 |
| 66249 | Vir | A3V | 22.5 0.4 | F - J133442.6-003530 | 19.6 | 14 | AEOS | 03/03/2003 | 3.270.02 | I | 300 | 0.079 |
| CFHT | 05/02/2010 | 3.220.27 | K | 352 | 0.122 | |||||||
| 66727 | 1 Boo | A1V | 92.87.8 | B - J134040.2+195708 | 12.8 | 11 | AEOS | 03/03/2003 | 5.720.01 | I | 300 | 0.064 |
| 71618 | 33 Boo | A1V | 60.42.0 | B - J143850.0+442418 | 3.7 | 7 | CFHT | 14/06/2008 | 5.280.04 | H | 450 | 0.098 |
| 76376 | A2V | 75.53.0 | B - J153556.8+54375 | 3.3 | 9 | AEOS | 29/05/2002 | 5.720.00 | I | 300 | 0.089 | |
| 76878 | Ser | A2m | 53.22.3 | B - J154154.9+182744 | 6.9 | 15 | AEOS | 29/05/2002 | 5.610.03 | I | 300 | 0.096 |
| 6.9 | 15 | Palomar | 13/07/2008 | 5.300.02 | K | 62 | 0.149 | |||||
| 77336 | Ser | A3V | 77.26.0 | F - J154717.7+140652 | 7.3 | 16 | AEOS | 29/05/2002 | 5.610.00 | I | 300 | 0.108 |
| 80628 | Oph | A3m | 37.51.2 | B - J162748.2-082213 | 4.8 | 9 | Palomar | 12/04/2008 | 4.170.04 | K | 47 | 0.401 |
| 82321 | 52 Her | A2Vspe | 53.71.5 | F - J164914.1+455848 | 12 | 12 | Palomar | 12/07/2008 | 4.580.04 | H | 71 | 0.174 |
| 83223 | A7V | 73.14.6 | F - J170028.6+063456 | 13.4 | 29 | AEOS | 29/05/2002 | 6.330.01 | I | 300 | 0.232 | |
| 85829 | Dra | A4m | 30.60.5 | F - J173216.1+551023 | 1 | 15 | Palomar | 12/04/2008 | 4.160.02 | K | 71 | 0.203 |
| CFHT | 05/02/2010 | 4.160.02 | K | 264 | 0.223 | |||||||
| 87045 | A2Vs | 131.614.2 | B - J174707.6+473648 | 5.2 | 8 | AEOS | 29/05/2002 | 6.370.01 | I | 300 | 0.183 | |
| 87212 | 30 Dra | A2V | 66.52.1 | F - J174904.5+504651 | 2.6 | 34 | Gemini | 24/06/2008 | 4.880.02 | K | 200 | 0.259 |
| Palomar | 12/07/2008 | 4.880.02 | K | 71 | 0.259 | |||||||
| 88771 | 72 Oph | A4IVs | 25.40.5 | F - J180719.8+093411 | 26.4 | 16 | Palomar | 12/04/2008 | 3.410.19 | K | 71 | 0.990 |
| CFHT | 05/02/2010 | 3.410.19 | K | 264 | 0.990 | |||||||
| 89925 | 108 Her | A5m | 57.6 2.0 | F - J182057.4+295146 | 14.8 | 12 | AEOS | 31/05/2002 | 5.370.03 | I | 300 | 0.348 |
| Gemini | 24/06/2008 | 4.990.02 | K | 200 | 0.540 | |||||||
| CFHT | 01/09/2009 | 4.990.02 | K | 720 | 0.540 | |||||||
| 91971 | Lyr | Am | 47.11.2 | B - J184446.1+373620 | 3.7 | 9 | CFHT | 13/06/2008 | 3.970.23 | K | 180 | 0.566 |
| 93747 | Aql | A0Vn | 25.50.5 | B - J190526.0+135136 | 22.8 | 12 | CFHT | 13/06/2008 | 3.050.28 | H | 180 | 5.932 |
| 98103 | Aql | A1IV | 63.13.0 | F - J195613.8+112526 | 8.5 | 13 | Gemini | 18/06/2008 | 5.260.02 | K | 200 | 1.778 |
| 102033 | A2V | 82.04.4 | F - J204036.8+294822 | 6.1 | 15 | AEOS | 31/05/2002 | 5.870.00 | I | 300 | 0.993 | |
| 106711 | 74 Cyg | A5V | 63.32.5 | F - J213656.7+402440 | 8.9 | 14 | Gemini | 08/09/2008 | 4.510.02 | K | 200 | 1.218 |
| 109521 | A5V | 54.81.7 | B - J221109.0+504929 | 8.7 | 14 | Gemini | 08/09/2008 | 4.960.02 | K | 200 | 2.059 | |
| 110787 | Cep | A2m | 62.62.0 | F - J22264.9+784709 | 4.5 | 12 | Gemini | 17/08/2008 | 5.540.03 | K | 200 | 0.435 |
| 117452 | Scl | A0V | 44.02.2 | B - J234854.7-280751 | 11.2 | 13 | CFHT | 30/08/2009 | 4.530.02 | K | 480 | 0.112 |
| HIP | Name | Hipparcos | Distance | Observations | Magnitude | Band | Integration | 2MASS Sources | |
|---|---|---|---|---|---|---|---|---|---|
| Spectral Type | pc | Tel. | Date | sec | arcmin-2 | ||||
| 159 | A3 | 59.12.8 | Gemini | 17/10/2008 | 6.210.02 | K | 200 | 0.115 | |
| 2852 | A5m | 49.72.2 | Gemini | 17/10/2008 | 5.420.02 | K | 200 | 0.100 | |
| 3414 | Cas | A5V | 53.52.1 | AEOS | 02/03/2003 | 4.790.01 | I | 300 | 0.334 |
| Gemini | 16/10/2008 | 4.580.02 | K | 200 | 0.505 | ||||
| 5317 | 41 And | A3m | 60.22.7 | Gemini | 16/10/2008 | 4.770.02 | K | 200 | 0.404 |
| 8122 | A3 | 71.73.8 | CFHT | 30/08/2009 | 6.170.02 | K | 640 | 0.229 | |
| 9487 | Psc | A2 | 42.61.9 | CFHT | 01/09/2009 | 3.620.33 | K | 480 | 0.115 |
| 13717 | A1Vn | 57.93.1 | Gemini | 18/10/2008 | 4.860.02 | K | 200 | 0.115 | |
| 17489 | Celeno | B7IV | 102.611.1 | AEOS | 03/02/2002 | 5.430.03 | I | 300 | 0.207 |
| 17572 | A0V | 103.311.0 | AEOS | 04/02/2002 | 6.770.01 | I | 300 | 0.192 | |
| 17588 | 22 Tau | A0Vn | 108.610.9 | AEOS | 02/02/2002 | 6.410.03 | I | 300 | 0.213 |
| 17791 | A1V | 144.920.8 | AEOS | 04/02/2002 | 6.830.02 | I | 300 | 0.217 | |
| 17847 | Atlas | B8III | 116.714.0 | AEOS | 04/02/2002 | 3.640.03 | I | 300 | 0.214 |
| 20507 | Eri | A2V | 63.93.3 | Gemini | 17/10/2008 | 4.930.02 | K | 200 | 0.187 |
| 20641 | Tau | A7 | 44.21.6 | CFHT | 05/02/2010 | 4.610.02 | K | 352 | 0.362 |
| 20894 | Tau | A7III | 45.71.7 | CFHT | 04/02/2010 | 2.880.26 | K | 440 | 0.307 |
| 21039 | 81 Tau | Am | 44.32.1 | CFHT | 05/02/2010 | 4.900.02 | K | 352 | 0.311 |
| 22192 | EX Eri | A3IV | 57.52.2 | Gemini | 14/11/2008 | 5.720.02 | K | 200 | 0.172 |
| 23554 | A2IV | 60.12.3 | Gemini | 19/12/2009 | 5.340.02 | K | 200 | 0.209 | |
| 23983 | 16 Ori | A2m | 53.92.4 | Gemini | 05/11/2008 | 4.860.02 | K | 200 | 0.403 |
| 25197 | 16 Cam | A0Vne | 104.38.4 | AEOS | 05/02/2002 | 5.230.00 | I | 300 | 0.337 |
| 26309 | A2III-IV | 56.62.3 | Gemini | 14/11/2008 | 5.860.02 | K | 200 | 0.255 | |
| 28360 | Menkalinan | A2IV+ | 25.20.5 | CFHT | 05/02/2010 | 1.780.19 | K | 352 | 0.651 |
| 28910 | Lep | A0V | 52.21.9 | Gemini | 25/11/2008 | 4.520.02 | K | 200 | 0.472 |
| 29711 | A5IVs | 66.53.4 | Gemini | 25/11/2008 | 5.860.02 | K | 200 | 0.729 | |
| 31119 | A3V | 64.83.6 | AEOS | 04/02/2002 | 5.040.01 | I | 300 | 0.706 | |
| Gemini | 11/11/2008 | 4.770.04 | K | 200 | 1.198 | ||||
| 31290 | A3V | 136.118.0 | AEOS | 05/02/2002 | 6.460.01 | I | 300 | 0.402 | |
| 34897 | A5 | 66.43.4 | Gemini | 10/05/2010 | 5.990.02 | K | 200 | 0.293 | |
| 35341 | 65 Aur | A5Vn | 82.16.2 | AEOS | 02/02/2002 | 5.690.01 | I | 300 | 0.207 |
| 35350 | Gem | A3V | 28.90.8 | Palomar | 12/04/2008 | 3.540.26 | K | 68 | 0.489 |
| CFHT | 04/02/2010 | 3.540.26 | K | 440 | 0.489 | ||||
| 38723 | A3p | 60.43.4 | Gemini | 11/11/2008 | 5.400.02 | K | 200 | 0.241 | |
| 40646 | 29 Lyn | A7IV | 93.25.9 | AEOS | 03/02/2002 | 5.460.00 | I | 300 | 0.116 |
| 41152 | A3V | 51.41.9 | AEOS | 06/02/2002 | 5.390.01 | I | 300 | 0.113 | |
| 42806 | Asellus Borealis | A1IV | 48.62.0 | AEOS | 02/03/2002 | 4.640.00 | I | 300 | 0.123 |
| 43570 | A5V | 167.838.8 | AEOS | 04/02/2002 | 6.210.01 | I | 300 | 0.138 | |
| 43932 | Cnc | A7IV | 59.83.3 | AEOS | 06/02/2002 | 5.260.01 | I | 300 | 0.099 |
| 44066 | Cnc | A5m | 53.22.8 | AEOS | 01/03/2003 | 4.130.03 | I | 300 | 0.119 |
| 44901 | 15 UMa | A1m | 29.30.7 | AEOS | 01/03/2003 | 4.190.03 | I | 300 | 0.087 |
| Palomar | 12/04/2008 | 4.040.28 | K | 69 | 0.138 | ||||
| CFHT | 05/02/2010 | 4.040.28 | K | 352 | 0.138 | ||||
| 45493 | 18 UMa | A5V | 36.31.0 | AEOS | 03/03/2003 | 4.580.03 | I | 300 | 0.094 |
| Palomar | 12/04/2008 | 4.290.02 | K | 85 | 0.138 | ||||
| 49593 | 21 LMi | A7V | 28.00.7 | Palomar | 12/04/2008 | 4.000.04 | K | 44 | 0.108 |
| 51658 | A7IV | 34.30.9 | Palomar | 12/04/2008 | 4.200.02 | K | 69 | 0.106 | |
| CFHT | 04/02/2010 | 4.200.02 | K | 440 | 0.106 | ||||
| 53910 | Merak | A1V | 24.40.4 | CFHT | 04/02/2010 | 2.290.24 | K | 440 | 0.106 |
| 53954 | 60 Leo | A1m | 37.91.2 | Palomar | 12/04/2008 | 4.320.04 | K | 71 | 0.103 |
| 54063 | A5 | 61.83.3 | CFHT | 14/06/2008 | 6.290.02 | H | 450 | 0.079 | |
| 54136 | 51 UMa | A3III-IV | 80.64.6 | AEOS | 03/03/2003 | 5.860.01 | I | 300 | 0.065 |
| 57328 | Vir | A4V | 36.61.1 | AEOS | 03/03/2003 | 4.670.00 | I | 300 | 0.067 |
| Palomar | 11/04/2008 | 4.410.05 | K | 71 | 0.104 | ||||
| CFHT | 13/06/2008 | 4.540.08 | H | 180 | 0.091 | ||||
| 57632 | Leo | A3V | 11.1 0.1 | CFHT | 05/02/2010 | 1.880.19 | K | 352 | 0.099 |
| 58510 | 7 Vir | A1V | 84.85.4 | AEOS | 02/03/2003 | 5.340.00 | I | 290 | 0.068 |
| 58590 | Vir | A5V | 109.210.1 | AEOS | 02/03/2003 | 4.530.02 | I | 300 | 0.067 |
| 59394 | 3 Crv | A1V | 56.12.1 | CFHT | 14/06/2008 | 5.360.04 | H | 450 | 0.165 |
| 59608 | 12 Vir | A2m | 49.51.8 | AEOS | 03/03/2003 | 5.610.03 | I | 200 | 0.060 |
| CFHT | 04/02/2010 | 5.240.02 | K | 440 | 0.097 | ||||
| 59774 | Megrez | A3V | 25.00.4 | Palomar | 11/04/2008 | 3.310.25 | H | 71 | 0.094 |
| CFHT | 13/06/2008 | 3.310.25 | H | 180 | 0.094 | ||||
| 60746 | 16 Com | A4V | 86.55.6 | AEOS | 03/02/2003 | 4.930.03 | I | 300 | 0.058 |
| 61960 | Vir | A0V | 36.91.1 | AEOS | 02/03/2003 | 4.800.03 | I | 300 | 0.064 |
| Palomar | 11/04/2008 | 4.760.02 | H | 57 | 0.092 | ||||
| CFHT | 04/02/2010 | 4.680.02 | K | 440 | 1.040 | ||||
| 62933 | 41 Vir | A7III | 61.02.9 | CFHT | 05/02/2010 | 5.470.02 | K | 352 | 0.097 |
| 68520 | Vir | A3V | 66.93.9 | AEOS | 03/03/2003 | 4.110.02 | I | 300 | 0.075 |
| 69592 | A7V | 59.02.6 | Palomar | 12/07/2008 | 5.900.02 | H | 71 | 0.093 | |
| 69732 | Boo | A0p | 29.80.5 | AEOS | 03/03/2003 | 4.150.03 | I | 300 | 0.069 |
| Palomar | 11/04/2008 | 4.030.25 | H | 71 | 0.095 | ||||
| 69951 | A5 | 73.53.4 | Palomar | 12/07/2008 | 6.400.04 | H | 71 | 0.097 | |
| 69974 | Vir | A1V | 57.23.1 | AEOS | 03/03/2003 | 4.430.02 | I | 669 | 0.114 |
| Gemini | 24/06/2008 | 4.240.02 | K | 200 | 0.177 | ||||
| 71075 | Boo | A7III | 26.10.5 | Palomar | 11/04/2008 | 2.570.25 | H | 71 | 0.089 |
| 75043 | A4V | 65.32.2 | AEOS | 29/05/2002 | 5.520.00 | I | 300 | 0.082 | |
| 76852 | Ser | A1V | 58.92.7 | Palomar | 13/07/2008 | 4.310.02 | K | 71 | 0.142 |
| 77233 | Ser | A3V | 46.91.9 | Palomar | 12/04/2008 | 3.550.32 | K | 67 | 0.161 |
| 77464 | A5IV | 49.21.7 | Gemini | 27/06/2008 | 5.260.02 | K | 200 | 0.238 | |
| 77622 | Ser | A2m | 21.60.3 | Palomar | 12/04/2007 | 3.430.27 | K | 71 | 0.203 |
| 83613 | 60 Her | A4IV | 44.11.4 | Palomar | 12/04/2008 | 4.610.02 | K | 71 | 0.347 |
| 84012 | Oph | A2IV-V | 25.80.6 | Palomar | 12/04/2008 | 2.340.24 | K | 71 | 1.436 |
| 86565 | o Ser | A2Va | 51.52.8 | Gemini | 28/06/2008 | 4.110.25 | K | 200 | 3.249 |
| 87108 | Oph | A0V | 29.00.8 | Palomar | 12/04/2008 | 3.620.23 | K | 71 | 0.919 |
| CFHT | 31/08/2009 | 3.620.23 | K | 480 | 0.919 | ||||
| 92161 | 111 Her | A5III | 28.40.6 | CFHT | 13/06/2008 | 4.080.03 | H | 180 | 1.472 |
| 95081 | Dra | A2IIIs | 68.92.2 | Gemini | 24/06/2008 | 4.450.02 | K | 200 | 0.380 |
| Palomar | 12/07/2008 | 4.580.17 | H | 71 | 0.348 | ||||
| 95853 | Cyg | A5Vn | 37.50.6 | CFHT | 12/06/2008 | 3.690.23 | H | 280 | 0.583 |
| 99655 | 33 Cyg | A3IV-Vn | 46.71.0 | CFHT | 14/06/2008 | 4.170.27 | H | 450 | 0.767 |
| 99742 | Aql | A2V | 47.11.7 | CFHT | 30/08/2009 | 4.770.02 | K | 480 | 1.353 |
| 99770 | 29 Cyg | A2V | 41.00.9 | CFHT | 31/08/2009 | 4.420.02 | K | 480 | 7.030 |
| 100108 | 36 Cyg | A2V | 59.71.9 | AEOS | 31/05/2002 | 5.510.00 | I | 300 | 2.521 |
| Gemini | 08/09/2009 | 5.490.02 | K | 200 | 6.666 | ||||
| 100526 | A2 | 69.22.2 | Gemini | 08/09/2008 | 6.200.02 | K | 200 | 1.137 | |
| 101093 | Cep | A7III | 41.60.9 | CFHT | 30/08/2009 | 3.720.32 | K | 200 | 0.662 |
| 101300 | Am | 81.14.6 | AEOS | 31/05/2002 | 6.080.01 | I | 300 | 0.980 | |
| 101483 | Del | A3IVs | 53.02.3 | Gemini | 08/09/2008 | 5.2410.00 | K | 200 | 0.796 |
| 105966 | 35 Vul | A1V | 55.72.2 | Gemini | 08/09/2008 | 5.290.02 | K | 200 | 0.630 |
| 109427 | Peg | A1Va | 29.60.8 | CFHT | 14/06/2008 | 3.390.21 | H | 450 | 0.193 |
| 109667 | A3V | 58.12.7 | Gemini | 10/09/2008 | 5.740.02 | K | 200 | 0.157 | |
| CFHT | 31/08/2009 | 5.740.02 | K | 720 | 0.157 | ||||
| 111169 | Lac | A1V | 31.40.5 | Palomar | 12/07/2008 | 3.870.21 | H | 71 | 1.384 |
| CFHT | 30/08/2009 | 3.850.27 | K | 480 | 1.516 | ||||
| 116354 | 15 And | A1III | 71.63.2 | Gemini | 08/09/2008 | 5.280.02 | K | 200 | 0.405 |

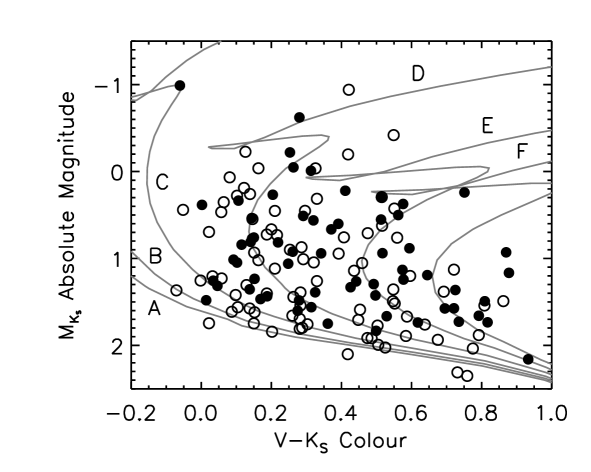
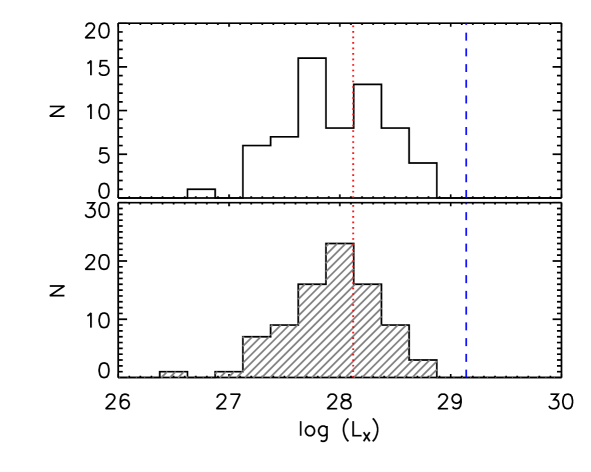
Two samples were constructed in order to test the companion hypothesis: a 63-star X-ray detected sample, and an 85-star control sample. The distributions of spectral types reported in the Hipparcos catalogue for both samples are shown in Figure 1, and a K-S test confirms that both are drawn from the same distribution. The majority of the total sample, 108 targets, form a part of our ongoing Volume-limited A-Star (VAST) survey which will include all A-type stars within 75 parsecs. Both the X-ray and control samples includes targets spanning a similar range of ages, as shown in the colour-magnitude diagram in Figure 2. To perform a robust test of the companion hypothesis, we ensured that each sample had a similar distribution of sensitivity to X-ray sources. Background X-ray counts were extracted from the ROSAT All Sky Survey (RASS) observations at the coordinates of each target within both samples. A minimum detectable X-ray flux at each coordinate was estimated as five times the background level. These minimum fluxes were calculated assuming a hardness ratio of 0.5, typical of low-mass stellar sources (e.g. Huélamo et al., 2000). The X-ray luminosity () was then calculated based on a distance equal to that of the target. The distributions of minimum detectable for both samples are shown in Figure 3.
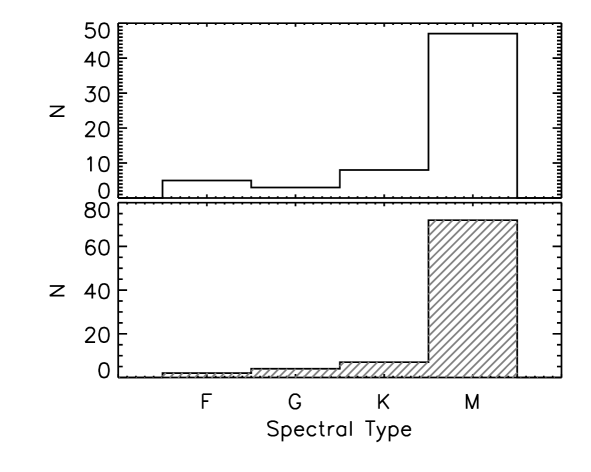
The latest spectral type companion to which the RASS observations are sensitive to depends on the age of the target, derived from theoretical isochrones (Fig. 2 - Marigo et al., 2008), and the X-ray luminosity sensitivity of the observations (Fig. 3). The distribution of this spectral type sensitivity is given in Figure 4. Most of the targets within both samples had RASS observations sensitive to M-type companions and above: 75% of the X-ray sample and 85% of the control sample. Nearly all the RASS observations were sensitive to K-type companions – 87% of the X-ray and 93% of the control sample – and the few remaining targets were sensitive to F- or G-type companions.
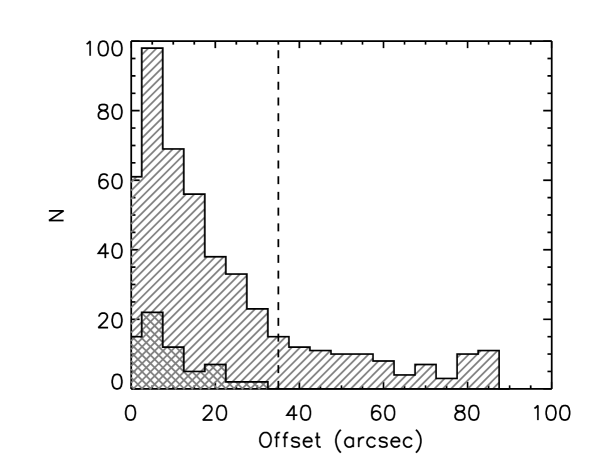
The targets within the X-ray detected sample were chosen based on the presence of a ROSAT Bright Source Catalogue (Voges et al., 1999 – BSC) or ROSAT Faint Source Catalogue (Voges et al., 2000 – FSC) source within 35 of the Hipparcos coordinate of each target. As noted in Table 5, 51% are from the Faint Source Catalogue. Previous correlations between BSC sources and optical star catalogues (e.g. Huensch et al., 1998a) have typically used a maximum offset of 90 between the catalogue positions, to define an X-ray source. The distribution of the offsets between X-ray source position and Hipparcos position is given in Figure 5 and we have applied a more stringent maximum offset cut-off than previous studies, 35. All of the A-type stars within the X-ray sample were also identified as X-ray stars in previous studies of X-ray detected A-type stars (e.g. Schröder & Schmitt, 2007).
4 Observations
| Telescope | Proposal ID | Dates | Filter | Field of view | Pixel Scale | North | ||
|---|---|---|---|---|---|---|---|---|
| AEOS | - | 02-02-2002 – 03-03-2003 | 101 | |||||
| CFHT | 2008A-C22 | 12-06-2008 – 14-06-2008 | 14 | (FeII) | ||||
| 2008A-C22 | 13-06-2008 – 14-06-2008 | 1 | (H) | |||||
| 2009B-C06 | 30-08-2009 – 01-09-2009 | 18 | (H) | |||||
| 2010A-C14 | 04-02-2010 – 05-02-2010 | 29 | (H) | |||||
| Gemini | GN-2008A-Q-74 | 18-06-2008 – 24-06-2008 | 8 | (Br) | ||||
| GN-2008B-Q-119 | 17-08-2008 – 25-11-2008 | 26 | (Br) | |||||
| GN-2009B-Q-120 | 08-09-2009 – 19-12-2009 | 6 | (Br) | |||||
| GN-2010A-Q-75 | 10-05-2010 | 1 | (Br) | |||||
| Palomar | - | 11-04-2008 – 13-07-2008 | 13 | (CH) | ||||
| Palomar | - | 11-04-2008 – 13-07-2008 | 22 | (Br) |
High resolution AO images were obtained for all 148 stars in order to compare the binary statistics of the X-ray and control samples. The data were acquired with several instruments listed in Table 3 – VisIm (Roberts & Neyman, 2002) on AEOS, KIR (Doyon et al., 1998) on CFHT, NIRI (Hodapp et al., 2003) on Gemini North, and PHARO (Hayward et al., 2001) on Palomar. The resolution limit / ranged from 005 for the -band AEOS images to 013 for the CFHT images. The filter used for observations with each instrument is given in Table 3, alongside the corresponding narrowband filter in parentheses. The FWHM of the image cores typically matched the diffraction-limit, due to the high quality AO correction on these bright stars. Given the nearby distances of the targets ( pc), the resolution limit corresponds to projected separations of 10 - 20 AU. The field-of-view ranges from 217217 to 356356, making binary systems as wide as 3000 AU detectable. The effective field-of-view for the combined science images was increased by dithering the target on the detector. The search range covers the peak of the binary separation distribution of lower mass stars (e.g. Duquennoy & Mayor, 1991; Fischer & Marcy, 1992), important for resolving the bulk of the binary population.
The observing strategy was consistent for all targets. To search for close companions, unsaturated exposures were obtained of each target using either a narrow-band or neutral-density filter. Exposure times ranged from 0.01s to 4.0s, with stacks of 3 to 500 frames. To detect wider, fainter objects approaching the bottom of the Main Sequence, longer exposures in a wide-band filter were recorded with total integration times ranging from 41s to 720s. Details of the filter combinations are given in Table 3 and exposure times of individual targets are listed in Tables LABEL:tab:sample and LABEL:tab:control. Because of the brightness of the targets, all-sky survey images from 2MASS are saturated over a significant fraction of the separation range covered by the images within this study.
5 Data analysis
The science images were processed with standard image reduction steps including dark subtraction, flat fielding, interpolation over bad pixels, and sky subtraction. Alignment of short exposure images was achieved through Gaussian centroiding, while the saturated exposures were aligned by cross-correlating the diffraction spikes (e.g. Lafrenière et al., 2007). To improve the measurable contrast ratios, a radial subtraction was performed on the saturated images to suppress the seeing halo of the central star. Finally, all the processed images were median-combined to increase the signal-to-noise ratio of any detection
Candidates were identified by visual inspection, and the separation and magnitude difference were measured for each candidate, as reported in Tables 4 and 5. The projected separation between the central star and candidate was calculated from the positions of the centroids of each component in the final median-combined image. The uncertainty of the separation incorporates both the uncertainty in the instrument pixel scale, given in Table 3, and the standard deviation of the measurements from each individual exposure. An estimate of the physical separation in AU was then determined from the Hipparcos-derived distance to the primary. The position angle of each candidate was measured based on the instrument field orientation, given in Table 3, and the rotation angle on the sky for all Gemini and a subset of the AEOS data. For data obtained at Palomar and CFHT, there is no instrument or sky rotation. Typically, the total uncertainty is dominated by the measurement uncertainty, however the lack of calibration measurements within some of the observation runs requires a more conservative estimate of the plate scale and angle of true north uncertainty.
The magnitude difference between each candidate and target star was measured with aperture photometry. Using an aperture of twice the FWHM, the fluxes for the candidate and unsaturated star were measured. If the candidate was only detected in the saturated image, then the comparison flux of the central star was scaled according to the exposure time of the saturated image and the appropriate filter bandpass. The reported magnitude difference uncertainty was estimated as the standard deviation of the values from each processed image before combination. Using the magnitudes of the target from the Hipparcos and 2MASS (Cutri et al., 2003) source catalogues, the apparent magnitude of the candidate was determined. An estimate of the physical properties of both primary and candidate companion was made using a combined set of theoretical solar-metallicity isochrones (Marigo et al., 2008; Baraffe et al., 1998). Each target was plotted on a colour-magnitude diagram (Fig. 2) from which an estimate of the age was derived. Estimated colours and bolometric luminosities were obtained for the companion candidates based on the measured magnitude difference, using an isochrone of the same age as the primary.
6 Results
| Designation | Separation | Position Angle | Magnitude | Filter | Observation |
| arc sec | degrees | Difference | Date | ||
| HIP2852 B† | 0.93 0.01 | 260.6 0.3 | 5.07 0.03 | Br | 17/10/2008 |
| HIP9487 B | 1.83 0.01 | 266.9 0.2 | 0.33 0.01 | H21-0 | 01/09/2009 |
| HIP17572 B | 3.4 0.1 | 333.0 1.0 | 2.54 0.01 | 04/02/2002 | |
| HIP28360 C | 13.9 0.3 | 155.0 0.1 | 8.5 0.2 | 05/02/2010 | |
| HIP29711 B | 4.2 | 239.7 | 2.5 | 25/11/2008 | |
| HIP35350 B | 9.7 0.1 | 33.8 0.1 | 3.8 0.1 | Br | 12/04/2008 |
| HIP43570 B | 0.66 0.02 | 310.0 1.0 | 2.58 0.01 | 04/02/2002 | |
| HIP44066 B | 10.3 0.3 | 320.9 1.0 | 5.5 0.2 | 01/03/2003 | |
| HIP44901 B† | 26.2 0.1 | 33.9 0.1 | 6.0 0.1 | 05/02/2010 | |
| HIP51658 B | 16.9 0.04 | 357.6 0.1 | 6.0 0.2 | 04/02/2010 | |
| HIP54136 B | 7.7 0.3 | 110.7 1.0 | 4.6 0.2 | 03/03/2003 | |
| HIP58510 B† | 3.2 0.1 | 218.4 1.0 | 9.2 0.3 | 02/03/2003 | |
| HIP68520 Aa† | 14.4 0.5 | 41.9 1.0 | 7.7 0.1 | 03/03/2003 | |
| HIP69592 B† | 4.05 0.03 | 174.5 0.1 | 5.1 0.1 | CH4S | 12/07/2008 |
| HIP75043 B | 0.26 0.01 | 227.6 2.0 | 6.0 0.4 | 29/05/2002 | |
| HIP84012 B | 0.58 0.01 | 236.0 0.2 | 0.6 0.1 | Br | 12/04/2008 |
| HIP95081 B† | 13.1 0.1 | 16.9 0.3 | 8.7 0.1 | 24/06/2008 | |
| HIP101300 B | 0.26 0.01 | 241.7 1.3 | 1.0 0.1 | 31/05/2002 | |
| HIP109667 B† | 1.12 0.01 | 285.2 0.3 | 4.1 0.1 | Br | 10/09/2008 |
| 1.11 0.01 | 284.7 0.2 | 4.2 0.1 | H21-0 | 31/08/2009 | |
| - Previously unresolved companion candidate | |||||
| Designation | Separation | Position Angle | Magnitude | Filters | Observation | Estimated | Estimated |
|---|---|---|---|---|---|---|---|
| arc sec | degrees | Difference | Date | ||||
| 5310 B†⋆ | 0.36 0.01 | 175.3 0.3 | 3.91 0.04 | Br | 16/10/2008 | 1.98 | -3.01 |
| 9480 B⋆ | 0.67 0.01 | 297.3 0.2 | 1.18 0.02 | H21-0 | 01/09/2008 | 0.64 | -4.24 |
| 11569 B⋆ | 2.77 0.01 | 230.0 0.2 | 1.60 0.02 | H21-0 | 05/02/2010 | 0.64 | -4.32 |
| 11569 C | 7.22 0.01 | 115.3 0.1 | 1.98 0.01 | H21-0 | 05/02/2010 | 0.75 | -4.08 |
| 13133 C† | 6.6 | 70.5 | 14/11/2008 | 0.86 | -3.00 | ||
| 13133 D†⋆ | 3.87 0.03 | 229.8 0.3 | 9.4 0.3 | 14/11/2008 | 4.94 | 1.16 | |
| 17608 Ab† | 0.25 0.02 | 111.0 1.1 | 4.0 0.4 | 04/02/2002 | 0.54 | -4.32 | |
| 17923 B | 3.1 0.1 | 232.3 1.0 | 2.66 0.01 | 03/02/2002 | 0.65 | -3.29 | |
| 17923 Ca | 9.7 0.3 | 233.7 1.0 | 2.8 0.1 | 03/02/2002 | 0.68 | -3.23 | |
| 17923 Cb | 10.2 0.3 | 235.0 1.0 | 4.5 0.2 | 03/02/2002 | 1.08 | -2.52 | |
| 19949 B† | 13.5 0.4 | 146.9 1.0 | 7.3 0.3 | 05/02/2002 | 1.88 | -2.63 | |
| 20648 B | 1.7 0.1 | 337.9 1.0 | 3.12 0.02 | 04/02/2002 | 0.80 | -4.84 | |
| 1.80 0.01 | 341.4 0.1 | 2.55 0.01 | H21-0 | 04/02/2010 | |||
| 22287 Ab⋆ | 0.46 0.01 | 41.6 1.2 | 3.8 0.1 | 05/02/2002 | 1.13 | -4.41 | |
| 22287 B⋆ | 13.2 0.5 | 238.7 1.0 | 5.5 0.2 | 05/02/2002 | 1.82 | -3.78 | |
| 23179 B⋆ | 4.7 | 4.0 | 15/11/2008 | 1.12 | -2.81 | ||
| 24019 B⋆ | 11.2 | 26.1 | 04/02/2002 | 0.86 | -4.38 | ||
| 28614 BaBb⋆ | 0.40 0.01 | 22.1 0.3 | 1.27 0.01 | 19/12/2009 | 0.27 | -5.36 | |
| 29997 B† | 8.47 0.05 | 218.1 0.4 | 6.8 0.1 | 01/09/2009 | 2.43 | -2.16 | |
| 30419 B⋆ | 12.20 0.04 | 29.0 0.2 | 1.72 0.03 | H21-0 | 01/09/2009 | 0.65 | -4.95 |
| 39095 B⋆ | 5.3 0.2 | 65.8 1.0 | 9.5 0.7 | 02/02/2002 | 2.32 | -2.63 | |
| 39847 Aa† | 4.6 0.2 | 114.0 1.0 | 9.5 0.5 | 02/02/2002 | 2.39 | -2.26 | |
| 42313 Ab† | 2.6 0.1 | 265.1 1.0 | 6.6 0.2 | 04/02/2002 | 1.79 | -3.08 | |
| 2.6 0.1 | 262.7 3.1 | 7.3 0.2 | 01/03/2003 | ||||
| 44127 B⋆ | 2.35 0.02 | 76.6 0.1 | 4.22 0.02 | Br | 12/04/2008 | 2.08 | -3.55 |
| 2.40 0.01 | 78.8 0.1 | 4.36 0.02 | H21-0 | 05/02/2010 | |||
| 44127 C⋆ | 1.94 0.02 | 79.8 0.1 | 4.26 0.02 | Br | 12/04/2008 | 2.09 | -3.53 |
| 1.92 0.01 | 87.2 0.1 | 4.30 0.02 | H21-0 | 05/02/2010 | |||
| 45688 B⋆ | 2.5 0.1 | 222.6 1.0 | 1.64 0.03 | 06/02/2002 | 0.48 | -4.79 | |
| 2.60 0.02 | 224.0 0.1 | 1.2 0.1 | Br | 12/04/2008 | |||
| 51200 B⋆ | 2.41 0.01 | 304.1 0.1 | 3.08 0.01 | H21-0 | 04/02/2010 | 1.42 | -3.63 |
| 52913 B⋆ | 2.3 0.1 | 13.8 1.1 | 0.31 0.01 | 02/03/2003 | 0.31 | -5.13 | |
| 62394 Ab†⋆ | 3.2 0.1 | 348.8 1.4 | 7.0 0.2 | 29/05/2002 | 2.16 | -2.37 | |
| 65241 B†⋆ | 0.34 0.02 | 41.7 3.2 | 4.3 0.4 | 03/03/2003 | 1.40 | -3.16 | |
| 65477 B⋆ | 1.07 0.01 | 209.0 0.1 | 5.6 0.1 | CH4S | 11/04/2008 | 2.19 | -3.46 |
| 66249 B | 1.81 0.01 | 154.4 0.1 | 6.4 0.1 | H21-0 | 05/02/2010 | 2.45 | -3.18 |
| 66727 B | 4.4 0.1 | 338.5 1.2 | 2.95 0.02 | 03/03/2003 | 0.74 | -3.72 | |
| 76376 C†⋆ | 9.6 0.4 | 350.1 1.0 | 11.9 0.3 | 29/05/2002 | 3.6 | -1.52 | |
| 76878 B⋆ | 2.3 0.1 | 53.4 1.7 | 7.3 0.2 | 29/05/2002 | 2.24 | -2.31 | |
| 2.4 0.02 | 86.4 0.1 | 5.1 0.4 | 13/07/2008 | ||||
| 80628 B⋆ | 0.67 0.01 | 22.6 0.1 | 2.26 0.03 | Br | 12/04/2008 | 0.90 | -3.78 |
| 82321 B | 1.82 0.01 | 34.1 0.1 | 2.2 0.1 | CH4S | 12/07/2008 | 0.77 | -4.66 |
| 82321 C | 2.06 0.02 | 38.4 0.1 | 2.69 0.03 | CH4S | 12/07/2008 | 0.90 | -4.39 |
| 87045 B⋆ | 0.32 0.01 | 144.1 1.1 | 2.45 0.04 | 29/05/2002 | 0.62 | -3.71 | |
| 88771 B⋆ | 24.83 0.06 | 297.6 0.1 | 5.2 0.1 | 05/02/2010 | 2.18 | -3.83 | |
| 88771 D | 24.20 0.06 | 48.4 0.1 | 8.1 0.1 | 05/02/2010 | 3.40 | -2.53 | |
| 91971 B | 23.28 0.07 | 51.3 0.2 | 9.7 0.2 | 13/06/2008 | 4.27 | -0.33 | |
| 93747 B | 7.27 0.02 | 47.0 0.2 | 4.88 0.02 | FeII | 13/06/2008 | 1.99 | -3.23 |
| 98103 C†⋆ | 2.8 0.1 | 184.7 0.2 | 4.7 0.1 | 18/06/2008 | 2.05 | -2.96 | |
| 102033 B⋆ | 0.72 0.02 | 345.4 1.1 | 2.36 0.01 | 31/05/2002 | 0.72 | -4.62 | |
| 106711 B† | 6.98 0.04 | 58.1 0.3 | 8.5 0.1 | 08/09/2008 | 3.00 | -2.14 | |
| 109521 B†⋆ | 9.98 0.06 | 241.3 0.3 | 8.1 0.1 | 08/09/2008 | 3.27 | -1.18 | |
| 110787 B†⋆ | 0.29 0.01 | 211.1 0.6 | 4.3 0.1 | Br | 17/09/2008 | 2.03 | -3.18 |
| 117452 Ba†⋆ | 3.7 0.1 | 237.3 0.4 | 3.48 0.04 | H21-0 | 30/08/2009 | 1.61 | -3.01 |
| 117452 Bb†⋆ | 3.5 0.1 | 238.5 0.5 | 3.7 0.1 | H21-0 | 30/08/2009 | 1.73 | -2.90 |
| - Previously unresolved companion candidate | |||||||
| - Companion candidate falls within RASS error ellipse | |||||||
| Total Field-of-View | RASS Error Ellipse Search Area | |||
|---|---|---|---|---|
| X-Ray | Control | X-Ray | Control | |
| A8 – M9 Companion11footnotemark: 1 | ||||
| B6 – A7 Companion | ||||
| No Resolved Companion | ||||
1 - Expected spectral type based on measured magnitude difference and assuming the same distance as the target.
6.1 Detections
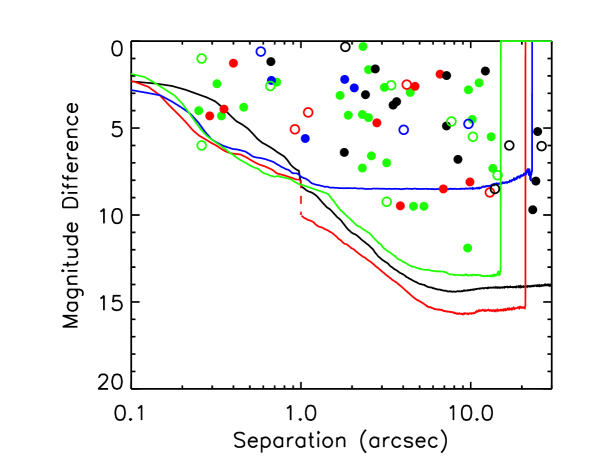
Among the 148 targets, a total of 68 candidate companions were imaged around 59 members of the total sample. One-third of the candidate companions, 23 systems, are newly resolved. The binary angular separations range from 03 to 262, and the magnitude differences range from 0.3 to 11.9, corresponding to spectral types of mid-A to late-M for associated companions. The measured magnitude difference of the candidates is plotted as a function of separation in Figure 6. Properties of the companion candidates in the X-ray and control samples are listed in Tables 4 and 5, respectively. Candidate companions are limited to those with less than 5% probability of being a background object, based on the star density analysis described in §6.3.
6.2 Detection limits
The sensitivity to companions varies with angular separation from the central star due to the significant residual halo from the bright targets. Detection limits for each image are quantified by determining the flux level in a 55 pixel aperture that would produce a signal 5 above the noise within the aperture. The median magnitude difference sensitivity curve for each instrument is plotted in Figure 6. Since the data were obtained at several wavelengths, the bottom of the Main Sequence corresponds to a different magnitude difference for each instrument. For an A0 primary, a companion at the bottom of the Main Sequence would have an absolute magnitude of 14.3 at , 10.5 at , and 10.2 at at an age of 700 Myr. The infrared data obtained at CFHT and Gemini are sensitive to the bottom of the Main Sequence at separations beyond . The achieved contrast for the Palomar data was less due to the shorter exposure times, and reached a companion mass limit of 0.12 M⊙ to 0.2 M⊙, depending on the age of the target. The AEOS data have a sensitivity limit to companions ranging from 0.08 M⊙ to 0.1 M⊙. The sensitivity to companions for both the X-ray and control samples is similar, making the difference between the two measured binary frequencies a valid test of the companion hypothesis.
6.3 Probability of chance superpositions
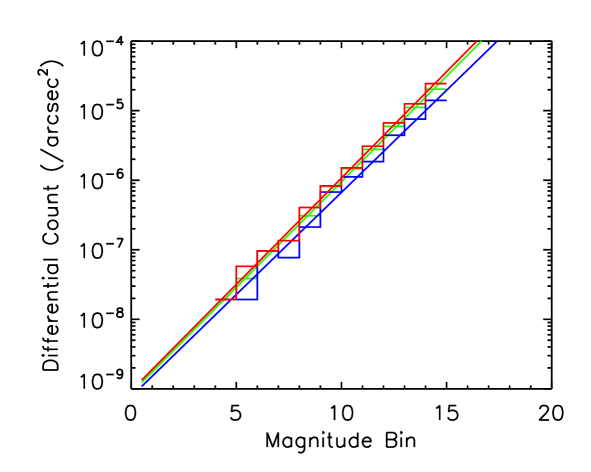
An estimate of the probability of each companion candidate being an optical binary was made based on the local stellar densities for each target, measured from the 2MASS source catalogue. The number of sources within a box of each target was determined in magnitude bins 1 magnitude in width from 0–14 mag for the , , and bandpasses. An example plot of this differential source count per area is given in Figure 7. A power law fit was applied to the counts such that
| (1) |
where is the number of sources within a separation from the target, with an apparent magnitude brighter than , expressed as a function of the two fit parameters , the gradient, and , the intercept. For the band observations obtained at the AEOS, we have approximated the local stellar density using the band 2MASS data. Candidates with were assumed to be a background object, and not counted for any aspect of this study – a total of 492 candidates were rejected through this process. To compare the stellar density across the samples, Tables LABEL:tab:sample & LABEL:tab:control give the number of objects brighter than 14th magnitude expected per square arcminute in the vicinity of each target. In order to prove physical association of the companion candidates which satisfy this criterion, a second epoch measurement will be required.
7 Discussion
7.1 Multiplicity comparison
The frequency of multiple systems in the X-ray and control sample was determined by two methods. In the first calculation, the total field-of-view of each observation was used, and, in the second calculation, the search area was restricted to the RASS position error box. For each approach, candidate companions with a small magnitude difference, consistent with a spectral type in the B6-A7 range, were excluded from the X-ray companion hypothesis test and are listed separately in Table LABEL:tab:summary. This criterion of a companion capable of generating X-rays eliminated one binary companion from the X-ray sample and two companions from the control sample. All multiple systems considered also satisfied the background object probability of 5%, as described in §6.3.
Considering the total field-of-view of the combined dithered observations, candidates satisfying the magnitude and background probability criteria were included in the multiple frequency measurement. Among the X-ray sample, were multiple, compared to for the control sample – a difference of , a 5 result. These and subsequent reported errors are estimated from a binomial distribution (e.g. Burgasser et al., 2003). Spectroscopic binaries – unresolved with these observations – constitute a significant fraction of both samples ( 15%, Pourbaix et al., 2004). This estimate represents a lower limit on the frequency since the sample of stars observed with the radial velocity monitoring is not known, and the large of the primary and less massive unseen companions make such observations challenging. These spectroscopically resolved binaries are not considered within our statistics.
The multiplicity of the X-ray sample was also measured by considering only companion candidates that were located within the confines of the RASS error ellipse. For each target, the AO data covered a portion of the RASS error ellipse ranging from 25 to 100 percent. This additional restriction lowered the multiple frequency to . To determine a comparable frequency for the control sample, a series of companion searches were performed by randomly assigning the RASS-optical offset and corresponding error ellipse of an X-ray target to a control target and determining the number of candidate companions which fall within the error ellipse. Based on a large number of simulations (100,000), the frequency of multiples was estimated as . These two frequencies are different by , a 4 result.
A summary of the multiplicity calculations is given in Table LABEL:tab:summary. The high statistical significance of the difference in frequencies for the X-ray and control samples provides strong support of the companion hypothesis as an explanation of the X-ray detection of B6-A7 stars. Further evidence for individual systems with separations of a few arcsecond could be provided by high resolution Chandra observations which would have the pointing accuracy to assign the X-ray flux to the companion unambiguously. One target, Merope in the Pleiades, was observed with the high resolution mode of Chandra, but the binary separation is only 025, making the discrepancy between the Chandra and 2MASS coordinates ambiguous in this case. Targets within the X-ray sample for which no companions have been resolved will make prime targets for future interferometric and spectroscopic study in a search for lower-mass companions with angular separations low enough to render them undetectable with AO observations.
7.2 ROSAT positional uncertainty
Previous studies of the unexplained X-ray detection of early-type stars (e.g. Schröder & Schmitt, 2007) have used the same definition of an X-ray detected early-type star as presented by Huensch et al. (1998a) – any X-ray source within of an optical source can be attributed to the optical source. This value was based on estimating the frequency of false attribution by means of a Monte Carlo simulation, and was selected at the radius at which the probability of correctly attributing an X-ray source is 50 percent. A significantly lower offset of was calculated by Voges et al. (1999) from a correlation of the Tycho catalogue and ROSAT Bright Source Catalogue positions, a radius within which 90 percent of the optical targets have an X-ray source attributed. This measurement represents the empirical positional uncertainty of the RASS source catalogue positions.
The sample investigated within this study was initially selected in the same manner as Huensch et al. (1998a) – using a maximum offset of . The tail of the offset distribution was removed by applying a more stringent maximum offset at , as described in §2. Variations in the field-of-view size between instruments caused the coordinates of the X-ray source given within the RASS to be outside of the field-of-view within a small subset of the observations. In order to investigate any biases this may have had upon the results presented previously, the sample was further restricted to only include those targets for which the RASS source position was within the field-of-view and at least 50 percent of the RASS error ellipse was covered – a total of 45 stars. For this sample a marginally higher frequency of companions located within the RASS error ellipse was recorded, , reinforcing the result obtained with the unrestricted sample.
7.3 Comparison of measured and expected X-ray luminosities
7.3.1 Candidate companions with measured colours
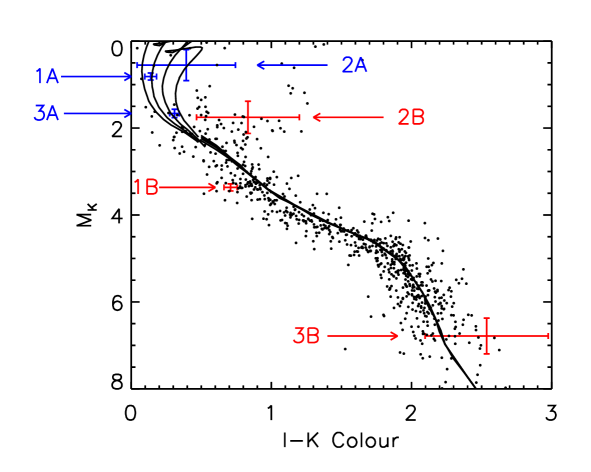
Several of the candidate companions to X-ray targets have a measured colour from this study, and are plotted in Figure 8. The colour provides additional information to estimate the spectral type of the object and to test further the capacity of the second object to generate X-ray emission. The three systems with colours are: (1) HIP 20648, (2) HIP 45688, and (3) HIP 76878. The colours of the candidate companions are all consistent with X-ray emitting companions: 0.71 0.05 or late F-/early G-type for HIP 20648 B, 0.83 0.37 or mid G-type for HIP 45688 B, and 2.54 0.44 or late M-type for HIP 76878 B.
With the assumption of a distance and age equivalent to the primary distance, the X-ray luminosity associated with the ROSAT detection can by checked for consistency with the spectral type. The position on the colour-magnitude diagram for each primary star and its imaged candidate companion is given in Figure 8, assuming the distance to each component is the same. Each case is examined individually, and the colour and proper motion measurements clearly support the assignment of the X-ray emission to the candidate companion in two cases, while one case remains uncertain.
The theoretical isochrone that best fits the first target, HIP 20648A, corresponds an age of 650 Myr, and the candidate companion position in Figure 8 is as expected for an associated companion. The companion X-ray luminosity is , and this value falls between the X-ray luminosities of Hyades F- and G-type stars. The assessment of the second target, HIP 45688, is complicated by the presence of a known close companion to the imaged candidate companion ( – McAlister et al., 1993), unresolved in the current data. The composite colour and magnitude of the BaBb system appear to be more luminous than expected for an object at the 630 Myr age estimated for the primary, even if the pair is an equal magnitude binary. The X-ray luminosity of BaBb would be , significantly higher than younger G-type stars in the Hyades. For the final system, HIP 76878, the best fit age is 700 Myr, similar to the Hyades. The X-ray luminosity of the candidate companion is , if the distance is equal to that of HIP76878. This X-ray level is higher than observed X-ray luminosities of M-dwarfs of similar age within the Hyades (Stern et al., 1995). In this case, the time baseline between the two observations also reveals a significant motion of the candidate relative to the primary on a trajectory different from both a background object and a bound companion. The presence of a foreground M-dwarf in a chance superposition with HIP76878 explains this discrepant proper motion, the red colour of the object, and the unusually high X-ray luminosity.
7.3.2 Candidate companions in open clusters
A subset of the X-ray detected targets with imaged candidate companions are members of stellar clusters. HIP 17608 and HIP 17923 are Pleiades members, while HIP 20648 is a Hyades member. Extensive X-ray population studies of both the Pleiades (e.g. Micela et al., 1985; Stauffer et al., 1994; Daniel et al., 2002) and the Hyades (e.g. Micela et al., 1988; Stern et al., 1995) have been conducted with Einstein ROSAT and Chandra, providing comparison X-ray luminosities to test the likelihood that the candidate companions are responsible for the detected X-ray emission.
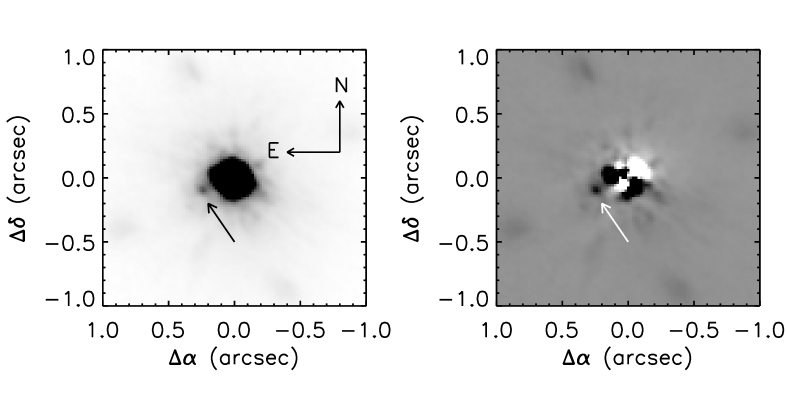
The candidate companion to HIP 17608 (Merope in the Pleiades) with 025 separation is shown in Figure 9. With a magnitude difference of , the second object is a mid F-type star if associated. Assuming a distance to the Pleiades of 133 pc (Pan et al., 2004), the X-ray luminosity for the HIP 17608 system is . The typical X-ray luminosity of F-dwarfs within the Pleiades is estimated to be (Stauffer et al., 1994), indicating that the companion to HIP17608, if associated, is on the upper limit of X-ray activity for this class of star.
For the second Pleiades member, the observations resolve three of the companions (B,Ca,Cb) within the HIP17923 quintuple system. Based on the measured magnitude differences, we estimate the mass of the components as follows: B – 1.2 0.1 M⊙ (mid F-type), Ca – 1.2 0.1 M⊙ (mid F-type), Cb – 0.9 0.1 M⊙ (mid G-type). Deeper X-ray observations of the Pleiades (Micela et al., 1999) revealed an estimated X-ray luminosity of for this system. If the X-ray counts were distributed evenly between the three later-type companions resolved within our AO images, the individual X-ray luminosities would be 29.6, similar to G- and F-type Pleiades members (Stauffer et al., 1994).
The final cluster X-ray target with a resolved companion is the Hyades member HIP 20648. As described in §7.2, the candidate companion also has a measured I-K colour consistent with a late F-/early G-type star, and the X-ray luminosity assigned to the target is consistent with a Hyades G-type star (Stern et al., 1995).
7.3.3 Remaining candidate companions
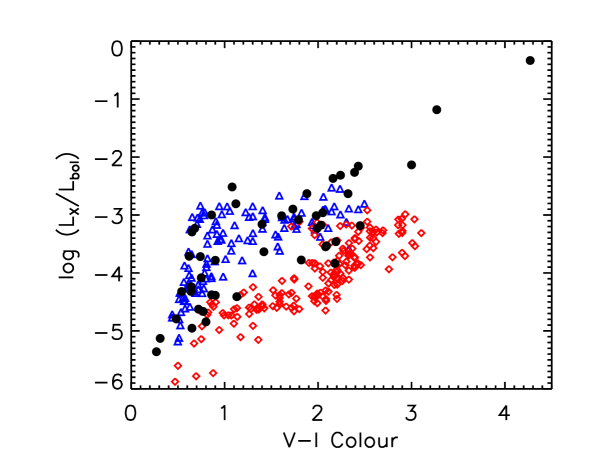
For the remaining candidate companions, an estimate of the ratio of X-ray to bolometric luminosity can be made under the assumption that the candidate is a physical companion at the same distance. From the absolute magnitude, the colour and bolometric luminosity were inferred from theoretical isochrones (Baraffe et al., 1998). The ratios of the observed X-ray luminosity to the estimated bolometric luminosity () are plotted as a function of colour in Figure 10, with Pleiades and Hyades members (Zuckerman & Song, 2004) overplotted as reference populations spanning the age range of the sample.
All but two of the candidates are within the region bound by the Myr Pleiades and Myr Hyades members. Uncertainty exists on both axes since both the colour and bolometric luminosity are estimated from theoretical isochrones, assuming the distance. Future observations to accurately determine the colour of these candidates will provide a more robust estimate of the bolometric luminosity. The two outlying candidates shown in Figure 10 have unphysical high luminosity ratios, significantly higher than the observed luminosity ratios of late M-type stars (e.g. Pizzolato et al., 2003). In these two cases, additional unresolved companions, or background X-ray sources, present a more feasible explanation for the detected X-ray flux. The rate of false-detections, , corresponds to the 5% contamination introduced through the statistical method applied to the candidates to remove background sources, as described in §6.3.
8 Summary
In summary, a total of 148 stars with spectral types in the range B6-A7 and distances of pc have been observed with AO-equipped cameras on 3.8m-8m telescopes. The high resolution images were sensitive to companions with angular separations from 03 to 262 and magnitude differences extending to 14 mag. A total of 68 candidate companions to 59 targets were resolved, and the frequency of multiple systems was measured to be substantially higher for the X-ray detected sample. The high frequency of multiples, , compared to for the control sample is different by 4 and provides strong evidence that the source of the X-ray emission is the candidate companion. The X-ray detected stars with no resolved companion make ideal candidates for future interferometric observations, as this study has shown that the X-ray detection is indicative of the presence of an unresolved companion, and interferometry can resolve binaries below the resolution of the adaptive optics data presented here.
For three candidate companions to X-ray targets, the colour was also measured, and the colours are consistent with late F- to late M-type stars, supporting the identification of the second object as the X-ray source in two cases. Among the X-ray targets with candidate companions, there are also three cluster members, and the known age, distance, and cluster X-ray properties enabled a further test of the companion X-ray luminosity with other cluster members. In each case, the companions – if associated – would have an X-ray luminosity similar to, or on the upper range of, cluster stars with similar magnitude. Follow-up observations of the X-ray targets with candidate companions using Chandra would provide the angular resolution in the X-ray band necessary to confirm the second object as the true source of the X-ray emission.
Acknowledgements
We gratefully acknowledge several sources of funding. R. J. DR. and J. B (ST/F 007124/1) are funded through studentships from the Science and Technology Facilities Council (STFC). This work was initiated with a grant awarded to J. P. from the Air Force Office of Scientific Research (AFOSR) for the AEOS component and completed with a grant from the STFC (ST/F003277/1). Funding for collaborative visits was provided by the CONSTELLATION EC Research Training Network. Portions of this work were performed under the auspices of the U.S. Department of Energy by Lawrence Livermore National Laboratory in part under Contract W-7405-Eng-48 and in part under Contract DE-AC52-07NA27344, and also supported in part by the NSF Science and Technology CfAO, managed by the UC Santa Cruz under cooperative agreement AST 98-76783. This work was supported, through J. R. G., in part by University of California Lab Research Program 09-LR-118057-GRAJ and NSF grant AST-0909188. We thank LLNL summer students C. White (US Air Force Academy) and S. Kost (Carnegie Mellon University) who assisted with obtaining a subset of the data and some of the early analysis. This research has made use of the SIMBAD and VizieR databases, operated at CDS, Strasbourg, France. This publication makes use of data products from the Two Micron All Sky Survey, which is a joint project of the University of Massachusetts and the Infrared Processing and Analysis Center/California Institute of Technology, funded by the National Aeronautics and Space Administration and the National Science Foundation. This research has made use of the Washington Double Star Catalog maintained at the U.S. Naval Observatory. We thank the referee for the helpful comments during the review process.
References
- Baraffe et al. (1998) Baraffe I., Chabrier G., Allard F., Hauschildt P. H., 1998, A&A, 337, 403
- Berghofer & Schmitt (1994) Berghofer T. W., Schmitt J. H. M. M., 1994, Astronomy and Astrophysics (ISSN 0004-6361), 292, L5
- Burgasser et al. (2003) Burgasser A. J., Kirkpatrick J. D., Reid I. N., Brown M. E., Miskey C. L., Gizis J. E., 2003, ApJ, 586, 512
- Chabrier & Baraffe (1997) Chabrier G., Baraffe I., 1997, A&A, 327, 1039
- Chabrier & Küker (2006) Chabrier G., Küker M., 2006, A&A, 446, 1027
- Cutri et al. (2003) Cutri R., Skrutskie M., Dyk S. V., Beichman C., Carpenter J., Chester T., Cambresy L., Evans T., Fowler J., Gizis J., Howard E., Huchra J., Jarrett T., 2003, The IRSA 2MASS All-Sky Point Source Catalog, NASA/IPAC Infrared Science Archive. http://irsa.ipac.caltech.edu/applications/Gator/, -1,
- Daniel et al. (2002) Daniel K. J., Linsky J. L., Gagné M., 2002, ApJ, 578, 486
- De-Pontieu et al. (2007) De-Pontieu B., McIntosh S. W., Carlsson M., Hansteen V. H., Tarbell T. D., Schrijver C. J., Title A. M., Shine R. A., Tsuneta S., Katsukawa Y., Ichimoto K., Suematsu Y., Shimizu T., Nagata S., 2007, Science, 318, 1574
- Doyon et al. (1998) Doyon R., Nadeau D., Vallee P., Starr B. M., Cuillandre J. C., Beuzit J.-L., Beigbeder F., Brau-Nogue S., 1998, Proc. SPIE Vol. 3354, 3354, 760
- Duquennoy & Mayor (1991) Duquennoy A., Mayor M., 1991, A&A, 248, 485
- Feldmeier et al. (1997) Feldmeier A., Puls J., Pauldrach A. W. A., 1997, A&A, 322, 878
- Fischer & Marcy (1992) Fischer D. A., Marcy G. W., 1992, ApJ, 396, 178
- Giampapa et al. (1998) Giampapa M. S., Prosser C. F., Fleming T. A., 1998, Astrophysical Journal v.501, 501, 624
- Güdel (2004) Güdel M., 2004, A&AR, 12, 71
- Hayward et al. (2001) Hayward T. L., Brandl B., Pirger B., Blacken C., Gull G. E., Schoenwald J., Houck J. R., 2001, The Publications of the Astronomical Society of the Pacific, 113, 105
- Hinkley et al. (2010) Hinkley S., Oppenheimer B. R., Brenner D., Zimmerman N., Roberts L. C., Parry I. R., Soummer R., Sivaramakrishnan A., Simon M., Perrin M. D., King D. L., Lloyd J. P., Bouchez A., Roberts J. E., Dekany R., Beichman C., Hillenbrand L., Burruss R., Shao M., Vasisht G., 2010, ApJ, 712, 421
- Hodapp et al. (2003) Hodapp K. W., Jensen J. B., Irwin E. M., Yamada H., Chung R., Fletcher K., Robertson L., Hora J. L., Simons D. A., Mays W., Nolan R., Bec M., Merrill M., Fowler A. M., 2003, The Publications of the Astronomical Society of the Pacific, 115, 1388
- Hoffleit (1964) Hoffleit D., 1964, New Haven
- Hubrig et al. (2001) Hubrig S., Mignant D. L., North P., Krautter J., 2001, A&A, 372, 152
- Huélamo et al. (2000) Huélamo N., Neuhäuser R., Stelzer B., Supper R., Zinnecker H., 2000, A&A, 359, 227
- Huensch et al. (1998a) Huensch M., Schmitt J. H. M. M., Voges W., 1998a, A&AS, 127, 251
- Huensch et al. (1998b) Huensch M., Schmitt J. H. M. M., Voges W., 1998b, A&AS, 132, 155
- Jess et al. (2009) Jess D. B., Mathioudakis M., Erdélyi R., Crockett P. J., Keenan F. P., Christian D. J., 2009, Science, 323, 1582
- Lafrenière et al. (2007) Lafrenière D., Doyon R., Marois C., Nadeau D., Oppenheimer B. R., Roche P. F., Rigaut F., Graham J. R., Jayawardhana R., Johnstone D., Kalas P. G., Macintosh B., Racine R., 2007, ApJ, 670, 1367
- Lucy & White (1980) Lucy L. B., White R. L., 1980, ApJ, 241, 300
- McAlister et al. (1993) McAlister H. A., Mason B. D., Hartkopf W. I., Shara M. M., 1993, Astronomical Journal (ISSN 0004-6256), 106, 1639
- Mamajek et al. (2010) Mamajek E. E., Kenworthy M. A., Hinz P. M., Meyer M. R., 2010, AJ, 139, 919
- Marigo et al. (2008) Marigo P., Girardi L., Bressan A., Groenewegen M. A. T., Silva L., Granato G. L., 2008, A&A, 482, 883
- Micela et al. (1999) Micela G., Sciortino S., Harnden F. R., Kashyap V., Rosner R., Prosser C. F., Damiani F., Stauffer J., Caillault J.-P., 1999, A&A, 341, 751
- Micela et al. (1996) Micela G., Sciortino S., Kashyap V., Harnden F. R., Rosner R., 1996, Astrophysical Journal Supplement v.102, 102, 75
- Micela et al. (1985) Micela G., Sciortino S., Serio S., Vaiana G. S., Bookbinder J., Golub L., Harnden F. R., Rosner R., 1985, ApJ, 292, 172
- Micela et al. (1988) Micela G., Sciortino S., Vaiana G. S., Schmitt J. H. M. M., Stern R. A., Harnden F. R., Rosner R., 1988, ApJ, 325, 798
- Owocki et al. (1988) Owocki S. P., Castor J. I., Rybicki G. B., 1988, ApJ, 335, 914
- Pan et al. (2004) Pan X., Shao M., Kulkarni S. R., 2004, Nature, 427, 326
- Patterson & Raymond (1985) Patterson J., Raymond J. C., 1985, ApJ, 292, 535
- Pizzolato et al. (2003) Pizzolato N., Maggio A., Micela G., Sciortino S., Ventura P., 2003, A&A, 397, 147
- Pourbaix et al. (2004) Pourbaix D., Tokovinin A. A., Batten A. H., Fekel F. C., Hartkopf W. I., Levato H., Morrell N. I., Torres G., Udry S., 2004, A&A, 424, 727
- Randich (2000) Randich S., 2000, Stellar Clusters and Associations: Convection, 198, 401
- Roberts & Neyman (2002) Roberts L. C., Neyman C. R., 2002, The Publications of the Astronomical Society of the Pacific, 114, 1260
- Schatzman (1949) Schatzman E., 1949, Annales d’Astrophysique, 12, 203
- Schmitt et al. (1985) Schmitt J. H. M. M., Golub L., Harnden F. R., Maxson C. W., Rosner R., Vaiana G. S., 1985, ApJ, 290, 307
- Schmitt et al. (1990) Schmitt J. H. M. M., Micela G., Sciortino S., Vaiana G. S., Harnden F. R., Rosner R., 1990, ApJ, 351, 492
- Schmitt et al. (1993) Schmitt J. H. M. M., Zinnecker H., Cruddace R., Harnden F. R., 1993, ApJ, 402, L13
- Schröder & Schmitt (2007) Schröder C., Schmitt J. H. M. M., 2007, A&A, 475, 677
- Schwarzschild (1948) Schwarzschild M., 1948, ApJ, 107, 1
- Shapiro et al. (1976) Shapiro S. L., Lightman A. P., Eardley D. M., 1976, ApJ, 204, 187
- Shatsky & Tokovinin (2002) Shatsky N., Tokovinin A., 2002, A&A, 382, 92
- Simon et al. (1995) Simon T., Drake S. A., Kim P. D., 1995, PASP, 107, 1034
- Spiegel & Weiss (1980) Spiegel E. A., Weiss N. O., 1980, Nature, 287, 616
- Stauffer et al. (1994) Stauffer J. R., Caillault J.-P., Gagne M., Prosser C. F., Hartmann L. W., 1994, Astrophysical Journal Supplement Series (ISSN 0067-0049), 91, 625
- Stern et al. (1995) Stern R. A., Schmitt J. H. M. M., Kahabka P. T., 1995, Astrophysical Journal v.448, 448, 683
- Sturrock (1999) Sturrock P. A., 1999, ApJ, 521, 451
- Topka et al. (1982) Topka K., Golub L., Gorenstein P., Harnden F. R., Vaiana G. S., Avni Y., Rosner R., 1982, ApJ, 259, 677
- Vaiana et al. (1981) Vaiana G. S., Cassinelli J. P., Fabbiano G., Giacconi R., Golub L., Gorenstein P., Haisch B. M., Harnden F. R., Johnson H. M., Linsky J. L., Maxson C. W., Mewe R., Rosner R., Seward F., Topka K., Zwaan C., 1981, ApJ, 245, 163
- Voges et al. (1999) Voges W., Aschenbach B., Boller T., Bräuninger H., Briel U., Burkert W., Dennerl K., Englhauser J., Gruber R., Haberl F., Hartner G., Hasinger G., Kurster M., Pfeffermann E., Pietsch W., Predehl P., Rosso C., Schmitt J. H. M. M., Trümper J., Zimmermann H. U., 1999, A&A, 349, 389
- Voges et al. (2000) Voges W., Aschenbach B., Boller T., Brauninger H., Briel U., Burkert W., Dennerl K., Englhauser J., Gruber R., Haberl F., Hartner G., Hasinger G., Pfeffermann E., Pietsch W., Predehl P., Schmitt J., Trumper J., Zimmermann U., 2000, VizieR On-line Data Catalog, 9029, 0
- Zimmerman et al. (2010) Zimmerman N., Oppenheimer B. R., Hinkley S., Brenner D., Parry I. R., Sivaramakrishnan A., Hillenbrand L., Beichman C., Crepp J. R., Vasisht G., Roberts L. C., Burruss R., King D. L., Soummer R., Dekany R., Shao M., Bouchez A., Roberts J. E., Hunt S., 2010, ApJ, 709, 733
- Zuckerman & Song (2004) Zuckerman B., Song I., 2004, Annual Review of Astronomy &Astrophysics, 42, 685