Solitonic lattice and Yukawa forces in the rare earth orthoferrite TbFeO3
Abstract
The control of domains in ferroic devices lies at the heart of their potential for technological applications. Multiferroic materials offer another level of complexity as domains can be either or both of a ferroelectric and magnetic nature. Here we report the discovery of a novel magnetic state in the orthoferrite TbFeO3 using neutron diffraction under an applied magnetic field. This state has a very long incommensurate period ranging from Å at 3K to Å at the lowest temperatures and exhibits an anomalously large number of higher-order harmonics, allowing us to identify it with the periodic array of sharp domain walls of Tb spins separated by many lattice constants. The Tb domain walls interact by exchanging spin waves propagating through the Fe magnetic sublattice. The resulting Yukawa-like force, familiar from particle physics, has a finite range that determines the period of the incommensurate state.
Materials with magnetic transition metal and rare earth ions show a variety of spectacular effects originating from the coupling between the two spin subsystems. The transition metal spins interact stronger and order at higher temperatures than the spins of rare earth ions, but they are also much less anisotropic. That is why their orientation can be controlled by the rare earth magnetism. Such re-orientation transitions observed in many rare earth ferrites, chromites and manganites have profound effects on their magnetic, optical and elastic properties Belov_Uspekhi_1976 ; Buchelnikov_Uspekhi_1996 ; Kimel_Nature_2005 .
Recently it was realized that interactions between transition metal and rare earth spins also play an important role in multiferroic and magnetoelectric materials Kimura_Nature_2003 ; Hur_Nature_2004 ; Zvezdin_JETPLetters_2008 ; Tokunaga_NatMat2009 . Thus the coupling between the Mn spins forming a spiral state in the multiferroic TbMnO3 and the Ising-like Tb spins leads to a significant enhancement of the electric polarization induced by the spiral Prokhnenko_PRL_2007 ; Aliouane_JPCM_2008 . In GdFeO3 orthoferrite the polarization only appears when the independent magnetic orders of Fe and Gd sublattices are present simultaneously Tokunaga_NatMat2009 , while in DyFeO3 the interplay between the spins of Fe and Dy ions gives rise to one of the strongest linear magnetoelectric responses observed in single-phase materials Tokunaga_PRL_2008 .
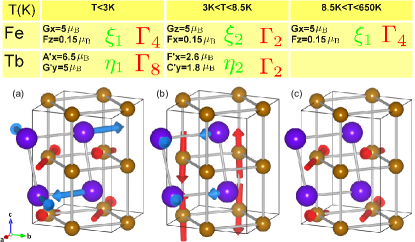
TbFeO3 is an orthorhombic perovskite (space group P) where Fe spins order antiferromagnetically in what is called G-type order along the axis and ferromagnetically (F-type) along the axis as shown on Fig. 1c. This type of commensurate spin order, denoted as , has an onset at approximately (Fe)K. On cooling in zero field TbFeO3 undergoes two transitions driven by Tb-Tb and Tb-Fe interactions Bertaut_1967 ; Bouree_1975 . The ordering of Tb spins at (Tb)8.5K occurs simultaneously with a rotation of Fe spins in the plane, so that below 8.5K ferromagnetic components of both Fe and Tb spins align along the axis, while their antiferromagnetic components are orthogonal to each other. The magnetic configuration of this intermediate temperature (IT) phase is for Fe, and for Tb (see Fig. 1b). However, below 3K there is an additional spin re-orientation transition to a low temperature (LT) phase which flips the Fe spins back to their higher temperature order, while the Tb spins order antiferromagnetically in the state (see Fig. 1a).
Single crystals of TbFeO3 were grown under 4 bar oxygen pressure using the crucible-free floating zone method. Their quality was checked by X-ray diffraction. Neutron diffraction experiments were made on a large single crystal of TbFeO3, at the BER-II reactor of the Helmholtz Zentrum Berlin using the FLEX cold triple-axis spectrometer with collimation of 60′-60′-60′, =1.3Å-1, and a cooled Be filter positioned in the scattered beam. Additional measurements were made also with the E4 two-axis diffractometer with =2.8Å. In both cases a magnetic field was applied along the axis of the sample using a superconducting horizontal field magnet. Dielectric measurements were performed at the Laboratory for Magnetic Measurements at the Helmholtz-Zentrum Berlin (LaMMB), with temperatures varying between 0.3 K and 15 K and with magnetic fields up to 1.9 T. Magnetic Field and temperature control was provided by an Oxford Instruments 14.5 T cryomagnet equipped with a Heliox 3He insert. An Andeen-Hagerling 2700A Capacitance Bridge was used to measure the capacitance and loss of a disc shaped sample of TbFeO3, which was mounted between the electrodes of a parallel-plate capacitor.
Using single crystal neutron diffraction we have probed the A,C,G and F-type orders in TbFeO3 by tracking the intensity of the corresponding magnetic Bragg reflections in zero field and in an applied field along the axis (see Methods for experimental details). In zero magnetic field our results are consistent with the previously observed sequence of the re-orientation and inverse re-orientation transitions Bertaut_1967 . Above 8.5K we find only G-type reflections, while the development of ferromagnetic order is evident from the enhanced intensities of lattice Bragg reflections. Below 8.5K we find G- and C-type reflections, while below 3K only A- and G-type reflections can be discerned.
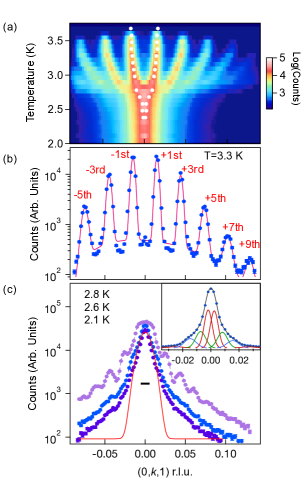
In an applied magnetic field (H) we find a far more complex behavior. Here we performed a series of field cooled measurements, while monitoring accessible A- and G-type reflections. In Fig. 2(a) we show in the form of a color plot the temperature dependence of scans along around the A-type (001) reflection. At high temperatures this reflection is absent as there is no order of an A-type component for either the Fe or Tb magnetic sublattice as indicated in Fig. 1. However, on cooling a series of reflections appears below 3.8K that seem to merge into a single peak below 2.8K. Examination of the wavevector of these reflections easily establishes that they are odd harmonics of up to 11th order. The wavevector of the 1st harmonic is with 0.015 r.l.u. [see Fig. 2(b)]. The incommensurate periodicity of this phase that we shall refer to as IC, is approximately 67 units cells or 340 Å. The full width at half maximum (FWHM) of these reflections is relatively sharp giving a coherence length of 700 Å or approximately two full cycles of this unusual order.
The physical significance of these observations is that the Tb-spin order in a H field develops a square-wave modulation – a periodic array of widely separated domain walls in Tb magnetic order. We ascribe the observed scattering to be dominated by Tb spins first because of its substantially greater intensity compared to the higher temperature Fe order found around for example G-type reflections and also because in zero field A-type reflections are associated only with Tb spin order. In the modulated A-state, Tb spins form ferromagnetic stripes in the planes with the width 170 Å along the axis. The component of magnetization alternates from stripe to stripe, while the stacking of spins along the axis is antiferromagnetic. Investigation of an Fe G-type reflection under the same condition suggests that Fe-spins are weakly perturbed by this unusual Tb-order (see supplementary information).
On cooling below 2.8K Fig. 2(a) would indicate that the Tb modulation abruptly disappears and the Tb subsystem returns to the zero field state with the uniform order. However, closer inspection of the diffraction data indicates that the (001) reflection on cooling does not yield a simple gaussian peak shape. Rather as shown in Fig. 2(c), there is clear evidence of more than one peak at 2.8K and significant deviations from a gaussian peak shape at 2.1 K. This indicates that below this inverse re-orientation transition the state remains incommensurate with a much larger periodicity than above the transition. Using carefully constrained fits of Gaussians to the data measured below 3.0K (see insert of Fig. 2(c)) it is clear that with lowering temperature decreases sharply below 2.8K but does not go to zero to yield a pure commensurate (001) reflection. Rather from the temperature dependence of , shown in the inset of Fig. 3, it is evident that below 3.7K, decreases gradually with cooling until 2.8K, below which it drops abruptly to a value of 0.002. This low temperature incommensurate (LT-IC) state has a periodicity of approximately 500 units cells or 2700 Å, which distinguishes it from the higher temperature IC phase with a smaller periodicity.
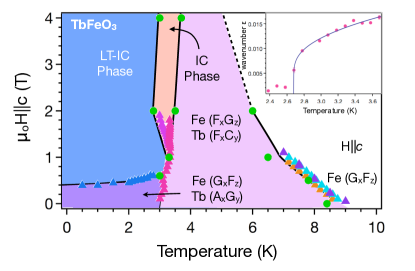
We have performed measurements similar to those shown in Fig. 2(a) at various fields as well as two zero field cooled measurements at 3.0 and 3.3 K where the field was subsequently applied isothermally in order to map out the various transitions that occur in this lower temperature regime in TbFeO3. In addition, we have conducted capacitance and loss measurements between 0.3 to 10 K in a magnetic field (H) between 0 and 1.9T. The transitions that are evident in the neutron data are correlated with anomalies in both the capacitance and loss data (see supplementary information), which allowed us to construct the phase diagram shown in Fig. 3. Interestingly, the capacitance and loss data imply that if the sample is cooled in zero field below 3 K and then field is applied, the transition into the LT-IC phase is not reversible and this state can then be stabilized in zero field (see Fig. S5).
Next we discuss the nature of interactions stabilizing such an unusual periodic domain wall array and holding the domain walls at large distances from each other. Well below (Fe)K the magnitude of the ordered antiferromagnetic moment of the Fe subsystem is independent of temperature, while its direction in the plane described by the angle can significantly vary due to the low magnetic anisotropy of the Fe3+ ions. In our notations is the order parameter of the state, while describes the ordering. The free energy density of the Fe subsystem is
| (1) |
where the first term describes the exchange between Fe spins along the axis, the second term is the magnetic anisotropy, which for favors the order, and the last term is the Zeeman interaction with the magnetic field in the state.
The free energy of Tb spins is expanded in powers of the order parameters , describing the zero phase LT state with antiparallel Tb spins in neighboring layers (Fig. 1a), and , describing the IT state with parallel Tb spins in neighboring layers (Fig. 1b):
| (2) | |||||
For the Tb subsystem would order in the state with below some temperature , at which . However, the interaction between the Tb and Fe spins favors the IT state with and , in which both subsystems have a ferromagnetic moment along the axis. Since and transform in the same way (see the supplemental material), this interaction is a linear coupling,
| (3) |
For , the ‘unnatural’ IT state with parallel Tb spins in neighboring layers and Fe spins rotated by away from the easy axis, intervenes between the states with the ‘natural’ orders of Fe and Tb spins. In this way one obtains the zero-field phase diagram of TbFeO3Bertaut_1967 ; Belov_JETP_1979 .
In addition, we consider the so-called Lifshitz invariants linear in order parameter gradients,
| (4) |
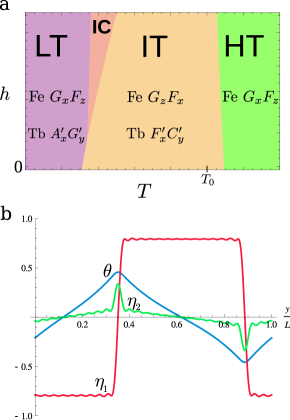
which favor the experimentally observed periodic spin modulation along the axis. Similar terms inducing modulations along the and axes are forbidden by symmetry (see the supplemental material). Minimizing the total free energy – the sum of Eqs.(1-4) – we obtain the phase diagram shown in Fig. 4a, which includes a narrow incommensurate (IC) phase region, which we assign to the same IC phase revealed in our neutron data.
It is important to stress the difference between the IC state in TbFeO3 and the long period spin spirals in non-centrosymmetric magnets, also described using Lifshitz invariants Dzyaloshinskii_JETP_1964 . First, the crystal lattice of TbFeO3 is centrosymmetric (inversion symmetry is only broken in the LT phase by the Tb spin ordering). Equation (4) is the interaction between two distinct magnetic phases: the LT Tb state (odd under inversion) and the IT phase (even under inversion). It is only effective close to the boundary where these two phases have equal free energies, which is why the IC state is observed in a very narrow region of the phase diagram.
Second, spirals in non-centrosymmetric magnets result from the relatively weak spin-orbit coupling Dzyaloshinskii_JETP_1964 ; Moriya_PR_1960 . On the other hand, the coupling Eq.(4) likely originates from a stronger Heisenberg exchange: in the supplemental material we give symmetry arguments showing that the exchange interactions between the Tb and Fe spin orders varying along the axis do not cancel. Furthermore, the coupling between two Tb order parameters [the second term in Eq.(4)] resulting from interactions between rare earth spins separated by relatively long distances, is expected to be much weaker than interactions between the Tb and Fe spins described by the first term (in our calculations ).
Third and most important, the observation of the large number of Fourier harmonics in the IC state of TbFeO3 shows that this state is qualitatively different from a magnetic spiral with slowly varying spin vectors. To account for the difference between the isotropic Fe spins and the Ising-like Tb spins Bouree_1975 ; Bidaux75 , we assumed that and allowed for 25 harmonics in the periodic modulation of order parameters when we minimized the free energy. The resulting incommensurate state is shown in Fig. 4b. While the angle describing the Fe spins undergoes small amplitude fan-like oscillations around zero, corresponding to the oscillations of the weak ferromagnetic moment of Fe ions around the applied magnetic field , the low-temperature Tb order parameter exhibits sudden jumps.
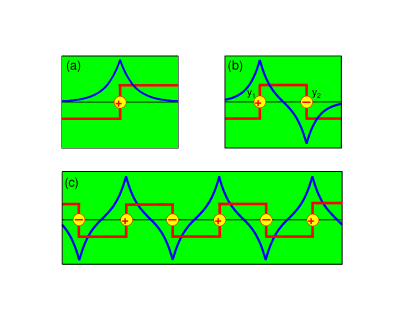
To understand the nature of the force that holds these atomically sharp domain walls at distances of Å from each other, we (briefly) discuss an interesting field-theoretical interpretation of the coupled system of rare earth and transition metal spins. Consider a single domain wall located at where the Ising-like LT order parameter shows a discontinuous jump from to or vice versa (see Fig. 5a). Such a kink can be assigned the topological charge . The free energy per unit area of the domain wall is the ‘bare’ energy resulting from interactions between Tb spins plus
| (5) |
where the first term is the Lifshitz invariant Eq.(4) ( and ), describing the interaction between the Tb and Fe spins, while the second term is the free energy of Fe spins for . Equation (5) can be interpreted as an energy of a charged plane with the surface charge density (a ‘nucleon’) interacting with the field , which describes spin waves in the Fe magnetic subsystem playing the role of pions with the mass . Minimizing with respect to , we obtain the distortion in the Fe spin ordering produced by the Tb domain wall, (see Fig. 5a), which reduces the domain wall free energy:
| (6) |
When becomes negative, the domain walls tend to condense. Their density is, however, limited by Yukawa-like interactions between the domain walls, which result from the exchange of massive particles and have the range . These interactions attract equal ‘electric’ charges and repel opposite ones. Neighboring domain walls in a periodic array have opposite ‘electric’ charges, since topological charges of the domain walls alternate along the axis. The interaction between two neighboring domain walls located at and [see Fig. 5(b)] is
| (7) |
and the total ‘electrostatic’ free energy of an array of domain walls with the charges alternating along the axis (including the ‘self-energy’ of the charged surfaces) is given by
| (8) |
where is the position of the -th kink. Minimizing the free energy density for an equidistant array of kinks (see Fig. 5(c)), we obtain the optimal period of the incommensurate state. Its temperature dependence fits well the experimental data above 2.8K, as shown in the inset of Fig. 3. The length scale for the period of the IC state, set by Å, is essentially the thickness of the domain wall in the antiferromagnetic ordering of Fe spins, even though such walls are not present in the IC state. Thus the long period of the IC state of Tb spins originates from the large stiffness and low magnetic anisotropy of the Fe magnetic subsystem.
The nature of the LT-IC phase remains a puzzle, as the low temperature state of our theoretical model, in which the domain wall free energy becomes positive, is uniform. One possibility is that the IC order at the lowest temperatures is short-ranged. Such a state might be formed by isolated metastable domain walls stabilized by impurities and crystal imperfections and separated by the average distance of 1500 Å. Such a conclusion can not be excluded from the experimental data due to the small value of for this state.
The tantalizing suggestion from our work is that periodic domain wall arrays may be present in other orthoferrites and orthochromites, since they have similar zero field magnetic phases. Therefore, identifying domain states as the one we describe here is important for understanding their magnetoelectric and multiferroic properties. Domain walls induced by interactions between the rare earth and transition metal magnetic subsystems may also be relevant for the applications of this class of materials, as the dynamics of these domain walls, coupled by long-ranged interactions can strongly affect the switching of the spontaneous electric polarization with an applied magnetic field and vice versa.
Acknowledgements: DNA and SL thank the Deutsche Forschung Gemeinschaft for support under contract AR 613/2-1. The neutron scattering work was supported by the Danish National Research Council through DANSCATT. NPJ thanks Prof. J rn Bindslev Hansen, for support and guidance.
References
- (1) K. P. Belov, A. K. Zvezdin, A. M. Kadomtseva, and R. Z. Levitin,“Spin-reorientation transitions in rare-earth magnets”, Sov. Phys. Uspekhi 19, 574–596 (1976).
- (2) V. D. Buchel’nikov, N. K. Dan’shin, L. T. Tsymbal, and V. G. Shavrov, “Magnetoacoustics of rare-earth orthoferrites”, Phys. Usp. 39, 547 - 572 (1996).
- (3) A. V. Kimel, A. Kirilyuk, P. A. Usachev, R. V. Pisarev, A. M. Balbashov, and Th. Rasing, “Ultrafast non-thermal control of magnetization by instantaneous photomagnetic pulses”, Nature 435, 655-657 (2005).
- (4) T. Kimura, T. Goto, H. Shintani, K. Ishizaka, T. Arima, and Y. Tokura, “Magnetic Control of Ferroelectric Polarization”, Nature 426, 55 (2003).
- (5) N. Hur, S. Park, P.A. Sharma, J.S. Ahn, S. Guha, and S-W. Cheong, “Electric polarization reversal and memory in a multiferroic material induced by magnetic fields”, Nature (London) 429, 392 (2004).
- (6) A. K. Zvezdin and A. A. Mukhin, “Magnetoelectric interactions and phase transitions in a new class of multiferroics with improper electric polarization”, JETP Letters, 88, 505 - 510 (2008).
- (7) Y. Tokunaga, N. Furukawa, H. Sakai, Y. Taguchi, T. Arima, and Y. Tokura, “Composite domain walls in a multiferroic perovskite ferrite”, Nature Mater. 8, 558 (2009).
- (8) O. Prokhnenko, R. Feyerherm, M. Mostovoy, N. Aliouane, E. Dudzik, A. U. B. Wolter, A. Maljuk, and D. N. Argyriou, Coupling of Frustrated Ising Spins to the Magnetic Cycloid in Multiferroic TbMnO3, Phys. Rev. Lett. 99, 177206 (2007).
- (9) N. Aliouane, O. Prokhnenko, R. Feyerherm, M. Mostovoy, J. Strempfer, K. Habicht, K. C. Rule, E. Dudzik, A. U. B. Wolter, A. Maljuk, and D. N. Argyriou, Magnetic order and ferroelectricity in RMnO3 multiferroic manganites: coupling between R- and Mn-spins, J. Phys.: Condens. Matter 20, 434215 (2008).
- (10) Y. Tokunaga, S. Iguchi, T. Arima, and Y. Tokura, “Magnetic-Field-Induced Ferroelectric State in DyFeO3”, Phys. Rev. Lett. 101, 097205 (2008).
- (11) E.F. Bertaut, J. Chappert, J. Mareschal, J.P. Rebouillat and J. Sivardiere, “Structures Magnetiques de TbFeO3”, Solid State Commun. 5, 293 - 298 (1967).
- (12) J. E. Bouree and J. Hammann, “Mise en évidence expérimentale des effets de forme dans l’orthoferrite de terbium”, J. Phys. (Paris) 36, 391 (1975)
- (13) K. P. Belov, A. K. Zvezdin, and A. A. Mukhin, Sov. Phys. JETP 49, 557 (1979).
- (14) I. Dzyaloshinskii, Sov. Phys. JETP 19, 960 - 971 (1964).
- (15) T. Moriya, Phys. Rev. 120, 91 - 98 (1960).
- (16) R. Bidaux, J. E. Bouree and J. Hammann, “Dipolar interactions in rare earth orthoferrites - II”, J. Phys Chem. Solids, 36, 655 - 659 (1975).
- (17) E. F. Bertaut, in Magnetism, edited by G. T. Rado and H. Suhl (Academic, New York, 1963), Vol. 3, p. 149.
Supplemental material
I Symmetry analysis
We use the so-called Bertaut’s notationsBertautnotation to describe the symmetry of magnetic states of TbFeO3 (see Table 1). The ordering of Fe spins in the HT phase is described by the representation. In the IT state both Fe and Tb spin orders have symmetry, while in the LT phase the Fe order changes back to , while the ordering of Tb spins has symmetry (see Fig. 1). Furthermore, the Lifshitz invariant has the form
| (9) |
from which Eq.(4) follows. We note that the rotationally symmetric scalar products,
| (10) |
where e.g. , are also invariant under all transformations of the P group showing that the coupling between inhomogeneous rare earth and transition metal magnetic orders can originate from Heisenberg exchange interactionsAliouane_JPCM_2008 .
| Fe | Tb | ||||
|---|---|---|---|---|---|
II Measurements of the (011) G-type reflection
Although the magnetic environment in our diffraction experiment constrains the portions of reciprocal space that we can access, we were able to also probe a limited region around the G-type reflection (0,1,1). In a field H= 2T we observe IC reflections below 3.5K with the same incommensurability and temperature dependence as for the satellites around the A-type (0,0,1) reflection (see Fig. S1 in the supplementary information). The commensurate (0,1,1) G-type reflection observed above 3.5K arises only from the Fe-spin ordering (see Fig. 1). The fact that the intensity of the commensurate reflection does not vary through this transition suggests that the Fe order is not significantly perturbed, in agreement with our theory.
![[Uncaptioned image]](/html/1103.4275/assets/x6.png)
FIG. S1: Single crystal neutron diffraction data measured on cooling and in a magnetic field parallel to the -axis of H=2T. Scans are measured in reciprocal space along (0,,1) around the G-type reflection (0,1,1). As above the temperature dependent neutron diffraction measurements are represented in a two-dimensional plot with intensity depicted as color on a log scale shown on the right of the panel. The 1st and 3rd harmonic reflections are evident below 3.4 K.
III Dielectric Measurements
Measurements of the capacitance and loss were performed both as a function of temperature between 0.3 and 15K in field cooled mode and isothermally as a function of magnetic field up to 1.9 T, in zero field cooled mode. In our measurements, a calibrated Cernox resistance thermometer (CX-1030) on the sample holder was used to monitor the sample temperature, which was measured with an LakeShore 370 AC Resistance Bridge. The resolution of the temperature measurement is , although the temperature stability decreases around 3 K, due to the boiling temperature of liquid 3He of 3.2 K. The capacitance and loss measurements were performed at a frequency of 1000 Hz and an excitation of 15 V. The resolution of the capacitance measurement is .
![[Uncaptioned image]](/html/1103.4275/assets/x7.png)
![[Uncaptioned image]](/html/1103.4275/assets/x8.png)
FIG. S2: Example data of capacitance and loss measured from a single crystal of TbFeO3 between 0 and 1.5 T as a function of temperature between 5 and 15 K. Here the sample was cooled with an applied magnetic field and measurements were taken continuously during warmup with a sweep rate of 125 mK per minute. We found that measurement on cooling showed exactly the same behavior. We also noted that that measurements after field cooling and zero field cooling do not differ in this temperature range.
![[Uncaptioned image]](/html/1103.4275/assets/x9.png)
![[Uncaptioned image]](/html/1103.4275/assets/x10.png)
FIG. S3: Example data of capacitance and loss measured from a single crystal of TbFeO3 between 0 and 1.9 T as a function of temperature between 2 and 3.5 K. Here the sample was cooled with an applied magnetic field while measurements were taken continuously during warming with a sweep rate of 30 mK per minute. Measurements were also performed down to 0.3 K, but no anomalies were found indicating the absence of further transitions.
![[Uncaptioned image]](/html/1103.4275/assets/x11.png)
![[Uncaptioned image]](/html/1103.4275/assets/x12.png)
FIG. S4: Example data of capacitance and loss measured from a single crystal of TbFeO3 as a function of magnetic field between 5 and 10 K and up to 1.5 T. The sweep rate of the magnetic field used here was 50 mT per minute. Measurements were taken isothermally after zero field cooling.
![[Uncaptioned image]](/html/1103.4275/assets/x13.png)
![[Uncaptioned image]](/html/1103.4275/assets/x14.png)
FIG. S5: Example data of the capacitance and loss measured at 0.5 and 2.5 K up to 1.5 T. A clear peak is observed for data measured after zero field cooling at 0.5 T, consistent with the transition from the commensurate to the LT-IC phases observed using neutron diffraction. The same peak is not observed when the field was ramped down from 1.5 T and neither is it found if we ramp the field up again. This behavior was consistent for a series of measurements between 0.3 to 2.5K and suggests that over this temperature range the LT-IC phase once entered into with field, is stable down to zero field. The sweep rate of the magnetic field for these measurements was 50 mT per minute.