A detailed spectral study of GRB 041219A and its host galaxy
Abstract
GRB 041219A is one of the longest and brightest gamma-ray bursts (GRBs) ever observed. It was discovered by the INTEGRAL satellite, and thanks to a precursor happening about 300 s before the bulk of the burst, ground based telescopes were able to catch the rarely-observed prompt emission in the optical and in the near infrared bands.
Here we present the detailed analysis of its prompt -ray emission, as observed with IBIS on board INTEGRAL, and of the available X-ray afterglow data collected by XRT on board Swift. We then present the late-time multi-band near infrared imaging data, collected at the TNG, and the CFHT, that allowed us to identify the host galaxy of the GRB as an under-luminous, irregular galaxy of at best fit redshift of .
We model the broad-band prompt optical to -ray emission of GRB 041219A within the internal shock model. We were able to reproduce the spectra and light curve invoking the synchrotron emission of relativistic electrons accelerated by a series of propagating shock waves inside a relativistic outflow. On the other hand, it is less easy to simultaneously reproduce the temporal and spectral properties of the infrared data.
keywords:
gamma-rays: observations – gamma-rays: bursts – galaxies: photometry1 Introduction
Gamma-ray bursts (GRBs) were discovered in the late 1960s (Klebesadel et al., 1973), and 40 years later they are still not fully understood (see e.g. Gehrels et al., 2009, for a recent review). They are short lived transients (ms to hundreds of seconds) of soft gamma ray radiation that appear at random directions on the whole sky. A major breakthrough in GRB science has been achieved in the late 1990s, when thanks to the rapid localizations performed by the Italian-Dutch satellite BeppoSAX the first transient counterparts, the so-called afterglows, have been discovered at X-ray (Costa et al., 1997), optical (van Paradijs et al., 1997), and radio wavelengths (Frail et al., 1997). These and the subsequent measurements, thanks to the HETE-II, INTEGRAL, and Swift satellites have made it possible to firmly prove the cosmological nature of these sources, being their redshifts, , distributed in the range (). Thanks to the distance measurements, the energy and luminosity of GRBs could be determined making them the most powerful explosions in the Universe, since their isotropically emitted energy spans from 1050 to 1054 erg (Amati, 2007). However, this huge amount of energy request can be reduced in the hypothesis that GRBs are collimated sources (Rhoads, 1997), and indeed the detection of some achromatic breaks (e.g. Zeh et al., 2006) in the light curves of GRB afterglows further supports this interpretation. From the measure of the break times the jet opening angles, , can be derived (Sari et al., 1999a), and taking this into account the energy reservoir and its spread can be reduced, clustering around 1051 erg (Frail et al., 2001; Bloom et al., 2003). In several cases late bumps in the afterglow light curves have been reported (e.g. Bloom et al., 1999). These bumps have been interpreted as an emerging supernova component. In a handful of cases the GRB/SN association has been spectroscopically confirmed (see Woosley & Bloom, 2006, for a review). These arguments and the energetic budgets point towards the collapse of a massive ( 30 M⊙) star as being at the origin of GRBs, at least for the events lasting longer than 2 s (Woosley et al., 1993).
GRB 041219A was detected and localized in real time by the INTEGRAL Burst Alert System (IBAS; Mereghetti et al., 2003). The alert was issued when the burst was still on going, and this allowed some robotic telescopes to detect a prompt optical and infrared flash (Vestrand et al., 2005; Blake et al., 2005) whose position was consistent with the IBAS one (Götz et al., 2004).
Only a handful of bursts have been observed in the visible range during the prompt phase, and, as often in GRB physics, it is impossible to identify a single common behaviour (see Yost et al., 2007a, b). GRB 990123 was bright and showed no clear link between the three measurements made during the prompt phase and the gamma-ray data (Akerlof et al., 1999; Briggs et al., 1999). The “naked eye burst” GRB 080319B was even brighter, and may show some correlation with a delay of a few seconds between the optical and the high energy emission (Racusin et al., 2008). GRB 050820A (Vestrand et al., 2006) and GRB 041219A were much weaker (both in apparent and absolute magnitudes) and their optical fluxes were apparently correlated to the -rays. In these two latter cases it seems reasonable to believe that the prompt emission can be explained by the same mechanism at high and low energy (Genet et al., 2007b). Conversely, the two optically bright bursts probably require different physical conditions or/and a different radiative process in the regions emitting the low and high energy photons respectively (Sari & Piran, 1999b; Mészáros & Rees, 1998; Zou et al., 2009; Hascoët et al., 2010).
GRB 041219A is the longest and brightest GRB in the IBAS sample (Vianello et al., 2009). Indeed the very good quality of the gamma-ray data allowed Götz et al. (2009) to measure the time-variable high linear polarization of this event in the 200–800 keV energy band, partly confirming previous but less significant results (Kalemci et al., 2007; McGlynn et al., 2007). Here we present the detailed spectral analysis of the prompt -ray emission of GRB 041219A, as measured by IBIS, and SPI-ACS on board INTEGRAL (Winkler et al., 2003), of its X-ray afterglow, as measured by Swift/XRT, and the identification of its host galaxy, as observed by the TNG, and the CFHT, as well as the modelling of the broad band, optical to -ray, prompt emission of the GRB.
2 Observations and Data Reduction
2.1 INTEGRAL observations
IBAS triggered at 01:42:17 UTC (from now on ) on December 19th 2004 (IBAS Alert # 2073), on a precursor of GRB 041219A indicating a 38.2 sigma source at R.A. = 00h 24m 26s, Dec. = +62∘ 50′ 06′′ ( = +119.86∘; = +0.13∘) with a 2.5′ uncertainty . We selected the corresponding INTEGRAL pointing (SCWID: 026600780010), and processed the data using the Off-line Scientific Analysis (OSA) software provided by the INTEGRAL Science Data Centre (ISDC, Courvoisier et al. 2003) v8.0.
We analysed IBIS (INTEGRAL coded mask imager; Ubertini et al., 2003) data. Our analysis is based on data taken with ISGRI (Lebrun et al., 2003), the IBIS low energy detector array, which is made of CdTe crystals, and is working in the 13 keV–1 MeV energy range, and on PICsIT (Di Cocco et al., 2003) a pixellated CsI detector, working in the 150 keV–10 MeV energy range. In the ISGRI 20-100 keV image the only detected source is GRB 041219A, which is localized at R.A. = 00h 24m 27s, Dec. = +62∘ 50′ 21′′ with a 19′′ uncertainty, consistent with the IBAS and the infrared (Blake et al., 2005) positions. We used this position to extract ISGRI spectra in 62 logarithmically spaced bins between 13 keV and 1 MeV. ISGRI light curves have been obtained by binning (t=1 s) the ISGRI events in three different energy bands (20–40; 40–100; 100–300 keV). The background has been subtracted by fitting a constant value to these light curves using the data of the same pointing before the bursts itself (i.e. before 01:41:00 UTC).
The source is also clearly detected in the PICsIT single events histograms (252–336 keV band), but the positional uncertainty in this case is larger and we do not report the PICsIT position here. PICsIT histograms are not suited for spectral extraction in this case, since they are integrated over the entire duration of the pointing (1800 s). For spectral and light curves extraction we used PICsIT spectral timing data. They have no positional information, since they represent the total count rate of the PICsIT camera in 4 energy bands (158–208; 208–260; 260–364; 364–676 keV). We used them to extract light curves, rebinned at 4 s intervals. These light curves have been background subtracted by evaluating the background before and after (next pointing) the GRB. The same data have then been used to extract PICsIT spectra by summing the count rates relative to the GRB in 4 bands and rebinning the PICsIT response matrix in order to cope with available energy bands. Due to the fact that the GRB was in the fully coded field of view, no further corrections were necessary, and the standard ancillary response file could be used. For the spectral analysis, background spectra have been derived by using the pointing before and the pointing after the GRB.
For timing purposes only, we also used the data of the Anti-Coincidence System (ACS) of the INTEGRAL spectrometer SPI (Vedrenne et al., 2003). ACS data consist of the total count rate (50 ms time resolution) above 100 keV measured by the 91 Bismuth Germanate (BGO) scintillator crystals that surround SPI. The crystals are used as the anti-coincidence system of the spectrometer, but are also capable of detecting high-energy transient events such as bright GRB and SGR bursts (von Kienlin et al., 2003). We computed the ACS light curve with a bin size of 5 s and estimated the background by fitting a constant value to the data of the same pointing excluding the burst itself.
2.2 Swift/XRT observations
At the epoch of GRB 041219A, the automated slewing of the Swift narrow-field instruments was not enabled yet: for this reason the X-Ray Telescope (XRT) did not begin collecting data until about 5 hours after the IBIS detection. Swift/XRT observed the afterglow for roughly 0.6 ks in windowed timing (WT) mode and for about 1 ks in low rate photodiode (LR) mode (see Hill et al., 2004, for more details on the XRT data-taking modes). Given the low count rate, here we only considered WT data.
The data were processed with standard procedures and screening criteria using the xrtpipeline (version 0.12.3 under the Heasoft package 6.6). We extracted the source events from a pixels (1 pixel corresponds to about 2.36 arc sec) box along the image strip; a region of the same shape and size, positioned well outside the point-spread function of the source, was used to estimate the background. The ancillary response file was generated with xrtmkarf, and it accounts for vignetting and point-spread function corrections.
2.3 TNG/NICS observations
The first attempt to identify the host galaxy of GRB 041219A, was made through an H-band observation of the field of the GRB with the NICS camera mounted on the 3.5 m TNG111http://www.tng.iac.es/ telescope at La Palma.
Observations of the field of GRB 041219A were performed on Oct 15th 2007, i.e. a few years after the GRB. The observations were secured under good observing conditions with about 1 ″ seeing in the band. In total 15 frames with 30 s exposure and NDIT=3 were collected. Data reduction was carried out following standard procedures with the Eclipse package (Devillard, 2001). The median of the input frames was derived to obtain a sky frame which was subsequently subtracted from the input frames. Then sub-pixel registration was applied, and a final scientific frame was obtained averaging all input frames. An astrometric solution was derived by a large number of 2MASS222http://www.ipac.caltech.edu/2mass/ objects and the final absolute accuracy is about 0.5″ both in R.A. and Dec. Aperture photometry was computed with tools provided by the GAIA package333http://star-www.dur.ac.uk/pdraper/gaia/gaia.html and the absolute calibration was derived by comparison with a suitable number of not-saturated, isolated 2MASS stars in the field.
2.4 CFHT/WIRCam observations
Further observations of the field of GRB 041219A were obtained during the night of October 6th 2009 (program ID: 09BF08) with the WIRCam instrument at the 3.6 m CFHT in Mauna Kea under good sky conditions (seeing 0.5–0.8′′), providing a complete set of photometric images. The region of GRB 041219A was observed in the , , , and filters for about 30 minutes per filter.
In order to perform sky subtraction, a first stack of the images has been produced using a median of the input images. Saturation masks have been generated looking for saturated pixels in the individual images, in order to discard saturated objects from the catalogues. A global astrometric solution has been found for the whole dataset using the 2MASS catalogue as an absolute reference. A single binary mask, masking all the sources detected with sextractor has then been produced, and the sky value for each pixel could be determined. On the sky subtracted images relative photometry and astrometry could then be performed. The internal dispersion (difference between same objects coordinates in different images) of the astrometric solution for high S/N objects is small, 0.06′′, and the reference dispersion (difference between the object coordinates in our images and the 2MASS catalog ones) of the astrometric solution for the high S/N objects is around 0.13′′ (similar to the internal accuracy of the 2MASS astrometry).
The stability of the sky emission was not perfect during this run. As a consequence, a number of images show strong large scale gradients in the background, even after the sky-subtraction, because of the short time scale fluctuations of sky emission lines. The following procedure was applied to remove this pattern before the combination of the images: we ran sextractor on the individual images with a mesh size of 256 pixels and using a very aggressive masking of the objects (produced during the sky-subtraction step). The output background image was then subtracted to the input image.
One stack is finally produced for each of the four filters (, , , and ).
The absolute photometry is then checked: while for the , , and bands the 2MASS catalog has been used as a photometric reference, for the band zero points have been adopted from CFHT observations of standard stars444 http://www.cfht.hawaii.edu/Instruments/Imaging/
WIRCam/IiwiVersion1Doc.html#Part6.
3 Analysis and Results
3.1 INTEGRAL
3.1.1 Timing analysis
GRB 041219A, being the brightest and longest burst detected by INTEGRAL, is the only one for which good PICsIT data are available. Therefore we included them in our analysis. In this section we present the analysis of this GRB using both IBIS detector planes and the Anti-Coincidence System (ACS) of the INTEGRAL spectrometer.
The light curve of GRB 041219A, as measured by the different high-energy instruments is shown in Fig. 1. The GRB consists of two main peaks, which are preceded by two precursors, the second of which is detected only in the ISGRI data. The ISGRI data are affected by telemetry saturation for what concerns the first precursor, and the two main peaks, hence these light curves are not representative of the true ISGRI recorded flux. PICsIT and ACS data, also shown in Fig. 1, are complementary to the ISGRI ones in the sense that they extend the observable energy range to higher values, but, in view of the globally smaller number of registered counts, they are not telemetry limited on what concerns the two main peaks.

3.1.2 Spectral analysis
ISGRI spectra have been derived for the four different sections of the GRB identified as first and second precursor, and first and second peak, as defined in Table 1. PICsIT spectra were obtained by integrating the spectral timing data over the same time intervals considered for the ISGRI analysis. Only for the first and second peak PICsIT data have enough statistics to be included in the spectral fits.
The data were grouped with a minimum of 20 counts per energy bin and the spectra were analysed with the xspec fitting package version 11.3. A multiplicative factor has been added to the joint fits in order to take into account the instruments inter-calibration. The two datasets never needed to be adjusted by more than 30%. For fitting purposes a simple power law model has been considered as a first approach, then an exponential high-energy cut-off has been adopted to better describe the data, and finally a “Band” GRB model has been used if necessary. The results of the fits are reported in Table 1. Due to the high flux, 3% of systematics has been added to the spectra during the fit.
The first precursor has a very hard spectrum with respect to the rest of the GRB, as is seen also from the light curves inspection (see Fig. 1). It can be well fit by a single power law model, but a slight improvement can be achieved if the spectrum is fitted with a cut-off power law model, see Table 1. Even if the cut-off energy, , is not well constrained for what concerns its maximal value, a solid lower limit can be derived, as shown by the contour plot (photon index vs. cut-off energy) of Fig. 2.
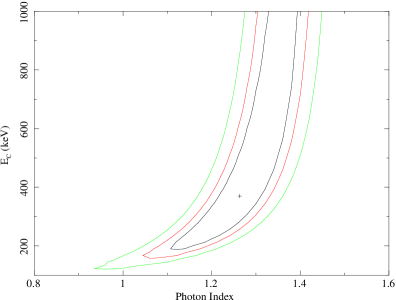
The derived (90%) lower limit for the cut-off energy () is 180 keV , corresponding to an energy555 is given by (2-) in this case. larger than 130 keV, and a best fit value of 370 keV, making this part the hardest of the whole GRB.
The second precursor shows a soft spectrum, and it can be described by a simple power law model without the need of any cut-off. Other models like a black body or the quasi-thermal model (see below) can be ruled out (/d.o.f. = 343.5/46, and /d.o.f. = 57.3/42, respectively). It is the softest part of the whole GRB, as it is not detected above 100 keV.
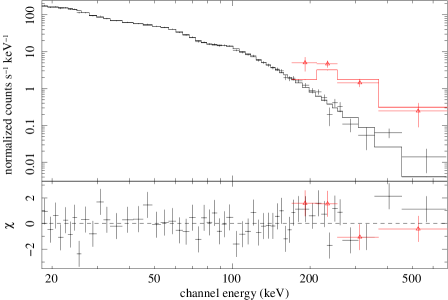
The first main peak is very bright, and in this case the single power law fit can be excluded (/d.o.f. = 116.63/59), while the cut-off power law model and the Band model give an equally good representation, with /d.o.f. = 72.29/58 and /d.o.f. = 72.11/57. But having the Band model an extra degree of freedom, and being the parameter not well constrained, in Table 1 we report only the fits done using the cut-off power law model. The simultaneous ISGRI and PICsIT best fit model and data are shown in Fig. 3.
The second peak is fainter and softer than the first one. As for the first peak, it can equally well be fit by a Band model or by a cut-off power law, and the best fit of the joint ISGRI/PICsIT data is reported in Table 1. The simple power law model, on the other hand, is excluded (/d.o.f. = 103.97/54). The derived in this case is significantly smaller than the one derived for the first peak, as can be seen by comparing the two values in Table 1.
| Name | TStart | TStop | d.o.f | PICsIT | ||||
|---|---|---|---|---|---|---|---|---|
| UTC | UTC | keV | keV | |||||
| First Precursor | 01:42:17 | 01:43:12 | 1.410.04 | - | - | 60.52 | 49 | no |
| 01:42:17 | 01:43:12 | 1.260.13 | 180a | 134a | 57.67 | 48 | no | |
| Second Precursor | 01:43:27 | 01:44:12 | 2.160.06 | - | - | 31.41 | 44 | no |
| First Peak | 01:46:22 | 01:47:40 | 1.420.05 | 347 | 201 | 68.37 | 58 | yes |
| Second Peak | 01:48:12 | 01:48:52 | 1.710.06 | 334 | 97 | 78.03 | 52 | yes |
| 1st peak+ 2nd peak | 01:46:02 | 01:50:42 | 1.530.01 | 353 | 166 | 77.59 | 62 | yes |
-
a
The best fit values are 370 keV and 274 keV for and , respectively.
The average ISGRI/PICsIT spectrum of the two main peaks is also well fit by a cut-off power law, and its parameters are also reported in Table 1. Its fluence in the 20–200 keV energy band is 2.510-4 erg cm-2. The bolometric (1 keV–10 MeV) fluence of the whole GRB is 10-4 erg cm-2. The derived spectral parameters can be used to determine the (Atteia, 2003; Pélangeon et al., 2006) for GRB 041219A, which results to be 0.190.06. Using this distance estimator the isotropic equivalent energy released by this GRB would be of the order of 21052 erg.
We note that, except for the first precursor, the spectral parameters derived here are compatible within the errors with the ones derived by McBreen et al. (2006), obtained using the germanium spectrometer, SPI, on board INTEGRAL. The differences for the first precursor, that in our analysis is softer, may result from the much better statistics we have at low energies in the current analysis. Furthermore using the quasi-thermal model, composed by the sum of a black body and a power law, for modelling the rest of the GRB, as proposed by the same authors, we cannot confirm their findings in terms of black body temperatures, obtaining keV for the first peak and keV for the second, while they obtain much higher values.
Thanks to the fact that GRB 041219A is very bright, we have been able to perform a detailed time-resolved analysis. We extracted contiguous spectra integrated over 20 s during the main GRB emission (i.e. excluding the precursors). Due to the lower signal-to-noise ratio, the spectra were just fitted with simple power-law models. The results are presented in Figure 4. As can be seen, a classical hard-to-soft evolution is observed, and we note that the photon index evolves from about 1.5 to about 2.5, indicating that while decreases during the burst (as indicated by the values in Table 1) it literally crosses the IBIS/ISGRI energy domain, since the values of measured at the end of the burst are likely to be the asymptotic value of the parameter of the Band function.

3.2 X-ray afterglow
The observed net count rate during the WT mode observations was as low as counts s-1 between 0.3 and 10 keV, so no pile-up correction was necessary. The data were grouped with a minimum of 20 counts per energy bin. Given the paucity of counts, we fit a simple model to the data: a power law corrected for absorption. We obtained the following best-fitting ( for 14 degrees of freedom) parameters: absorbing column cm-2 and photon index . The observed (not corrected for absorption) 0.3–10 keV flux was erg cm-2 s-1 at + 5 hours, while the absorption corrected one was erg cm-2 s-1. All uncertainties are quoted at 1 confidence level. We note that the absorbing column density we derive is larger than the value reported by Kalberla et al. (2005) (8 cm-2), but the two values are compatible at a 2 level, and the resolution of the LAB HI survey, being of the order of 0.6∘, is too coarse for clumpy low-latitude Galactic regions. But the difference may also be accounted for by the absorption within the GRB host galaxy, being this excess value typical of GRB afterglows (e.g. Campana et al., 2010).
3.3 Near Infrared Photometry
We have observed the field of GRB 041219A, obtaining first -band photometry with the NICS camera at the Italian Telescopio Nazionale Galileo, as well as later photometry in the bands with WIRCam mounted at the Canada-France Hawaii Telescope. One object is clearly detected in our images with a position compatible with the one of the prompt infrared flash (Blake et al., 2005).
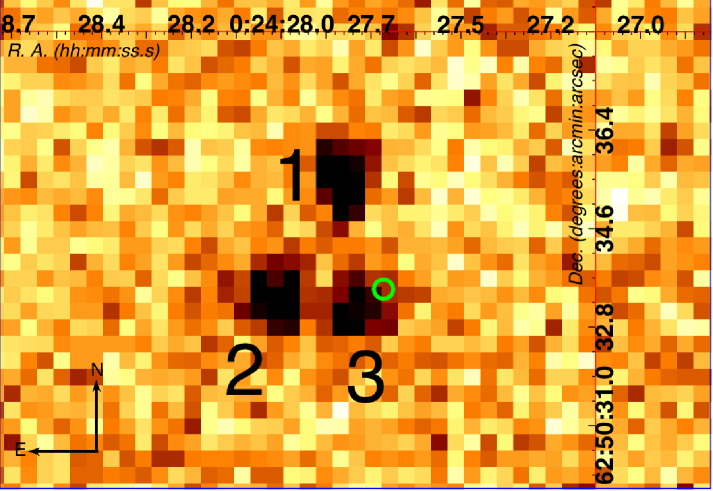
Data corresponding to this object (labeled “Object 3”, see Fig. 5) are listed in Table 2. We only list the CFHT results, whose higher quality supersedes the TNG data. We must remark that the position of this source is within the Galactic plane (), and thus it is expected to be heavily reddened.
3.3.1 Object Identification
We have compared the colours of Object 3 to several models of different galaxy types, in order to obtain some information about the probable redshift and spectral type. In Fig. 6 we present the results of such comparison. We have performed the same analysis for two nearby objects (labeled 1 and 2, and already noticed by Blake et al. 2005), but they were not compatible with typical colours of galaxies of any type. The objects have been de-reddened using the local value as given in Schlegel et al. (1998), which yields and mags – the correction is also shown in the plots. Given the low Galactic latitude of the GRB and the coarse resolution of the Schegel maps (2∘), we checked the absorption value against our X-ray afterglow observations applying the relation between optical extinction and hydrogen column density derived by Güver & Özel (2009), (cm-2) (mag). Using the value derived from our X-ray afterglow observations, we obtain mags, which is compatible within the errors with the value derived by Schlegel et al. (1998), that has hence been used as the reference value in this work.
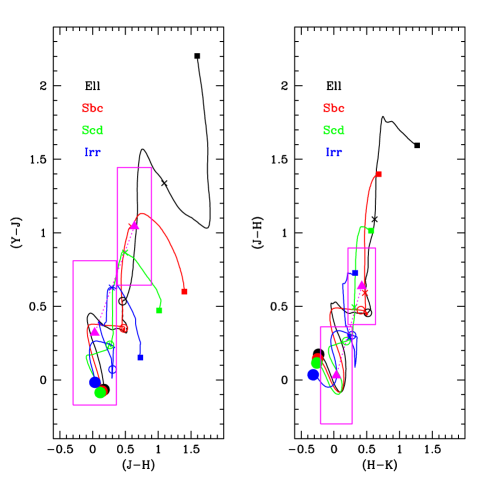
Figure 6 shows that the de-reddened colours of Object 3 are compatible with moderate redshift solutions. We have indeed used the photometric redshift code by Fernández-Soto et al. (1999) to estimate the redshift and basic properties of the host galaxy, finding that the best fit solution corresponds to an irregular galaxy template at redshift . We must remark, however, that there is a high degeneracy of the models in that region of colour space, which renders possible a large subset of galaxy models, spanning from early-type galaxies at low redshifts ( to ) to late-type models at moderate redshifts ( to ). Indeed by taking all the possible galaxy types into account the best fit redshift is , with a bimodal 1 confidence interval in the ranges 0.1–1.1 and 1.3–1.7 (secondary minimum). The uncertainties are estimated by evaluating the observed photometric uncertainties, that are included in the fitting procedure, and the systematic ones, induced by the inability of the spectral templates to include all the variability present in galaxy spectra. Fernández-Soto et al. (2002), using data, showed that the latter could be modelled with a normal error distribution with a variable sigma . Given our similar set-up, but the different wavelength coverage, we estimate that is an adequate assessment of the systematic error. Using this estimate and convolving the two error terms as in Fernández-Soto et al. (2002) we calculated the confidence interval mentioned above.
However, there are other pieces of information that help in solving this degeneracy. In particular, an application of the Amati relation (Amati et al., 2002) clearly prefers the redshift range , and the pseudo-redshift technique (see 3.1.2) yields a value 666Those two indicators are not independent, as the Amati relation is one of the factors taken into account in the calculation of the pseudo-redshift as described by Atteia (2003).. In addition, regarding the spectral properties, an early-type galaxy is, according to previous experience (e.g. Savaglio et al., 2009), less likely to be the host of a long GRB.
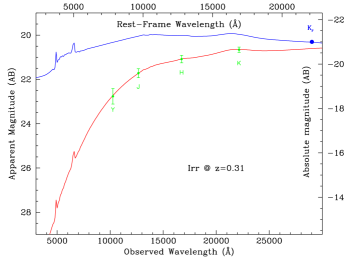
Taking all this information into account, we have adopted the best-fit as reference value for the redshift, and an irregular template as the spectral choice. With these values, we show in Fig. 7 the intrinsic and observed spectrum of such an object. As can be seen, the photometry fits the observations perfectly, and we can derive an absolute rest-frame -band magnitude , which corresponds approximately to a (Fontana et al., 2006) galaxy, and, using a simple relation (e.g. Savaglio et al., 2009), to a mass of . The derived redshift yields a luminosity distance of 1.6 Gpc (for = 71 km s-1 Mpc-1) and a total isotropic emitted energy erg (1 keV–10 MeV). However, taking the uncertainty on the photometric redshift into account the allowed intervals for the quantities cited above are for the magnitude, for the mass, and erg for .
3.4 Broad-band SED modelling of the prompt emission
3.4.1 Constructing the broad-band SED
Thanks to the rapid response to the IBAS alert of the RAPTOR telescope, Vestrand et al. (2005) were able to measure the optical emission of GRB 041219A during its prompt phase. There are three R-band data points and two upper limits that indicate that the optical emission is variable and likely correlated to the -ray one (see Fig. 3 of their paper). Blake et al. (2005) recorded the emission of GRB 041219A in three infrared bands, but just on the very final part of the prompt -ray emission. We use these visible and infrared data in conjunction to those at high energy presented in this work to build the broad-band SED of the prompt GRB emission at different times.
To do this we extracted four -ray spectra corresponding to the three time periods where the optical emission has been recorded, and to the one where the infrared data are available. In Table 3 we report the selected time intervals we used and the results of the fits. The infrared data have been de-reddened using the same parameters as in Section 3.3.1.
| Selected Time | Time since | /d.o.f | Flux density1 (filter) | |||
|---|---|---|---|---|---|---|
| Interval (UTC) | s | keV | keV | mJy | ||
| 01:45:43–01:46:56 | 211 – 284 | 1.30.1 | 251 | 175 | 50.6/56 | 2.90.8 () |
| 01:47:08–01:47:38 | 296 – 326 | 1.440.08 | 336 | 188 | 50.6/56 | 10.31.1 () |
| 01:47:51–01:49:04 | 339 – 412 | 1.790.07 | 401 | 84 | 67.0/56 | 3.80.8 () |
| 01:49:16–01:51:54 | 424 – 582 | 2.410.03 | – | – | 56.9/46 | 1.1 (); 1.70.1 (J); 2.00.1 (H); 2.60.1 () |
For the first three intervals a cut-off power law model was needed to fit the -ray data, while for the last one no cut-off could be measured, and as stated before, we may be measuring the parameter of a Band function (see Sec. 3.1.2).
3.4.2 Modelling the prompt emission of GRB 041219A
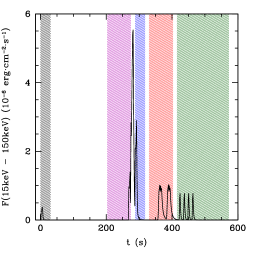
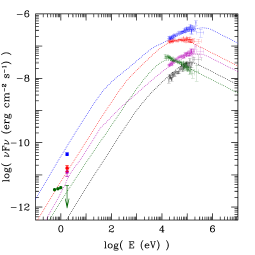
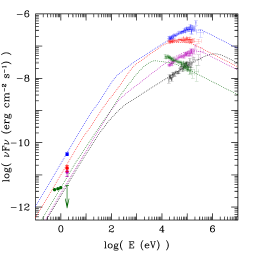
To model the SED of the prompt phase of GRB 041219A from the infrared to the -ray range we have considered the standard scenario of internal shocks (Rees & Mészáros, 1994) assuming that the observed radiation comes from the synchrotron emission of shock accelerated electrons (Piran, 1999; Bošnjak et al., 2009). In order to reproduce the complex time history of the burst we have supposed that the initial Lorentz factor distribution in the relativistic outflow is made of a succession of elementary injections. The kinetic power is not the same for all injection phases but remains constant during one given episode (see top panel of Fig. 8). The total injected kinetic energy is erg. The adopted micro-physical parameters, which are necessary to estimate typical values for the post-shock electron Lorentz factor and local magnetic field, are : , and (fraction of electrons which are accelerated). The spectrum for each individual shock is computed using the standard synchrotron prescriptions of Sari et al. (1998).
Each elementary injection episode develops its own system of internal shocks and a fraction of the dissipated energy is then radiated by the electrons resulting in a simulated gamma-ray light-curve represented in the middle panel of Fig. 8 (see Daigne & Mochkovitch, 1998, for a detailed description of the model). We do not try to get an exact fit of the observed light curve, but it can be seen in Fig. 8 that the different phases and corresponding levels of the prompt activity are correctly reproduced.
The simulated spectra for the first three time intervals are also in reasonable agreement with the observations (Fig. 8, bottom panel) while the infrared data during the final interval appear more difficult to reproduce (see Sect. 3.4.4 below). The adopted slope for the population of accelerated electrons is in order to get the correct photon spectral index in the fourth interval, assuming that it indeed represents the parameter of a Band function. In the other intervals we have no way to constrain . We have then kept the same value . The maximum of each spectrum (in ) is located at the synchrotron frequency while the evolving cooling frequency remains located between and the optical domain. This allows us to reproduce the different optical levels in the first three time intervals. Also note that the self-absorption frequency always remains well below the optical band.
3.4.3 Deceleration by the external medium
The discussion presented in the last section only takes into account internal shocks and neglects the deceleration effect by the burst circumstellar medium. This is justified as long as the typical radius of internal shocks is smaller than the deceleration radius. In the case of GRB 041219A, which had a very long duration and varied over a wide range of time scales (from less than one second to several tens of seconds), this condition implies that the burst environment must have a low density : cm-3 for a uniform medium and for a stellar wind where is the wind parameter normalized to g cm-1 which is the value expected for a standard Wolf-Rayet wind having M⊙ yr-1 and km s-1 (Chevalier & Li, 1999; Eldridge et al., 2006). These limits are quite restrictive, and, if the density is larger, the reverse shock will propagate inside the jet before the end of the prompt phase, therefore affecting the dynamics.
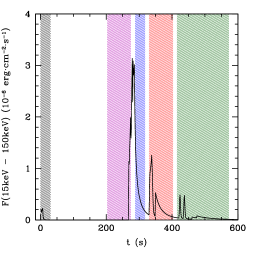
Hence we tried to model the temporal and spectral properties of GRB 041219A in the case where the deceleration effect of the external medium cannot be neglected. To follow the dynamical evolution of the ejecta we then adopt the method developed by Genet et al. (2007a). The reverse and internal shocks are now contemporaneous and their interaction modifies the observed emission: the location and intensity of the pulses in the -ray profile are changed, some are suppressed and others are created by late additional collisions in the decelerating flow. As a result, a new initial distribution of the Lorentz factor (Fig. 9, top panel) must be adopted to recover the main features of the temporal profile. The micro-physical parameters for the reverse shock are identical to those adopted for internal shocks. This assumption seems reasonable since the reverse shock, which is mildly relativistic and propagates within the ejecta, is very similar to internal shocks.
Satisfactory results for the temporal and spectral properties of GRB 041219A can then be obtained with a denser environment. Fig. 9 presents an example of a possible solution for a wind like medium with .
 |
 |
 |
 |
 |
 |
3.4.4 Infrared emission
The infrared flare detected during time interval 4 (see Table 3) cannot be easily explained by internal shocks. Its soft spectral slope (photon index ) differs from the gamma to optical average slope () and the limited data do not allow to assess its level of correlation with the high-energy emission.
We therefore checked if it could be accounted for by a contribution from the forward shock. Then, the soft spectral slope can be reproduced but getting the correct time evolution appears very challenging. The late rise of the flare imposes too low values of the Lorentz factor and/or external density and moreover the observed variability of the infrared flux following flare maximum is not expected from the forward shock (see however Fan et al., 2005).
The infrared flare may also come from a late collision in the flow but it is now not easy to get the right photon index. The observed is close to which would imply that is below the infrared domain whereas it was required to be above the optical at earlier times. Such a variation of is not expected, except if the micro-physical parameters can vary by large factors during the propagation of the outflow.
One could also try to solve the problem within a different framework, where the infrared-optical and gamma-ray components result from different radiative mechanisms. For example in the Synchro-Self Compton scenario the low-energy photons correspond to synchrotron emission from relativistic electrons while the gamma-rays result from Inverse Compton scatterings of the synchrotron photons by the same electron population. This scenario has been considered for the naked eye burst GRB 080319B (Racusin et al., 2008; Zou et al., 2009; Kumar & Panaitescu, 2008). However it has been shown that in this case most of the dissipated energy is boosted in the GeV-TeV range by a second IC scattering (leading to an energy crisis, Piran et al. (2009)). Moreover if this was the common scenario for GRBs, a second peak at high energy would then be expected for most GRBs, which has not been confirmed by Fermi observations. Another possibility has been proposed by Zheng et al. (2006). In their model the gamma-rays penetrate an electron cloud (produced in the supernova explosion prior to the GRB) and are partially converted into lower energy photons by successive Compton scatterings.
3.4.5 Precursor activity
As can be seen from Fig. 4, where the photon indices of all the spectra have been plotted versus time, there is a clear spectral evolution from hard to soft during the burst, superimposed on an intensity-hardness correlation, where the hardest spectra appear in correspondence with the peaks in the light curve. This “classical” evolution is however in contradiction with what is measured for the two precursors. If we take them into account, the hardest part of the GRB is represented by the first precursor and the softest one by the second precursor. Then the GRB becomes again very hard.
Precursors have been subject to different definitions in the past. For instance Koshut et al. (1995) define precursors as events that are dimmer than the main GRB peak and for which there is a background interval at least as long as the main event. This does not strictly apply to GRB 041219A. On the other hand, Lazzati (2005) identifies precursors as events that contain 0.1–1% of the counts with respect to the main event, and are separated by a period of quiescence without duration constraints. Our two precursors fit these requirements, since we find that they contain 1–2% and less than 1% of the total GRB flux, respectively.
Precursors of thermal origin are expected in GRBs, due to the photo-spheric emission of the fireball when it becomes transparent (e.g. Daigne & Mochkovitch, 2003), and may have been observed in the past (e.g. Murakami et al., 1991). However in our case neither the first nor the second precursor can be fitted with thermal spectra, and, in addition, the large delay between the precursors and the main emission is much longer than what is expected for thermal precursors.
Different models have been invoked to explain non-thermal precursors. Waxman & Mészáros (2003) and Ramirez-Ruiz et al. (2002) propose that they are associated with the jet breakout of the stellar envelope, but the predicted delay between the precursor and the main GRB component is again too short to be applied to GRB 041219A (Wang & Mészáros, 2007).
More generally, the ultra relativistic motion contracts so much the durations for the observer, that long delays are unreachable in all models where the same ejected material is supposed to radiate at different stages of its propagation to successively produce the precursor and the prompt emission. Therefore considering the similarity between the spectral properties of the precursors and the main emission – as also pointed out by Burlon et al. (2008, 2009) using BATSE and Swift bursts –, we are left with a scenario of intermittent central engine activity, which remains to be explained in the context of the collapsar model.
4 Conclusions
We presented a detailed spectral and temporal analysis of GRB 041219A using IBIS and SPI-ACS on board INTEGRAL. We have shown that the burst presents three spectrally distinct phases (two precursors and a main event) that are separated by two long intervals of inactivity. We have analysed the available X-ray afterglow data of GRB 041219A constraining the column density in the direction of this burst located at low Galactic latitude. We performed a near infrared observation campaign of the error region of the source, using TNG and CFHT, and identified the host galaxy of the GRB. Thanks to our multi-band photometry we modelled the host galaxy, and classified it as an under-luminous, likely irregular galaxy at redshift . Using this distance estimate we were able to build the SED of the prompt emission of GRB 041219A from the near infrared to the -rays.
Our modelling of the light curves and broad-band spectra obtained for GRB 041219A shows that the prompt optical and gamma-ray emission can be explained with a common mechanism : synchrotron radiation from shock accelerated electrons in internal shocks. However, we point out that, due to the long duration of this burst, it is highly probable that the deceleration of the outflow by the external medium will start before the end of internal shocks. Our analysis shows that a more realistic scenario taking into account this effect still agrees with the observations. The observed gamma-ray and optical flux would then be a combination from internal and reverse shock contributions. Our modelling has been performed with an adopted redshift . Similar results would be obtained for a different z in the interval 0.05–0.85 (see section 3.3.1) with a suitable adjustment of the model parameters ( and micro-physics parameters).
The late near infrared data are more puzzling. The observed variability appears incompatible with a forward shock origin. On the other hand, the measured spectral slope is difficult to reproduce by the contribution of late internal shocks or the reverse shock, except if one assumes that the micro-physics parameters in the outflow can vary significantly during propagation. Finally, the early episodes in the gamma-ray light curve are not compatible with most models of precursor activity (photospheric emission, shock breakout, etc.) due to the very long delay before the main event. This would point out to a central engine having several distinct episodes of relativistic ejection.
Acknowledgments
Based on observations with INTEGRAL, an ESA project with instruments and science data centre funded by ESA member states (especially the PI countries: Denmark, France, Germany, Italy, Switzerland, Spain), Czech Republic and Poland, and with the participation of Russia and the USA, and on observations obtained with WIRCam, a joint project of CFHT, Taiwan, Korea, Canada, France, at the Canada-France-Hawaii Telescope (CFHT) which is operated by the National Research Council (NRC) of Canada, the Institute National des Sciences de l’Univers of the Centre National de la Recherche Scientifique of France, and the University of Hawaii. ISGRI has been realized and maintained in flight by CEA-Saclay/IRFU with the support of CNES. D.G., F.D. and R.M. acknowledge the French Space Agency (CNES) for financial support. R.H. is funded by the research foundation from ”Capital Fund Management”. P.E. acknowledges financial support from the Autonomous Region of Sardinia through a research grant under the program PO Sardegna FSE 2007–2013, L.R. 7/2007 “Promoting scientific research and innovation technology in Sardinia”. A.F.S. acknowledges support from the Spanish MICYNN projects AYA2006-14056 and Consolider-Ingenio 2007-32022, and from the Generalitat Valenciana project Prometeo 2008/132, and the kind hospitality of the Observatori Astronomic de la Universitat de Valencia during the development of this work. The authors are grateful to Valentina Bianchin and Luigi Foschini for providing help in PICsIT data reduction, and to the TERAPIX team (http://terapix.iap.fr/) for providing the CHFT/WIRCam data reduction.
References
- Akerlof et al. (1999) Akerlof C. et al., 1999, Nature, 398, 400
- Amati et al. (2002) Amati L. et al., 2002, A&A, 390, 81
- Amati (2007) Amati L., 2007, MNRAS, 372, 233
- Atteia (2003) Atteia J.L., 2003, A&A, 407, L1
- Arnaud (1996) Arnaud K. A., 1996, Astronomical Society of the Pacific Conference Series, 101, 17
- Band et al. (1993) Band D. et al., 1993, ApJ, 413, 281
- Bloom et al. (2003) Bloom J. S., Frail D. A., Kulkarni S. R., 2003, ApJ, 594, 674
- Bloom et al. (1999) Bloom J. S. et al., 1999, Nature, 401, 453
- Blake et al. (2005) Blake C. H. et al., 2005, Nature, 435, 181
- Bošnjak et al. (2009) Bošnjak, Ž., Daigne F., Dubus G., 2009, A&A, 498, 677
- Briggs et al. (1999) Briggs M.S. et al., 1999, ApJ, 524, 82.
- Burlon et al. (2008) Burlon D., Ghirlanda G., Ghisellini G., Lazzati D., Nava L., Nardini M., Celotti A., 2008, ApJ, 685, L19
- Burlon et al. (2009) Burlon D., Ghirlanda G., Ghisellini G., Greiner J., Celotti A., 2009, A&A, 505, 569
- Campana et al. (2010) Campana S., Thöne C. C., de Ugarte Postigo A., Tagliaferri G., Moretti A., Covino S., 2010, MNRAS, 402, 2429
- Chevalier & Li (1999) Chevalier R. A., Li Z., 1999, ApJ, 520, L29
- Costa et al. (1997) Costa E. et al., 1997, Nature, 387, 738
- Courvoisier et al. (2003) Courvoisier T. J.-L. et al., 2003, A&A, 411, L53
- Daigne & Mochkovitch (2003) Daigne F., Mochkovitch R., 2003, MNRAS, 336, 1271
- Daigne & Mochkovitch (1998) Daigne F., Mochkovitch R., 1998, MNRAS, 296, 275
- Devillard (2001) Devillard N., 2001, ASP Conf. Ser., 238, 525
- Di Cocco et al. (2003) Di Cocco G. et al., 2003, A&A, 411, L189
- Eldridge et al. (2006) Eldridge J.J., Genet F., Daigne F., Mochkovitch R., 2006, MNRAS, 367, 186
- Fan et al. (2005) Fan Y.Z., Zhang B., Wei D.M., 2005, ApJ, 668, L25
- Fernández-Soto et al. (1999) Fernández-Soto A., Lanzetta K. M., Yahil, A., 1999, ApJ, 513, 34
- Fernández-Soto et al. (2002) Fernández-Soto A., Lanzetta K. M., Chen H.-W., Levine B., & Yahata N., 2002, MNRAS, 330, 889
- Frail et al. (1997) Frail D. A. et al., 1997, Nature, 483, L91
- Frail et al. (2001) Frail D. A. et al. 2001, ApJ, 562, L55
- Fontana et al. (2006) Fontana A. et al., 2006, A&A, 459, 745
- Gehrels et al. (2004) Gehrels N. et al., 2004, ApJ, 611, 1005
- Gehrels et al. (2009) Gehrels N., Ramirez-Ruiz E., Fox D. B., 2009, ARA&A, 47, 567
- Genet et al. (2007a) Genet F., Daigne F., Mochkovitch R., 2007a, MNRAS, 381, 732
- Genet et al. (2007b) Genet F., Daigne F., Mochkovitch R., 2007b, A&A, 471, 1
- Götz et al. (2004) Götz D., Mereghetti S., Shaw S., Beck M., Borkowski J., 2004, GRB Coordinates Network, 2866
- Götz et al. (2009) Götz D., Laurent P., Lebrun F., Daigne F., Bošnjak Ž, 2009, ApJ, 695, L208
- Güver & Özel (2009) Güver T., Özel F., 2009, MNRAS, 400, 2050
- Hill et al. (2004) Hill J. E. et al., 2004, in Flanagan K. A., Siegmund O. H. W., eds, Proc. SPIE Conf. Ser. Vol. 5165, X-ray and Gamma-ray instrumentation for Astronomy XIII. SPIE, Bellingham, p. 217
- Hascoët et al. (2010) Hascoët R. et al., 2010, in preparation
- Kalberla et al. (2005) Kalberla P. M. W., Burton W. B., Hartmann D., Arnal E. M., Bajaja E., Morras R., Pöppel W. G. L., 2005, A&A, 440, 775
- Kalemci et al. (2007) Kalemci E., Boggs S. E., Kouveliotou C., Finger M., Baring, M. G., 2007, ApJS, 169, 75
- Klebesadel et al. (1973) Klebesadel R. W., Strong I. B., Olson R. A., 1973, ApJ, 182, L85
- Koshut et al. (1995) Koshut T. M. et al. 1995, ApJ, 452, 145
- Kumar & Panaitescu (2008) Kumar P., Panaitescu A., 2008, MNRAS, 391, L19
- Lazzati (2005) Lazzati D., 2005, MNRAS, 357, 772
- Lebrun et al. (2003) Lebrun F. et al., 2003, A&A, 411, L141
- McBreen et al. (2006) McBreen S., Hanlon L., McGlynn S., McBreen B., Foley S., Preece R., von Kienlin A., Williams O. R., 2006, A&A, 455, 433
- McGlynn et al. (2007) McGlynn S. et al., 2007, A&A, 466, 895
- Mereghetti et al. (2003) Mereghetti S., Götz D., Borkowski J., Walter R., Pedersen H., 2003, A&A, 411, L291
- Mészáros & Rees (1998) Mészáros P., Rees M.J., 1999, ApJ, 306, L39
- Murakami et al. (1991) Murakami T., Inoue H., Nishimura J., van Paradijs J., Fenimore E. E., 1991, Nature, 350, 592
- Pélangeon et al. (2006) Pélangeon A. et al., 2006, AIPC, 836, 149
- Piran (1999) Piran T., 1999, Phys. Rep., 314, 575
- Piran et al. (2009) Piran T., Sari R., Zou Y., 2009, MNRAS, 393, 1107
- Ramirez-Ruiz et al. (2002) Ramirez-Ruiz E., MacFadyen A. I., Lazzati D., 2002, MNRAS, 331, 197
- Racusin et al. (2008) Racusin J.L. et al., 2008, Nature, 455, 183
- Rees & Mészáros (1994) Rees M.J., Mészáros P., 1994, ApJ, 430, L93
- Rhoads (1997) Rhoads J. E., 1997, ApJ, 487, L1
- Savaglio et al. (2009) Savaglio S., Glazebrook K., Le Borgne D., 2009, ApJ, 691, 182
- Sari et al. (1998) Sari R., Piran T., Narayan R., 1998, ApJ, 497, L17.
- Sari et al. (1999a) Sari R., Piran T., Halpern J. P., 1999a, ApJ, 519, L17
- Sari & Piran (1999b) Sari R., Piran T., 1999b, ApJ, 517, L109
- Schlegel et al. (1998) Schlegel D. J., Finkbeiner D. P., Davis M., 1998, ApJ, 500, 525
- Ubertini et al. (2003) Ubertini P. et al., 2003, A&A, 411, L131
- van Paradijs et al. (1997) van Paradijs J. et al., 1997, Nature, 386, 686
- Vedrenne et al. (2003) Vedrenne G. et al., 2003, A&A, 411, L63
- Vestrand et al. (2005) Vestrand W. T. et al., 2005, Nature, 435, 768
- Vestrand et al. (2006) Vestrand W.T. et al., 2006, Nature, 442, 172
- Vianello et al. (2009) Vianello G., Götz D., Mereghetti S., 2009, A&A, 495, 1005
- von Kienlin et al. (2003) von Kienlin A. et al. 2003, A&A, 411, L299
- Yost et al. (2007a) Yost S.A. et al., 2007a, ApJ, 657, 925
- Yost et al. (2007b) Yost S.A. et al., 2007, ApJ, 669, 1107
- Wang & Mészáros (2007) Wang X.-Y., Mészáros P., 2007, ApJ, 670, 1247
- Waxman & Mészáros (2003) Waxman E., Mészáros P., ApJ, 584, 390
- Winkler et al. (2003) Winkler C. et al., 2003, A&A, 411, L1
- Woosley et al. (1993) Woosley S. E., Langer N., Weaver T. A., 1993, ApJ, 411, 823
- Woosley & Bloom (2006) Woosley S. E., Bloom, J. S., 2006, ARA&A, 44, 507
- Zeh et al. (2006) Zeh A., Klose S., Kann D. A., 2006, ApJ, 637, 889
- Zheng et al. (2006) Zheng Z., Lu Y., Zhao Y., 2006, ApJ, 646, L25
- Zou et al. (2009) Zou Y.-C., Piran T., Sari R., 2009, ApJ, 692, L92