Suzaku Observations of Ejecta-Dominated Galactic Supernova Remnant G346.6-0.2
Abstract
We present here the results of the X-ray analysis of Galactic supernova remnant G346.6-0.2 observed with Suzaku. K-shell emission lines of Mg, Si, S, Ca and Fe are detected clearly for the first time. Strong emission lines of Si and S imply that X-ray emission nature of G346.6-0.2 is ejecta-dominated. The ejecta-dominated emission is well fitted with a combined model consisting of thermal plasma in non-equilibrium ionization and a non-thermal component, which can be regarded as synchrotron emission with a photon index of . Absorbing column density of is obtained from the best-fitting implying a high-density medium, high electron temperature of keV, and ionization timescale of indicating that this remnant may be far from full ionization equilibrium. The relative abundances from the ejecta show that the remnant originates from a Type Ia supernova explosion.
keywords:
ISM: supernova remnantsISM: individual(G346.6-0.2)X-rays: ISM1 Introduction
A supernova remnant (SNR) consists of expelled material called “ejecta” from the explosion and a swept-up interstellar matter. The X-ray emission results from the interactions of ejecta and swept-up matter. From the X-ray emission of SNRs we may obtain valuable information about the physical properties of the ejecta, swept-up plasma, elemental abundances and the history of the explosion. Shock wave may be the blast wave associated with the stellar explosion and/or the reverse shock wave, which propagates inwards from the decelerated blast wave and raises the temperature of the stellar ejecta. The young SNRs are bright in X-rays and dominated by the emission from ejecta. Thus they provide fruitful information about the elements synthesized by the supernova (SN) explosions. Therefore, the observation of the young SNRs is the best method to investigate the abundances of the elements synthesized by the SNe (see e.g. SN1006 (Koyama et al., 1995), RCW86 (Bamba, Koyama & Tomida, 2000), Tycho (Warren et al., 2005) for the best studied ejecta-dominated SNRs in the X-ray band).
G346.6-0.2 (, ) is a shell-type SNR located in the Galactic plane. It was discovered by Clark, Caswell & Green (1975) in radio band having an angular size of 8 arcmin (, 1996). In X-ray band, on the other hand, G346.6-0.2 was first observed by ASCA during its Galactic plane survey (Yamauchi et al., 2008). It is shown that the size of the X-ray emission from G346.6-0.2 is less extended than its reported radio structure. Five OH(1720 MHz) masers were detected toward this SNR and they are all located along the southern edge of the remnant (Koralesky et al., 1998).
We are studying the X-ray emissions from the ejecta-dominated SNRs. For this purpose we have chosen several small size Galactic SNRs, one of which is G346.6-0.2. Detailed properties of G346.6-0.2 remained unknown so far because of very limited photon statistics in the ASCA (AGPS) data. Suzaku is the most recent X-ray astronomical satellite (see Mitsuda et al. (2007)) having a large collecting area and low background. Therefore, it is the best instrument for observing dim and diffuse sources. We propose here to study G346.6-0.2 to understand the origin of its thermal and non-thermal X-ray emission which will help us to distinguish its SN explosion type. By using the archival data of Suzaku, we were able to produce higher quality image and the spectra of the remnant, which lead to the results in this study.
In Section 2, we describe the observation log and the data reduction methods. We present the image analysis in Section 2.1 and the spectral analysis in Section 2.2. We discuss our results and the origin of the thermal and non-thermal emission in Section 3.
2 Observation and Data Reduction
Suzaku satellite has two sets of instruments, one being the four X-ray imaging spectrometers (XISs, see Koyama et al. (2007)); each of four are at the focus of an X-ray telescope (XRTs, see Serlemitsos et al. (2007)) and also a separate hard X-ray detector (HXD, see Takahashi et al. (2007); Kokubun et al. (2007)). XIS’s have two different type of CCDs: one being three front illuminated CCDs (namely, FI, XIS0, XIS2 and XIS3) and other is a back illuminated CCD (namely, BI, XIS1). Each CCD covers an area of 17.817.8 arcmin2.
The data used in this analysis is taken by the XIS onboard Suzaku. G346.6-0.2 was observed on 2009 October 07 for 56.7 ks (Obs ID:504096010). During the observation, the XIS were operated in the normal full-frame clocking mode with the editing mode of and , which are low and medium data rates, high and super-high data rates, respectively.
For the data reduction and spectral analysis, we used the headas software package of version 6.5 and xspec version 11.3.2 (see Arnaud (1996)). The response matrix files (RMF) and ancillary response files (ARF) were made using xisrmfgen and xissimarfgen version 2006-10-17 (see Ishisaki et al. (2007)).
2.1 Image Analysis
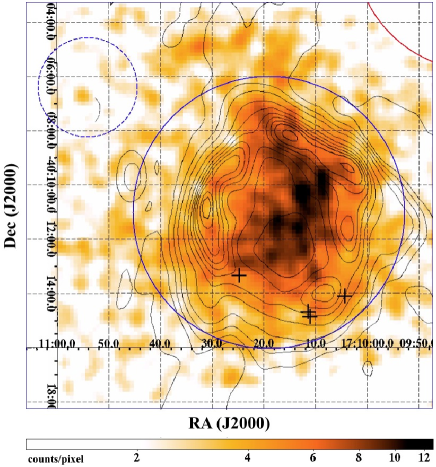
Figure 1 shows the XIS0 image of G346.6-0.2 in the keV energy band. The solid circle (radius 5 arcmin) from the centre) shows the region where the spectra is extracted. The background region is shown by dotted circle (, , radius 1.8 arcmin). We excluded the upper right corner of the detectors containing the onboard masked out 55Fe calibration sources. For comparison radio continuum image of G346.6-0.2 at 843 MHz by (1996) is overlaid on the figure, where four maser sources are also pointed out as has been reported by Koralesky et al. (1998).
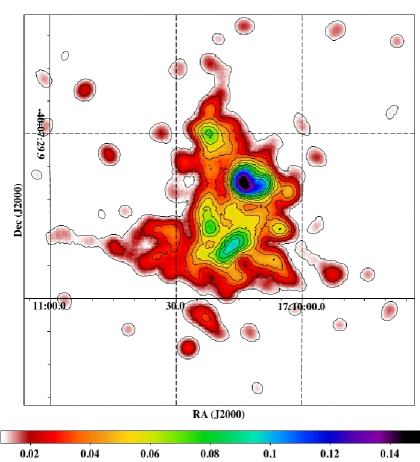
The bright image in XIS0 is clearly seen and we have obtained the Si-S map in keV energy band (Figure 2) to see if this emission is from interstellar medium (ISM) or from the ejecta. In Fig. 2, Si-S emission is distributed throughout the remnant and it is bright, which may well indicate that the X-ray emission coming from the remnant is ejecta dominated rather than originating from the ISM.
2.2 Spectral Analysis
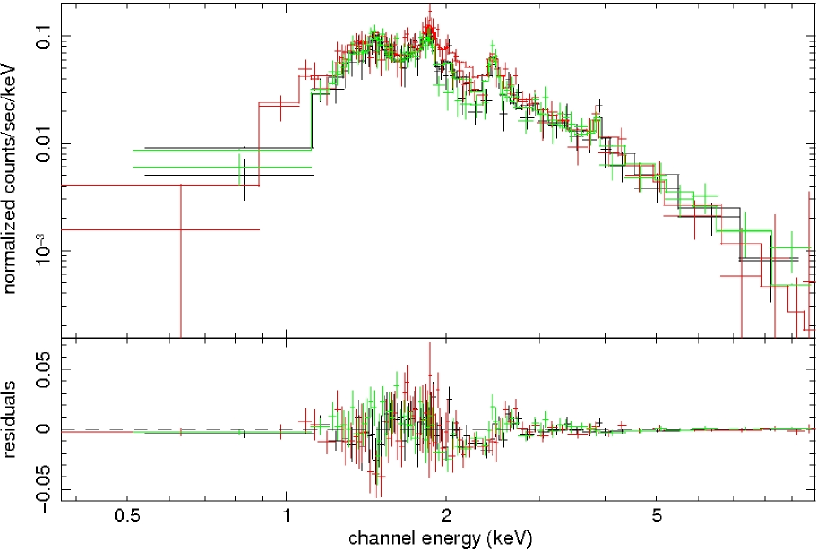
The extracted XIS spectra from a circular region of G346.6-0.2 (see Fig. 1) are analyzed in the full energy band of keV. Figure 3 shows representative spectra of XIS0, XIS1 and XIS3 simultaneously, extracted from the region (shown in Fig. 1 by the solid circle) with its corresponding best-fitting model and residuals.
The strong Si and S lines from the spectra and Si-S image (see Fig. 2) in keV energy band suggest that the emission is ejecta dominated. Therefore, we have applied one-component models in our spectral fits. We first fitted the data with an absorbed (wabs; Morrison & McCammon (1983)) VNEI, which is a model for a non-equilibrium ionization (NEI) collisional plasma with variable abundances (Borkowski, Lyerly & Reynolds, 2001). The model did not fit well (reduced of 1.12 (637/567 d.o.f.)). So, we added a power-law model (non-thermal synchrotron emission from relativistic electrons). The parameters of the absorbing column density (); electron temperature (); the ionization parameter () and the metal abundances C, N, O, Ne, Mg, Si, S, Ar, Ca, and Fe are set free in this fit resulting in an unacceptable error value. Then, we set Mg, S, Si, Ca, and Fe free, since their emission lines are clearly seen in the spectra, while the rest are set to solar values (Anders & Grevesse, 1989) resulting in a reasonably good reduced value of 1.07 (606/565 d.o.f.) with reasonable error limits. Similar steps were also applied to VMEKAL model, which describes an emission spectrum from hot ionized gas in collisional ionization equilibrium with variable abundances (Mewe, Gronenschild & van den Oord, 1985; Mewe, Lemen & van den Oord, 1986; Liedahl, Osterheld & Goldstein, 1995), and VPSHOCK model, which is suitable for modelling plane-parallel shocks in young SNRs, where plasma has not reached the ionization equilibrium (Borkowski, Lyerly & Reynolds, 2001). These two models gave us reduced value of 1.22 (691/568 d.o.f.) and 1.11 (629/567 d.o.f.), respectively. Then we added a power-law component to both models, which yielded almost similar results (of reduced d.o.f. value of 607/566 and 605/565, respectively, of the best-fitting parameters and errors values) as VNEI model as given in Table 1.
These three models basically represent the emission from optically thin thermal plasma with slight differences. For example, VNEI is a NEI model similar to VPSHOCK, except with a single ionization timescale.
From an absorbed VNEI and power-law model, the absorbing column density, the electron temperature, the ionization parameter, the metal abundances of Mg, Si, S, Ca, Fe, volume emission measure (VEM) and flux () of the VNEI component and the photon index () and norm of power-law component are obtained and given in Table 1, with the corresponding error values with 90 per cent confidence levels. Total flux and reduced d.o.f. value of VNEI and power-law components are also given in this table. The results of VMEKAL and power-law, VPSHOCK and power-law models are also presented in Table 1 for comparison.
To determined the line centre energy of the K-shell () lines, we fitted the spectra using a simple bremsstrahlung continuum plus five Gaussian lines with an absorbing column. The obtained best-fitting central energies of emission lines are He-like Mg (1.38 keV), Si (1.86 keV), S (2.52 keV), Ca (3.25 keV) and Fe (6.77 keV).
3 Discussion and Conclusions
In this work, we provide for the first time a high-quality image, spectra, and detailed description of the X-ray emission of G346.6-0.2 using a set of public archival Suzaku data. The radio emission of this remnant extends to 8 arcmin (, 1996), while X-ray image shows a smaller extension (see Fig. 1), which is consistent with that of the results shown in Yamauchi et al. (2008).
We fitted the spectra with “thermal” component in non-equilibrium ionization and an additional “non-thermal” power-law component with reasonably good chi-square values.
Thermal emission. The thermal part of the spectra can be represented by non-equilibrium ionization (VNEI) model. The thermal X-ray emission of young SNRs, whose emission is still dominated by the ejecta, is predominantly from the ejecta heated by the reverse shock. Since the ejecta is metal abundant, its X-ray spectra usually shows strong emission lines of heavy elements such as O, Ne, Mg, Si, S, Ar, Ca and Fe. emission lines of Mg, Si, S, Ca and Fe for G346.6-0.2 are detected clearly for the first time in this work.
The interstellar absorbing column density is obtained to be () , which is consistent with the galactic value of () in that direction (Dickey & Lockman, 1990). results of G346.6-0.2 reported a value of (Yamauchi et al., 2008), indicating that X-ray spectra of the remnant is heavily absorbed by interstellar matter, perhaps due to its location being close to the Galactic plane. In other words, the electron density () of medium of the remnant is high enough. This may also be supported by the fact that the south region of the remnant is in interaction with four molecular clouds as has been noted by Koralesky et al. (1998).
Being close to the Galactic plane and being in a highly dense region, one can expect that some portions of the remnant can be highly asymmetrical. The asymmetry in the south region of the remnant may well be due to the interaction with the maser sources as has been noted in Fig. 1. One can argue that the surface brightness of the remnant is far from the equal distribution and spherical symmetry due to the inhomogeneity of the medium.
The thermal emission further provides us information about the electron temperature and age of the plasma. Our best-fitting temperature is obtained to be 1.2 keV, which is typical for shell-like SNRs. This value is also consistent with the result of 1.6 keV obtained from ASCA observations (Yamauchi et al., 2008).
The age of G346.6-0.2 has not been predicted so far. Especially, young SNRs whose ages are a few hundred or about a thousand years are not only bright but also dominated by the emission from ejecta. Being an ejecta-dominant remnant and bright in X-rays G346.6-0.2 can be a young SNR. Plasma in most of young SNRs are in the NEI condition. The ionization age (or ionization parameter) is defined as =, which is often used as a key diagnostic of the NEI state. is typically required to be s (, 1984) for full ionization equilibrium. In our observations we obtained to be (2.92) s, which may also indicate that this SNR is far from full ionization equilibrium. So, the plasma has not yet had time to reach ionization equilibrium, and it is still being ionized. We calculated to be 0.82 from VEM= where and V is the X-ray-emitting volume of the remnant (estimated to be ) by adopting an average distances of d kpc (average of a near value of 5.5 kpc and a far value of 11 kpc given by Koralesky et al. (1998)) and assuming the emitting volume to be spherical shell. From the equation t=/, the age of G346.6-0.2 calculated to be yr. Thus, this remnant is likely to be the oldest known ejecta-dominated shell-like SNR (e.g. SN1006, RCW86, G337.2-0.7 and G309.2-0.6, 1000 yr (Yamaguchi et al., 2008a), 1800 yr (Yamaguchi et al., 2008b), 2000-4500 yr and 700-4000 yr (Rakowski, Hughes & Slane, 2001), respectively.)
Non-thermal emission. Recently, in some SNRs (e.g. first SN1006 (Koyama et al., 1995) and then RX J1713.7.3946 (Koyama et al., 1997; Slane et al., 1999), Cas A (Vink et al., 2000; Hughes et al., 2000), and Tycho’s SNR (Hwang et al., 2002)) non-thermal emission has been detected. There are two possible mechanisms for non-thermal emission: one is synchrotron emission and the another is non-thermal bremsstrahlung. The non-thermal emission coming from G346.6-0.2 is most likely a synchrotron emission (power-law component with photon index of ). The real source of synchrotron emission in SNRs is believed to be the acceleration of the ultrarelativistic electrons in the magnetic fields with the help of the shock waves. A powerful X-ray point source inside the remnant or in the vicinity of the remnant can also contribute to the non-thermal emission. The photon index we obtained ( ) is lower (harder) than those of typical shell-like SNRs. This forces us to presume that a pulsar wind nebula (PWN) contribution is also possible, although a PWN has not been discovered so far in or in the vicinity of G346.6-0.2.
The flux value of G346.6-0.2 is obtained to be erg for keV range, which is in a good agrement with that of found with (Yamauchi et al., 2008). Using this flux value for the source and also taking its X-ray angular size of 5 arcmin, its surface brightness in the keV energy range is found to be erg , which is higher than many shell-like Galactic SNRs. Surface brightness mainly depends on the explosion energy and the density of the medium, but a PWN may also contribute to the surface brightness of the SNR. In this case, high medium density and small size of the remnant may be the main reason of high X-ray surface brightness of G346.6-0.2.
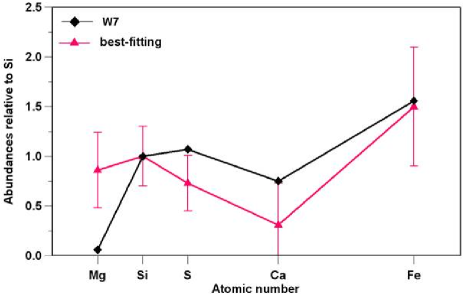
Relative abundances in the ejecta. Theoretical models predict that in core collapse SN explosion low-Z elements like O, Ne, Mg are produced (Thielemann, Nomoto & Hashimoto, 1996), while in Type Ia SNe (Nomoto et al., 1997) high-Z elements like Ar, Ca and Fe are mostly produced. Furthermore, Fe production in Type Ia SNe is far larger than that of core-collapse SNe (Nomoto et al., 1997; Iwamoto et al., 1999). The detection of Fe emission lines from the remnants is important to identify the type of the remnant. has detected Fe lines in especially Type Ia SNRs (e.g. Tycho, SN1006, RCW86).
When we compare our best-fitting abundances of Mg, S, Ca and Fe relative to Si with the predicted theoretical values, Mg relative to Si is higher, while S and Ca relative to Si are lower. The reason for the lower abundances of S and Ca could be because the elements are concentrated at the inner layers of the remnant and hence are not heated enough by the reverse shock yet. This information implies that this SNR is at its early evolution phase. Our best-fitting abundance Fe relative to Si is consistent with the expected value (see Fig. 4) within the confidence range. However, considering the large error bars due to low statistics, we could also comment a similar statement for Fe abundance value and an unattained reverse shock, as it is reported in many Type Ia SNRs like SN1006 (Yamaguchi et al., 2008a), Tycho (Tamagawa et al., 2009) and G337.2-0.7 (Rakowski, Hughes & Slane, 2001) the Fe abundance is being less than expected value produced in a Type Ia SNe. Considering all these cases we can predict that the remnant may be originated from a Type Ia SN explosion.
Acknowledgments
A.S. is supported by TÜBİTAK PostDoctoral Fellowship. This work is supported by the Akdeniz University Scientific Research Project Management and by TÜBİTAK under project codes 108T226 and 109T092. The authors also acknowledge the support by Boğaziçi University Research Foundation under 2010-Scientific Research Project Support (BAP) project no:5052.
References
- Anders & Grevesse (1989) Anders E., Grevesse N., 1989, Geochimica Cosmochimica Acta, 53, 197
- Arnaud (1996) Arnaud K. A., 1996, in Jacoby G., Barnes J., eds, ASP Conf. Ser. Vol.101, Astronomical Data Analysis Software and Systems V. Astron.Soc. Pac., San Francisco, p. 17
- Bamba, Koyama & Tomida (2000) Bamba A., Koyama K., Tomida H., 2000, PASJ, 52, 1157
- Borkowski, Lyerly & Reynolds (2001) Borkowski K. J., Lyerly W. J., Reynolds S. P., 2001, ApJ, 548, 820
- Clark, Caswell & Green (1975) Clark D. H., Caswell J. L., Green A. J., 1975, Australian Journal of Physics, Astrophysical Supplement, 37, 1
- Dickey & Lockman (1990) Dickey J.M., Lockman F. J., 1990, ARA&A, 28, 215
- Hughes et al. (2000) Hughes J. P., Rakowski C. E., Burrows D. N., Slane P. O., 2000, ApJ, 528, L109
- Hwang et al. (2002) Hwang U., Decourchelle A., Holt S. S., Petre R., 2002, ApJ, 581, 1101
- Ishisaki et al. (2007) Ishisaki Y. et al., 2007, PASJ, 595, 113
- Iwamoto et al. (1999) Iwamoto K., Brachwitz F., Nomoto K., Kishimoto N., Umeda H., Hix W. R., Thielemann F.-K., 1999, ApJS, 125, 439
- Kokubun et al. (2007) Kokubun M. et al., 2007, PASJ, 59, 53
- Koralesky et al. (1998) Koralesky B., Frail D. A., Goss W. M., Claussen M. J., Green A. J., 1998, AJ, 116, 1323
- Koyama et al. (1995) Koyama K., Petre R., Gotthelf E. V., Hwang U., Matsuura M., Ozaki M., Holt S. S., 1995, Nat, 378, 255
- Koyama et al. (1997) Koyama K., Kinugasa K., Matsuzaki K., Nishiuchi M., Sugizaki M., Torii K., Yamauchi S., Aschenbach B., 1997, PASJ, 49, L7
- Koyama et al. (2007) Koyama K. et al., 2007, PASJ, 59, 23
- Liedahl, Osterheld & Goldstein (1995) Liedahl D. A., Osterheld A. L., Goldstein W. H., 1995, ApJ, 438, L115
- (17) Masai K., 1984, Ap&SS, 98, 367
- Mewe, Gronenschild & van den Oord (1985) Mewe R., Gronenschild E. H. B. M., van den Oord G. H. J., 1985, A&AS, 62, 197
- Mewe, Lemen & van den Oord (1986) Mewe R., Lemen J. R., van den Oord G. H. J., 1986, A&AS, 65, 511
- Mitsuda et al. (2007) Mitsuda K. et al., 2007, PASJ, 59, 1
- Morrison & McCammon (1983) Morrison R., McCammon D., 1983, ApJ, 270, 119
- Nomoto et al. (1997) Nomoto K., Iwamoto K., Nakasato N., Thielemann F.-K., Brachwitz F., Tsujimoto T., Kubo Y., Kishimoto N., 1997, Nuclear Physics A, 621, 467
- Rakowski, Hughes & Slane (2001) Rakowski C. E., Hughes J. P., Slane P., 2001, ApJ, 548, 258
- Serlemitsos et al. (2007) Serlemitsos P. J. et al., 2007, PASJ, 59, 9
- Slane et al. (1999) Slane P., Gaensler B. M., Dame T. M., Hughes J.P., Plucinsky P. P., Green A., 1999, ApJ, 525, 357
- Takahashi et al. (2007) Takahashi T. et al., 2007, PASJ, 59, 35
- Tamagawa et al. (2009) Tamagawa T. et al., 2009, PASJ, 61, 167
- Thielemann, Nomoto & Hashimoto (1996) Thielemann F-K., Nomoto K., Hashimoto M., 1996, ApJ, 460, 408
- Vink et al. (2000) Vink J., Kaastra J. S., Bleeker J. A. M., Bloemen, H., 2000, Advances in Space Research, 25, 689
- Warren et al. (2005) Warren J.S. et al., 2005, ApJ, 634, 376
- (31) Whiteoak J.B.Z., Green A.J., 1996, A&AS, 118, 329
- Yamaguchi et al. (2008a) Yamaguchi H. et al., 2008a, PASJ, 60, 141
- Yamaguchi et al. (2008b) Yamaguchi H., Koyama K., Nakajima H., Bamba A., Yamazaki R., Vink J., Kawachi A., 2008b, PASJ, 60, 123.
- Yamauchi et al. (2008) Yamauchi S., Ueno M., Koyama K., Bamba A., 2008, PASJ, 60, 1143
| Parameters | VNEI+power-law | VMEKAL+power-law | VPSHOCK+power-law |
|---|---|---|---|
| ( | 2.1 | 2.0 | 2.1 |
| (keV) | 1.22 | 0.97 | 1.3 |
| () | 2.92 | - | (6.92)111The VPSHOCK fitting gives an upper limit on the ionization timescale. |
| Mg | 0.51 | 0.65 | 0.76 |
| Si | 0.47 | 0.44 | 0.56 |
| S | 0.7 | 0.7 | 0.8 |
| Ca | 2.3 | 3.4 | 2.3 |
| Fe | 0.6 | 0.4 | 0.6 |
| VEM222Volume emission measure (VEM=dV in the unit of , where and are number densities of electrons and protons, respectively and V is the X-ray-emitting volume. | 11.6 | 15.1 | 10.4 |
| Flux333Flux in the keV band in the unit of erg . | 3.1 | 2.9 | 3.2 |
| Photon Index | 0.6 | 0.5 | 0.6 |
| norm(photons ) | 4.55 | 4.55 | |
| Flux444Total flux in the keV band in the unit of erg . | 4.4 | 4.5 | 4.4 |
| /d.o.f. | 606/565=1.07 | 607/566=1.07 | 605/565=1.07 |