Can a Bose gas be saturated?
Abstract
Bose–Einstein condensation is unique among phase transitions between different states of matter in the sense that it occurs even in the absence of interactions between particles. In Einstein’s textbook picture of an ideal gas, purely statistical arguments set an upper bound on the number of particles occupying the excited states of the system, and condensation is driven by this saturation of the quantum vapour Einstein:1925a . Dilute ultracold atomic gases are celebrated as a realisation of Bose–Einstein condensation in close to its purely statistical form Anderson:1995 ; Davis:1995c ; brad97bec ; Pethick:2002 ; Pitaevskii:2003 . Here we scrutinise this point of view using an ultracold gas of potassium (39K) atoms, in which the strength of interactions can be tuned via a Feshbach scattering resonance Roati:2007 ; Chin:2010 . We first show that under typical experimental conditions a partially condensed atomic gas strongly deviates from the textbook concept of a saturated vapour. We then use measurements at a range of interaction strengths and temperatures to extrapolate to the non-interacting limit, and prove that in this limit the behaviour of a Bose gas is consistent with the saturation picture. Finally, we provide evidence for the universality of our observations through additional measurements with a different atomic species, 87Rb. Our results suggest a new way of characterising condensation phenomena in different physical systems.
Einstein’s prediction of a purely statistical phase transition follows directly from the Bose distribution for an ideal (non-interacting) gas of identical particles huan87 ; Pethick:2002 ; Pitaevskii:2003 . At a given temperature , there is an upper bound on the number of bosons in the excited states of the system. For the experimentally relevant case of a 3D harmonically trapped gas such that is large compared to the trapping frequencies along each axis (), the saturation of the gas is given by Bagnato:1987
| (1) |
where is the geometric mean of the ’s and is the Riemann function []. Increasing the total number of particles above the critical value results in the macroscopic occupation of the ground state, i.e. Bose–Einstein condensation.
The condensation observed in weakly interacting atomic Bose gases is generally believed to provide a faithful illustration of the statistical phase transition proposed by Einstein. At the same time, differences from ideal gas condensation are also observed ensh96 ; Gerbier:2004 ; Gerbier:2004c ; Meppelink:2010 , for example in the small deviations of the measured critical atom number from the ideal gas prediction ensh96 ; Gerbier:2004 . Here we focus on the concept of saturation as the underlying mechanism driving the transition. One might expect that the saturation inequality (1) is essentially satisfied in these systems, with just the value of the bound on the right-hand side slightly modified. We prove that this is far from being the case, and show how to reconcile experimental findings with the prediction (1). The crucial step in our work is a proper disentanglement of the subtle role of interactions in condensation. While it is correct that Einstein’s statistical argument does not explicitly invoke interactions between the particles, it does assume that the gas is in thermal equilibrium, which is fundamentally impossible to attain in a completely non-interacting system photongas . We overcome this problem by making measurements at a range of interaction strengths, always sufficient to ensure thermal equilibrium, and then extrapolating our results to the non-interacting limit.
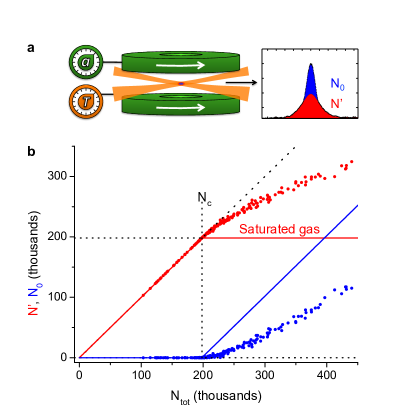
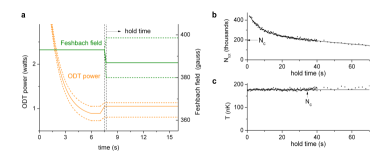
We perform conceptually simple experiments in which we keep the temperature of the gas constant and vary the atom number. Our experimental scheme is outlined in Fig. 1a (see also Supplementary Information). We start with a partially condensed gas of 39K atoms in the lower hyperfine ground state, produced in a crossed optical dipole trap Campbell:2010 . The optical potential near the bottom of the trap is close to harmonic, with varying between 60 Hz and 80 Hz for data taken at different temperatures. We tune the strength of repulsive interactions in the gas, characterised by the positive s-wave scattering length , by applying a uniform external magnetic field in the vicinity of a Feshbach scattering resonance centred at 402.5 gauss Zaccanti:2009 . We always prepare the condensed gas at , where is the Bohr radius, and then adjust the scattering length to the desired value by changing the applied magnetic field. In a given experimental series, the temperature is kept constant by fixing the depth of our optical trap, and the atom number is varied by holding the gas in the trap for a variable time up to several tens of seconds. During this time the total atom number slowly decays due to three-body recombination, scattering of photons from the trapping laser beams and collisions with the background gas in the vacuum chamber, while elastic collisions among the trapped atoms ensure equilibrium redistribution of particles between the condensate and the thermal gas.
An example of an experimental series, taken at and nK, is shown in Fig. 1b. For each hold time between 1 and 110 seconds we extract the number of atoms in the condensate, , and in the thermal gas, , from a bimodal fit to the density distribution of the gas after 18 ms of free time-of-flight expansion from the optical trap. We plot and versus the total number of atoms, , which is extracted independently by a direct summation over the density distribution. We find that the relationship is satisfied for all data points to within 0.5%. The standard deviation of the temperature for all the points where the condensate is present is 3 nK (see Supplementary Information).
The predictions for the number of condensed and thermal atoms in a saturated gas are shown in Fig. 1b by the blue and red solid lines, respectively. Specifically, for , the thermal atom number remains constant and equal to . The deviation of the experimental data from this prediction is striking. As the total number of atoms is increased from the measured critical value, , to , only half of the additional atoms accumulate in the condensate.
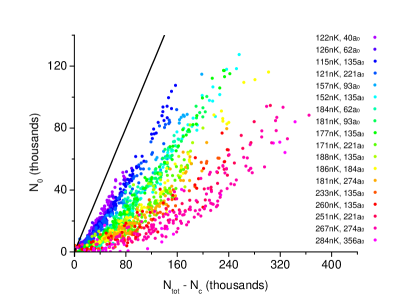
In Fig. 2 we show the results of 18 experimental series taken at a wide range of scattering lengths, , and temperatures, 115 nK 284 nK. Here we focus on the regime , where the condensate is present, and plot versus . The solid line shows the prediction for a fully saturated thermal gas, . The deviation of the data from this prediction is clearly observable in all the series, and grows with both and .
To explore the relationship between the non-saturation of our Bose gases and the interatomic interactions, we start by identifying the relevant interaction energy. Due to the large ratio between the average densities of the condensed and thermal fractions, the non-ideal behaviour of the thermal component primarily results from its interaction with the condensate. The relevant energy scale is then provided by Dalfovo:1999 :
| (2) |
where is the spatial extension of the ground state of the harmonic oscillator of frequency , and is the atomic mass. The energy is the mean-field prediction for the chemical potential of a gas with atoms at zero temperature and in the Thomas-Fermi limit Dalfovo:1999 . One can understand its scaling with in the following way: For a harmonically trapped condensate the potential energy per particle scales as , where is the characteristic size of the cloud, and the mean-field interaction energy per particle is proportional to the density, . Minimising the sum of these two energies we get and .
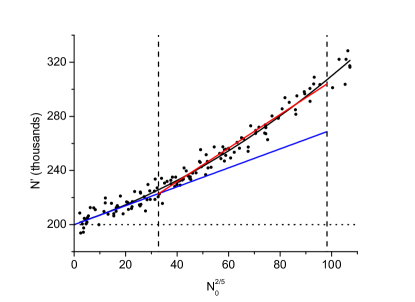
Guided by this scaling, in Fig. 3 we plot the thermal atom number as a function of , for the same experimental series as shown in Fig. 1b. From here we proceed in two steps: First, we show that the initial linear increase of with can be quantitatively accounted for by the mean-field Hartree-Fock (HF) theory for a harmonically trapped gas. Second, for the regime of larger condensates, where the theory does not fully reproduce the experimental data, we adopt a more heuristic approach that still allows us to prove the concept of a saturated gas in the non-interacting limit.
In the HF approach one treats the thermal fraction as an ideal gas, but takes into account repulsive interactions with the condensate. Within this theory Giorgini:1997b ; Dalfovo:1999 one gets , and can predict a linear variation of with the small parameter :
| (3) |
with (see Supplementary Information). The origin of this non-saturation can be qualitatively understood by noting that interactions with the condensate modify the effective potential seen by the thermal atoms from a parabola into a “Mexican hat” shape; this allows the thermal component to occupy a larger volume, which grows with increasing sengstock .
From Eqs. (2) and (3) we define the non-saturation slope , where is a dimensionless parameter of the form , with . The blue line in Fig. 3 corresponds to this prediction, with the intercept fixed by the measured . It agrees with the data very well for small condensates, with , corresponding to .
To quantitatively test the prediction of Eq. (3) we took several series at different scattering lengths () and temperatures ( nK), specifically focusing on very small values of . We turn off interactions during time-of-flight, so that the small condensates almost do not expand and can be reliably detected and characterised in absorption imaging. For each series we fit the initial non-saturation slope, for , and compare the result with the prediction . As shown in Fig. 4, the experiment and theory agree within a few percent.
The agreement of experiments with Eq. (3) for small is the first main quantitative result of this paper, and allows us to deduce that the initial non-saturation slope would indeed vanish in the non-interacting limit, where for any . This however does not complete our experimental proof since this theory works very well only for small condensed fractions (see Fig. 3). For the larger, and experimentally more typical values of , we observe an even more pronounced lack of saturation of the thermal gas.
To quantitatively study non-saturation effects at larger we take the following heuristic approach: Although the observed increase of with is not perfectly linear, over a broad experimentally relevant range it can be well quantified by a coarse-grained slope , as indicated in Fig. 3 by the red solid line. In order to treat all the data taken at various values of and equally, for each experimental series we consider the same range of values of , from 0.1 to 0.3. Note that this range covers more than an order of magnitude of values, and encompasses the bulk of the data shown in Fig. 2.
In Fig. 4 we summarise the non-saturation slopes for the same 18 experimental series shown in Fig. 2. Within experimental error all data points fall onto a straight line when plotted against the dimensionless , supporting the assumption that we can still use as the relevant interaction parameter. To further validate our approach, we took additional data with a different atomic species, 87Rb in the state. In this case is not tuneable, and the two experimental series were taken at temperatures of 175 nK and 203 nK. These two points are in close agreement with the 39K data.
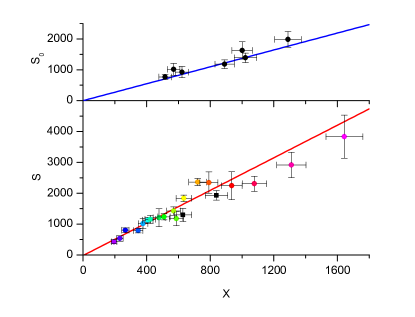
The prediction (1) for an ideal gas () corresponds to at the origin of the graph in Fig. 4. The mathematical limit is reached in two physically very different limits, and . In the mundane limit inevitably vanishes for any value of , so trivially . It is therefore essential that our experiments show that depends only on the parameter , allowing us to deduce its value in the limit for any fixed . The solid line in Fig. 4 shows the result of an unconstrained linear fit to the data, which gives an intercept consistent with zero, . Together with the success of HF theory in the small regime, this confirms the concept of a saturated Bose gas for a broad range of experimentally relevant parameters.
We expect our results to be generic to experiments on harmonically trapped 3D Bose gases with (relatively weak) short-range s-wave interactions. However a number of important questions remain open. Here we studied only the global properties of the gas, inferred from the number of atoms in condensed and thermal components; in the future it would be of great interest to also study saturation at the level of local densities of the two components, and effectively measure the equation of state for a bulk system Ho:2010a . Local saturation should depend only on the interactions between particles, but could for example be different in systems with very strong or long-range interactions, where the emergence of a roton minimum significantly increases the density of states for low energy excitations. Global saturation additionally depends on the external potential, and from purely geometric arguments we expect the non-saturation effects to grow with the dimensionality of the system. In this respect it would be particularly interesting to study them for atomic gases in disordered potentials Sanchez-Palencia:2010 , where the possible fractal nature of the fluid shape can lead to a non-integer effective dimensionality.
In conclusion, our work shows that the purely statistical picture of a saturated Bose gas is not realised in experiments with harmonically trapped atomic vapours. However, extrapolation of our results to the strictly non-interacting limit allows us to confirm the textbook picture of Bose-Einstein condensation as a purely statistical phase transition in an ideal gas. Ultracold atomic gases offer great experimental flexibility for further studies of (non-)saturation effects, which may provide a fruitful way of classifying different geometries and interactions in many-body systems. Better understanding, and ultimately control of these effects could also be of practical importance. Maximising the purity of the condensate for a given attainable temperature and atom number is indeed crucial for minimising the decoherence processes in atom interferometry and quantum information processing.
Methods Summary
The bimodal fit function used to determine , and is the sum of the Thomas-Fermi profile for the condensate and the dilogarithm function for the thermal component, with the chemical potential set to zero in the argument of Ketterle:1999b ; Gerbier:2004c . The fit to the whole distribution is improved by: (1) refitting by excluding the central region of the image occupied by the condensate, (2) refitting with fixed parameters of the function, and (3) fitting the temperature to the high energy wings of the distribution by excluding the central region of the cloud corresponding to one thermal radius . Small effects of varying the exclusion region between and are included in the error bars.
Within a given series, measurements with different hold times are taken in random order. We sometimes observe small () temperature drifts as a function of or the time through the series. We analytically correct for these drifts using the temperature scaling given by the Hartree-Fock theory. This amounts to plotting versus , where is assigned to each data point and is the nominal temperature for a series, obtained in the limit.
References
- (1) Einstein, A. Quantentheorie des einatomigen idealen gases. ii. Sitzungsberichte/Physikalische Klasse, Preussische Akademie der Wissenschaften 1, 3 (1925).
- (2) Anderson, M. H., Ensher, J. R., Matthews, M. R., Wieman, C. E. & Cornell, E. A. Observation of Bose-Einstein condensation in a dilute atomic vapor. Science 269, 198 (1995).
- (3) Davis, K. B. et al. Bose–Einstein condensation in a gas of sodium atoms. Phys. Rev. Lett. 75, 3969 (1995).
- (4) Bradley, C. C., Sackett, C. A. & Hulet, R. G. Bose–Einstein condensation of lithium: Observation of limited condensate number. Phys. Rev. Lett. 78, 985 (1997).
- (5) Pethick, C. & Smith, H. Bose–Einstein Condensation in Dilute Gases (Cambridge University Press, 2002).
- (6) Pitaevskii, L. & Stringari, S. Bose–Einstein Condensation (Oxford University Press, Oxford, 2003).
- (7) Roati, G. et al. 39K Bose–Einstein condensate with tunable interactions. Phys. Rev. Lett. 99, 010403 (2007).
- (8) Chin, C., Grimm, R., Julienne, P. & Tiesinga, E. Feshbach resonances in ultracold gases. Rev. Mod. Phys. 82, 1225–1286 (2010).
- (9) Huang, K. Statistical Mechanics (Wiley, New York, 1987).
- (10) Bagnato, V., Pritchard, D. E. & Kleppner, D. Bose–Einstein condensation in an external potential. Phys. Rev. A 35, 4354 (1987).
- (11) Ensher, J. R., Jin, D. S., Matthews, M. R., Wieman, C. E. & Cornell, E. A. Bose–Einstein condensation in a dilute gas: Measurement of energy and ground-state occupation. Phys. Rev. Lett. 77, 4984–4987 (1996).
- (12) Gerbier, F. et al. Critical temperature of a trapped, weakly interacting Bose gas. Phys. Rev. Lett. 92, 030405 (2004).
- (13) Gerbier, F. et al. Experimental study of the thermodynamics of an interacting trapped Bose–Einstein condensed gas. Phys. Rev. A 70, 013607 (2004).
- (14) Meppelink, R., Rozendaal, R. A., Koller, S. B., Vogels, J. M. & van der Straten, P. Thermodynamics of Bose–Einstein-condensed clouds using phase-contrast imaging. Phys. Rev. A 81, 053632 (2010).
- (15) In the recently observed Bose–Einstein condensation of a photon gas Klaers:2010 , there is no direct interaction between the light particles. However the interaction with the material environment, which ensures thermalisation, leads to a second-order interaction between the photons. This results in a non-saturation of the thermal gas visible in Fig. 2 of Klaers:2010 .
- (16) Klaers, J., Schmitt, J., Vewinger, F. & Weitz, M. Bose–Einstein condensation of photons in an optical microcavity. Nature 468, 545–548 (2010).
- (17) Campbell, R. L. D. et al. Efficient production of large 39K Bose–Einstein condensates. Phys. Rev. A 82, 063611 (2010).
- (18) Zaccanti, M. et al. Observation of an Efimov spectrum in an atomic system. Nature Physics 5, 586–591 (2009).
- (19) Dalfovo, F., Giorgini, S., Pitaevskii, L. P. & Stringari, S. Theory of Bose–Einstein condensation in trapped gases. Rev. Mod. Phys. 71, 463–512 (1999).
- (20) Giorgini, S., Pitaevskii, L. P. & Stringari, S. Thermodynamics of a trapped Bose-condensed gas. J. Low Temp. Phys. 109, 309 (1997).
- (21) In Ref. Erhard:2004 condensation was studied in a spinor gas, where atoms were gradually transferred from condensed spin components into an initially unpopulated one. The thermal atoms thus experienced a potential modified by interactions with the already existing condensates, which probably obscured the differential non-saturation effects due to the newly emerging condensate.
- (22) Erhard, M., Schmaljohann, H., Kronjäger, J., Bongs, K. & Sengstock, K. Bose–Einstein condensation at constant temperature. Phys. Rev. A 70, 031602 (2004).
- (23) Ho, T.-L. & Zhou, Q. Obtaining the phase diagram and thermodynamic quantities of bulk systems from the densities of trapped gases. Nature Physics 6, 131–134 (2010).
- (24) Sanchez-Palencia, L. & Lewenstein, M. Disordered quantum gases under control. Nature Physics 6, 22–30 (2010).
- (25) Ketterle, W., Durfee, D. S. & Stamper-Kurn, D. M. Bose–Einstein condensation in atomic gases. Proceedings of the International School of Physics Enrico Fermi, Course CXL (IOS Press, Amsterdam, 1999).
*These two authors contributed equally.
Acknowledgements We thank P. Krüger and D. Hutchinson for useful discussions, and N. Cooper, F. Gerbier, M. Köhl and C. Salomon for helpful comments on the manuscript. This work was support by EPSRC (Grants No. EP/G026823/1 and No. EP/I010580/1). R. P. S. acknowledges support from the Newton Trust. J. D. acknowledges hospitality of the Cavendish Lab and a Visiting Fellowship at Trinity College, Cambridge.
Author Information Correspondence and request for materials should be addressed to Z. H. (zh10001@cam.ac.uk).
Supplementary Information
Experimental Procedure
Hartree-Fock Theory
The simplest theoretical framework to address the effects of atomic interactions in a Bose-condensed gas is the Hartree-Fock approximation Dalfovo:1999SI . In this model one treats the thermal atoms as a “non-interacting” gas of density confined in the self-consistent mean-field potential , where and is the condensate density. Two further approximations take advantage of the small density of the thermal component: (i) One neglects the influence of the thermal atoms on the condensate spatial distribution, which is then given by where is defined in Eq. (2) of the main paper. This is valid as long as (i.e. to for our parameters). (ii) One neglects the mean-field energy of the thermal atoms, so that the confining potential for these atoms is simply a 3D “Mexican hat” potential given by
| (4) |
The latter approximation amounts to neglecting the shift of the critical temperature due to interactions.
The number of thermal atoms in the presence of a condensate with atoms can now be estimated using the semi-classical version of the Bose–Einstein distribution:
| (5) |
The result at first order in reads (Dalfovo:1999SI , Eqs. (120) and (122)):
| (6) |
where , and is the ideal-gas result for the condensation temperature of a Bose gas with atoms. Using , we can recast the above equation into
| (7) |
References
- (1)
- (2) Dalfovo, F., Giorgini, S., Pitaevskii, L. P. & Stringari, S. Rev. Mod. Phys. 71, 463–512 (1999).