Observational evidence for a metal rich atmosphere on the super-Earth GJ1214b
Abstract
We report observations of two consecutive transits of the warm super-Earth exoplanet GJ 1214b at 3.6 and 4.5 µm with the Infrared Array Camera instrument on-board the Spitzer Space Telescope. The two transit light curves allow for the determination of the transit parameters for this system. We find these paremeters to be consistent with the previously determined values and no evidence for transit timing variations. The main investigation consists of measuring the transit depths in each bandpass to constrain the planet’s transmission spectrum. Fixing the system scale and impact parameters, we measure and at 3.6 and 4.5 µm, respectively. Combining these data with the previously reported MEarth Observatory measurements in the red optical allows us to rule-out a cloud-free, solar composition (i.e., hydrogen-dominated) atmosphere at confidence. This independently confirms a recent finding that was based on a measurement of the planet’s transmission spectrum using the VLT. The Spitzer, MEarth, and VLT observations together yield a remarkably flat transmission spectrum over the large wavelength domain spanned by the data. Consequently, cloud-free atmospheric models require more than 30% metals (assumed to be in the form of H2O) by volume to be consistent with all the observations.
1 Introduction
GJ 1214b is a transiting super-Earth exoplanet orbiting a nearby M4.5V star every 1.6 days (Charbonneau et al., 2009) that was discovered by the MEarth Observatory (Nutzman & Charbonneau, 2008; Irwin et al., 2009). The first data for this planet suggested that it has a mass of and a radius of , and subsequent follow-up transit light curve observations and analysis have confirmed the initial radius estimate (Berta et al., 2010; Carter et al., 2010; Kundurthy et al., 2010). Due to degeneracies between possible interior and atmospheric masses and compositions, a diverse range of models can reproduce GJ 1214b’s mass and radius (Rogers & Seager, 2010b; Nettelmann et al., 2010). This problem had been previously identified for planets in the super-Earth regime (Seager et al., 2007; Adams et al., 2008; Rogers & Seager, 2010a). Nevertheless, GJ 1214b is larger than expected for its mass assuming a purely solid composition and mature age; this implies that GJ 1214b most probably possesses a significant gas envelope. An important question then is, what are the characteristics of this atmosphere?
The transiting nature of GJ 1214b fortunately provides the opportunity to study its atmosphere in transmission (e.g. Charbonneau et al. 2002). In particular, the overall composition of the planet’s atmosphere (e.g., hydrogen-dominated or metal-rich) can be investigated using transmission spectroscopy observations through the determination of the atmospheric scale height (Miller-Ricci et al., 2009; Miller-Ricci & Fortney, 2010). Because the depth of strong absorption features in the transmission spectrum is proportional to the atmospheric scale height, such observations constrain the mean molecular weight of the atmosphere, and thus its bulk composition. Obtaining constraints on the composition of GJ 1214b’s atmosphere can give clues to the planet’s origins and interior structure (Rogers & Seager, 2010b; Nettelmann et al., 2010).
In this Letter, we present transit observations of GJ 1214b obtained with Spitzer that yield measurements of the planet’s transmission spectrum. Recently, Bean et al. (2010) also presented a transmission spectrum for the planet in the red optical from VLT observations. We use our Spitzer data along with the VLT and MEarth data to determine the composition of GJ 1214b’s atmosphere, and we discuss the results in the context of the possible interior structure models and origins for the planet.
2 Warm-Spitzer Observations
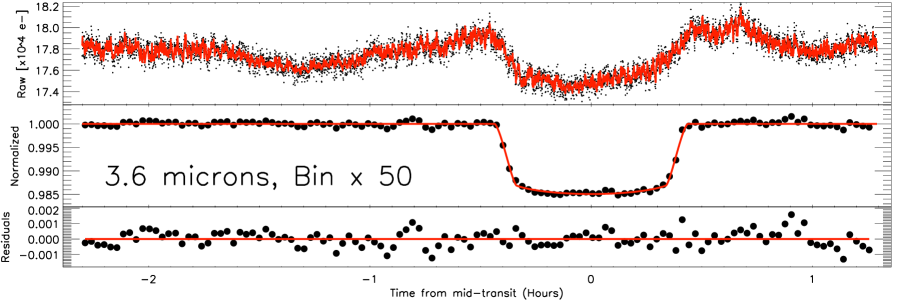
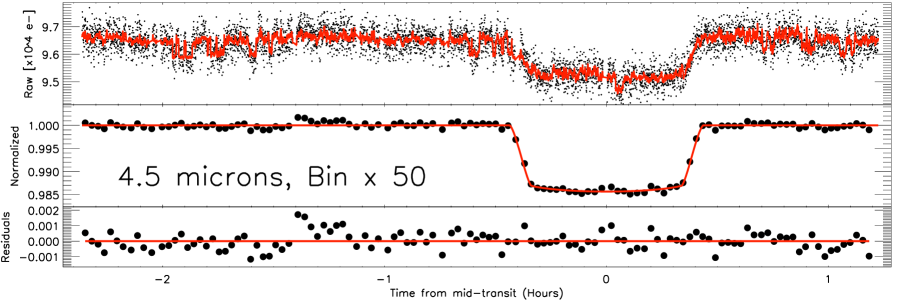
GJ 1214b was observed for approximately 4.5 h during each of two consecutive transits with Warm-Spitzer/IRAC (Werner et al., 2004; Fazio et al., 2004) at 3.6 and 4.5 µm (program ID 542). The observations occurred on 26 and 27 April 2010, with the first transit observed at 3.6 µm. Observations in each visit were gathered in sub-array mode ( pixels) with an exposure time of 1.9 s per frame, which resulted in a 2.0 s cadence. These yielded 109 images per visit, with 64 frames per image and a total of 6976 frames. Nearly one-fourth of these exposures were taken during the 53 min planetary transit.
The method we used to produce photometric time series in each channel from the Basic Calibrated Data (BCD) is described in Désert et al. (2011). It consists of finding the centroid position of the stellar point spread function (PSF) and performing aperture photometry. The aperture size was optimized to minimize the final residuals in each channel, although we noticed that the does not vary significantly with the aperture radii. The final aperture sizes were set to and pixels at 3.6 and 4.5 µm, respectively. The background level for each frame was determined by fitting a Gaussian to the central region of a histogram of counts from the full array. We find that the background varies within the sets of 64 frames, but that it remains globally constant between images and for the whole time-series. The s exposures gave a typical signal-to-noise ratio () of and per individual frame at 3.6 and 4.5 µm, respectively. The noise is and larger than photon noise at 3.6 and 4.5 µm, respectively. We used a sliding median filter to select and trim outliers greater than , which correspond to of the data. We also discarded the first half-hour of observations, which are affected by a significant telescope jitter before stabilization. The final number of photometric measurements used are and for the light curves gathered at 3.6 and , respectively. The two final raw time series are presented in Figure 1.
3 Determination of the transit parameters
3.1 Analysis of the Warm-Spitzer light curves
We used a transit light curve model multiplied by instrumental decorrelation functions to measure the transit parameters and their uncertainties from the Spitzer data as described in Désert et al. (2011). We computed the transit light curves with the IDL transit routine OCCULTQUAD from Mandel & Agol (2002), which depends on five parameters: the planet-to-star radius ratio , the orbital semi-major axis to stellar radius ratio (system scale) , the impact parameter , the time of mid transit , and a linear limb-darkening coefficient . In the case of late M-dwarfs, such as GJ 1214, the limb-darkening is uncertain because it strongly depends upon stellar physical parameters that are not known accurately. Consequently, we opted to determine the limb-darkening coefficients for our light curve modeling from the data themselves. We assumed that the limb-darkening is well-approximated by a linear law (Claret, 1998) at infrared wavelengths.
The Spitzer/IRAC photometry is known to be systematically affected by the so-called pixel-phase effect (see e.g., Charbonneau et al. 2005). This effect is seen as oscillations in the measured fluxes with a period of approximately 70 min (period of the telescope pointing jitter) and an amplitude of approximately peak-to-peak. We found the centroid position of the PSF with GCNTRD, from the IDL Astronomy Library 111http://idlastro.gsfc.nasa.gov/homepage.html. We decorrelated our signal in each channel using a linear function of time for the baseline (two parameters) and a quadratic function of the PSF position (four parameters) to correct the data for each channel as described in Désert et al. (2011).
We performed a simultaneous Levenberg-Marquardt least-squares fit (Markwardt, 2009) to the data to determine the transit and instrumental parameters (11 in total). The errors on each photometric point were assumed to be identical, and were set to the of the residuals of the initial best-fit obtained. To obtain an estimate of the correlated and systematic errors (Pont et al., 2006) in our measurements, we use the residual permutation bootstrap, or “Prayer Bead”, method as described in Désert et al. (2009). In this method, the residuals of the initial fit are shifted systematically and sequentially by one frame, and then added to the transit light curve model before fitting again. We allow asymmetric error bars spanning of the points above and below the median of the distributions to derive the uncertainties for each parameters.
3.2 Results
We performed two separate analysis of the Spitzer data, and the results are given in Table 1. For the first analysis, we fit the data without any constraints and allowed all the transit parameters to be unique for each of the two Spitzer channels. Our values for all the parameters are in agreement with the previously reported results from extensive follow-up observations of GJ 1214b (Berta et al., 2010; Carter et al., 2010; Kundurthy et al., 2010; Sada et al., 2010) and the adopted parameters used to determine the optical transmission spectrum by Bean et al. (2010). Furthermore, the mid-transit times from the Spitzer observations are precisely measured with an accuracy of s and do not deviate significantly from the revised linear ephemeris of Berta et al. (2010). This strongly suggests that the transiting parameters we derive are robust and well constrained at this point.
The agreement between all the available data sets justifies a second analysis of the Spitzer data, where we fixed the and values to those used by Bean et al. (2010) to measure the optical transmission spectrum while still determining unique for each channel and collapsing along the dominant degeneracies between these parameters. We also reanalyzed the MEarth data for five transits presented by Berta et al. (2010) with these parameters fixed. This enables us to combine the Spitzer photometry with the VLT spectrum and the MEarth photometry to constrain GJ 1214b’s transmission spectrum.
Adopting identical and , the MEarth data yield , and the average radius ratio value in the VLT spectrum is with a typical uncertainty of 0.0006. For the Spitzer data, we find and at 3.6 and 4.5 µm, respectively (see Table 1). As described by Bean et al. (2010), the VLT spectrum is featureless, and we find that the transit depths derived from the Spitzer, MEarth and VLT measurements are also all in agreement within level. The linear limb-darkening coefficients we derived for each bandpass are consistent with expected theoretical values (Claret, 2000; Sing, 2010).
The period of the telescope jitter leading to the pixel-phase effect has the same timescale of the transit duration ( hour). Therefore, stronger degeneracies exist between the transit depths, the linear limb-darkening coefficients, and the corrections of the intra-pixel sensitivity than is observed in transit data for planets with longer transit durations (e.g. Désert et al. 2009). This leads to somewhat larger error bars than had been expected, although fixing the limb-darkening coefficients only reduces the the error bars on the transit depths by .
Stellar variability can be responsible for time and wavelength dependent transit depth variations (Désert et al., 2011). Since the sets of observations we aim to compare have been secured at different epochs, it is critical to ensure that GJ 1214’s variability does not affect the measured radius ratios. Berta et al. (2010) analyzed three years of photometric monitoring in various bandpasses and found the stellar rotation period of GJ 1214 to be days, and the photometric variability in the red optical to be 1%. This suggests that the transit depths vary by less than and (in absolute) in the MEarth and Spitzer bandpasses, respectively, which is below the amplitude errors of the radius ratios. This is also further supported by multiple transit observations of this object in various bandpasses cited above. Consequently, the comparison between the transit depth derived from observations secured at different epoch can be done with no corrections.
4 Discussion
4.1 The nature of GJ1214b’s atmosphere
As already mentioned in Sect. 3.2, the wavelength dependent measurements of secured by Spitzer, MEarth, and VLT are all in agreement within the level. In principle, the lack of features in the wavelength dependent planet radius can be interpreted as no evidence for the presence of a planetary atmosphere seen in transmission. This means that either this planet has no atmosphere or its depth variations are below our level of sensitivity. However, our current knowledge of the planetary mass and radius rules out the absence of an atmospheric envelope since it is required by interior structure models of GJ 1214b (Rogers & Seager, 2010b; Nettelmann et al., 2010). Therefore, we assume that GJ 1214b possesses a gas envelope in the rest of this paper.
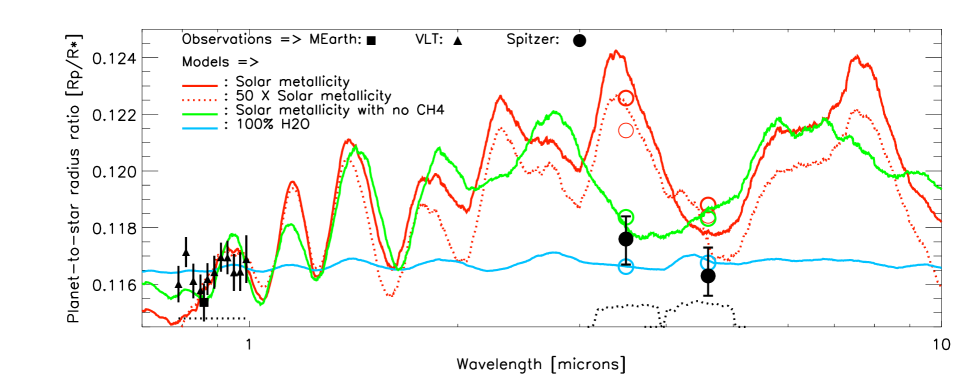
Figure 2 shows the Spitzer, MEarth, and VLT measurements compared to cloud free transmission spectroscopy models for GJ 1214b with various gas compositions calculated by Miller-Ricci & Fortney (2010). The atmospheric models solve for the wavelength-dependent deposition of flux, as a function of depth, and make no assumption regarding albedo. We assume heat redistribution over the full planet, which results in an equilibrium temperature of 555 K. None of these models include cloud formation since abundant condensates are not expected to form at the temperatures expected for the planet’s atmosphere. We consider two main types of atmospheric models. The first type includes hydrogen-dominated atmospheres with metallicities ranging from solar to 50 times solar, and also a solar composition model with methane artificially removed. The later is considered because methane molecules are susceptible to photolysis since they have large photo-dissociation cross sections in the UV. Furthermore, methane does not re-form very quickly through chemical reactions at the temperatures that are expected for the upper atmosphere of GJ 1214b. The second type of models considered are mixtures of molecular hydrogen and water (in the form of vapor) ranging from 10 to 100% water by volume. All the spectral models were computed at high resolution and were flux weighted integrated over the bandpasses of the measurements to enable calculation of the goodness of fit. We apply a scaling factor to the models to give the best fit to the measurements.
As a first test, we compare the models to only the MEarth and the Spitzer data. We find that these data on their own exclude hydrogen-dominated atmosphere models with solar metallicity at confidence level. This is due to a strong broad band methane absorption feature at 3.6 µm which disappears in the methane-free model as seen in Figure 2. This is consistent with the findings of Bean et al. (2010) using only the VLT spectrum. The hydrogen-dominated atmospheres would have a large scale height and lead to large spectral variations that are not observed in the data. The difference between the radius ratios measured in the two Spitzer bandpasses, limits the range of possible atmospheres because of the methane feature. Of the cloud-free hydrogen-dominated atmospheres, only those without methane are consistent with the combined Spitzer and MEarth data.
The combination of MEarth, VLT, and Spitzer observations provides stronger constraints on the models, in particular thanks to the spectral information from the VLT data. The combined data set rules out the model with solar metallicity at confidence level and models with up to 50 times enhanced metallicity at . This is due to the sensitivity of the data from the VLT bandpass to spectral features of water, which has been noted previously by Bean et al. (2010). Including the VLT data also enable us to rule out the methane-free model at confidence.
The flat transmission spectrum of the combined data set suggests that the scale height must be small for cloud-free atmospheres to produce spectral features with an amplitude lower than . An atmosphere dominated by chemical elements heavier than hydrogen and helium is therefore required. Although we cannot discriminate between heavy elements, water in its vapor state is expected to be a dominant species in various model scenarios (Rogers & Seager, 2010b; Nettelmann et al., 2010). The MEarth, VLT, and Spitzer observations together are consistent within with atmospheric models containing more than of water by volume. Models with more than of water are consistent within .
An alternative explanation for the featureless transmission spectrum of GJ 1214b indicated by the MEarth, VLT, and Spitzer data could be the presence of high altitude clouds or hazes. A high altitude cloud deck would reduce the amplitudes of the expected spectral features because the stellar light would be transmitted through a smaller atmospheric layer than in the case of a cloud-free atmosphere. The proposed temperature-pressure profiles of the Miller-Ricci & Fortney (2010) models do not cross the condensation curves of known equilibrium species that are expected to be abundant (Fortney, 2005). Furthermore, clouds and hazes particles have wavelength dependent opacities which seem at odd with the remarkably flat transmission spectrum observed. However, more theoretical work is needed since, for example, a distribution of particle sizes or photochemical processes, although unconstrained at this point, could modify the transmission signature of this atmosphere. Hydrocarbon haze formed through photochemical processes and methane depletion by similar processes remain possibilities to explain the broad band observations. Consequently, we only consider the simple case of a cloud and haze-free atmosphere at chemical equilibrium in the following section.
4.2 The atmosphere as a diagnostic of the planet’s origins and interior
Rogers & Seager (2010b) propose three major distinct possible origins for the gas layer concomitant with interior structure models for GJ 1214b: accretion from the primordial protoplanetary nebulae, sublimation of ices, or outgassing of rocky material. Our observations exclude the primordial atmosphere scenario (with possible exceptions such as a hazy methane-free atmosphere) because this would yield a hydrogen-dominated composition. Atmospheres arising from sublimation or outgassing are consistent with the data.
If sublimation of ices is the atmospheric origin scenario, it would suggest that the planet has a high concentration of water in its interior. This implies that the planet formed beyond the snow line of its host star’s protoplanetary disk, and that it migrated inward to its current orbital position. After the planet migrated closer to its star, the ice forming the bulk sublimated and led to a metal-dominated atmosphere as it is currently observed. There are two possible scenarios to explain the hydrogen-poor envelope in this case. Either the planet never attained a mass sufficient to accrete or retain large amounts of primordial gas (H-rich) from the protoplanetary disk (Rafikov, 2006), or the mass fractions of light elements have been diminished through atmospheric escape. Rogers & Seager (2010b) point out that an atmosphere with a small scale height, such as suggested by our observations, is more robust against atmospheric escape than a hydrogen-rich envelop, and that the cumulative loss of mass from a water-dominated atmosphere would not significantly affect the overall character of the planet. Interestingly, Nettelmann et al. (2010) show that a water-rich planet that completely lacks hydrogen in the atmosphere requires an implausibly large water-to-rock ratio. Instead, H/He/H2O envelopes with water mass fractions between approximately 50 and 85% are favored. This picture is in agreement with the MEarth, VLT, and Spitzer observations, which suggest a water mass fraction in the atmosphere of more than .
The alternative scenario for the origin of GJ 1214b’s atmosphere would require a giant terrestrial-like planet that experienced dissolution of icy planetesimals into the envelope (e.g. Pollack et al. 1996), or outgassing during formation and evolution or a period of tectonic activity (Schaefer & Fegley, 2007; Elkins-Tanton & Seager, 2008; Schaefer & Fegley, 2009; Kite et al., 2009). Rogers & Seager (2010b) discussed this scenario in the context of an atmosphere composed of purely hydrogen on the grounds that heavy elements like water or carbon dioxide can not be out-gassed in sufficient quantity to form an atmosphere that can account for GJ 1214b’s large size on their own. However, they did not consider the possibility of a hybrid atmosphere with significant amounts of both hydrogen and heavy elements. While heavy elements alone can not be out-gassed in sufficient quantities, Elkins-Tanton & Seager (2008) have shown that significant amounts of water can be out-gassed from chondritic planetesimals. Given this, and that Nettelmann et al. (2010) have indicated a mixed H/He/H2O envelope can successfully be used to model the planet, a hybrid composition atmosphere from outgassing seems to be a plausible scenario.
| Wavelength | Tc (BJDBTD) aaTimes are given as Barycentric Julian Dates in the Barycentric Dynamical Time system (Eastman et al., 2010). | O-C (Sec.) bbObserved minus Calculated (O-C) using the ephemeris from (Berta et al., 2010) with Period (days)= and T0 (BJDBDT)=. | ||||
|---|---|---|---|---|---|---|
| 3.6 µm | ||||||
| 4.5 µm | ||||||
| 3.6 µm | fixed to 0.27729 | fixed to 14.9749 | ||||
| 4.5 µm | fixed to 0.27729 | fixed to 14.9749 |
References
- Adams et al. (2008) Adams, E. R., Seager, S., & Elkins-Tanton, L. 2008, ApJ, 673, 1160
- Baraffe et al. (1998) Baraffe, I., Chabrier, G., Allard, F., & Hauschildt, P. H. 1998, A&A, 337, 403
- Bean et al. (2010) Bean, J. L., Kempton, E. M.-R. & Homeier, D. 2010, Nature, 468, 669-672
- Berta et al. (2010) Berta, Z. K., Charbonneau, D., Bean, J., Irwin, J., Burke, C. J., Désert, J.-M., Nutzman, P., & Falco, E. E. 2010, arXiv:1012.0518, ApJ, submitted
- Carter et al. (2010) Carter, J. A., Winn, J. N., Holman, M. J., Fabrycky, D., Berta, Z. K., Burke, C. J., & Nutzman, P. 2010, arXiv:1012.0376, ApJ, submitted
- Claret (1998) Claret, A. 1998, A&A, 335, 647
- Claret (2000) Claret, A. 2000, A&A, 363, 1081
- Charbonneau et al. (2002) Charbonneau, D., Brown, T. M., Noyes, R. W., & Gilliland, R. L. 2002, ApJ, 568, 377
- Charbonneau et al. (2005) Charbonneau, D., et al. 2005, ApJ, 626, 523
- Charbonneau et al. (2009) Charbonneau, D., et al. 2009, Nature, 462, 891
- Désert et al. (2011) Désert, J.-M., et al. 2011, A&A, 526, A12
- Désert et al. (2009) Désert, J.-M., Lecavelier des Etangs, A., Hébrard, G., Sing, D. K., Ehrenreich, D., Ferlet, R., & Vidal-Madjar, A. 2009, ApJ, 699, 478
- Eastman et al. (2010) Eastman, J., Siverd, R., & Gaudi, B. S. 2010, PASP, 122, 935
- Elkins-Tanton & Seager (2008) Elkins-Tanton, L. T., & Seager, S. 2008, ApJ, 685, 1237
- Fortney (2005) Fortney, J. J. 2005, MNRAS, 364, 649
- Fazio et al. (2004) Fazio, G. G., et al. 2004, ApJS, 154, 10
- Kundurthy et al. (2010) Kundurthy, P., Agol, E., Becker, A. C., Barnes, R., Williams, B., & Mukadam, A. 2010, arXiv:1012.1180, ApJ, submitted
- Irwin et al. (2009) Irwin, J., Charbonneau, D., Nutzman, P., & Falco, E. 2009, IAU Symposium, 253, 37
- Kite et al. (2009) Kite, E. S., Manga, M., & Gaidos, E. 2009, ApJ, 700, 1732
- Mandel & Agol (2002) Mandel, K., & Agol, E. 2002, ApJ, 580, L171
- Markwardt (2009) Markwardt, C. B. 2009, Astronomical Society of the Pacific Conference Series, 411, 251
- Miller-Ricci et al. (2009) Miller-Ricci, E., Seager, S., & Sasselov, D. 2009, ApJ, 690, 1056
- Miller-Ricci & Fortney (2010) Miller-Ricci, E., & Fortney, J. J. 2010, ApJ, 716, L74
- Nettelmann et al. (2010) Nettelmann, N., Fortney, J. J., Kramm, U., & Redmer, R. 2010, arXiv:1010.0277, ApJ, submitted
- Nutzman & Charbonneau (2008) Nutzman, P., & Charbonneau, D. 2008, PASP, 120, 317
- Pollack et al. (1996) Pollack, J. B., Hubickyj, O., Bodenheimer, P., Lissauer, J. J., Podolak, M., & Greenzweig, Y. 1996, Icarus, 124, 62
- Pont et al. (2006) Pont, F., Zucker, S., & Queloz, D. 2006, MNRAS, 373, 231
- Rafikov (2006) Rafikov, R. R. 2006, ApJ, 648, 666
- Rogers & Seager (2010a) Rogers, L. A., & Seager, S. 2010a, ApJ, 712, 974
- Rogers & Seager (2010b) Rogers, L. A., & Seager, S. 2010b, ApJ, 716, 1208
- Sada et al. (2010) Sada, P. V., et al. 2010, ApJ, 720, L215
- Schaefer & Fegley (2009) Schaefer, L., & Fegley, B. 2009, ApJ, 703, L113
- Schaefer & Fegley (2007) Schaefer, L., & Fegley, B. 2007, Icarus, 186, 462
- Seager et al. (2007) Seager, S., Kuchner, M., Hier-Majumder, C. A., & Militzer, B. 2007, ApJ, 669, 1279
- Sing (2010) Sing, D. K. 2010, A&A, 510, 21
- Werner et al. (2004) Werner, M. W., et al. 2004, ApJS, 154, 1