IFUM-974-FT
Edinburgh 2011/11
FR-PHENO-2011-005
TTK-11-07
Precision determination of
using an unbiased global
NLO parton set
The NNPDF Collaboration:
Simone Lionetti1, Richard D. Ball3, Valerio Bertone4, Francesco Cerutti5,
Luigi Del Debbio3, Stefano Forte1,2, Alberto Guffanti4, José I. Latorre5,
Juan Rojo1,2 and Maria Ubiali6.
1 Dipartimento di Fisica, Università di Milano and
2 INFN, Sezione di Milano,
Via Celoria 16, I-20133 Milano, Italy
3 Tait Institute, University of Edinburgh,
JCMB, KB, Mayfield Rd, Edinburgh EH9 3JZ, Scotland
4 Physikalisches Institut, Albert-Ludwigs-Universität Freiburg,
Hermann-Herder-Straße 3, D-79104 Freiburg i. B., Germany
5 Departament d’Estructura i Constituents de la Matèria,
Universitat de Barcelona,
Diagonal 647, E-08028 Barcelona, Spain
6 Institut für Theoretische Teilchenphysik und Kosmologie, RWTH Aachen University,
D-52056 Aachen, Germany
Abstract:
We determine the strong coupling from a next-to-leading order analysis of processes used for the NNPDF2.1 parton determination, which includes data from neutral and charged current deep-inelastic scattering, Drell-Yan and inclusive jet production. We find , where the uncertainty includes all statistical and systematic experimental uncertainties, but not purely theoretical uncertainties, which are expected to be rather larger. We study the dependence of the results on the dataset, by providing further determinations based respectively on deep-inelastic data only, and on HERA data only. The deep-inelastic fit gives the consistent result , but the result of the HERA–only fit is only marginally consistent. We provide evidence that individual data subsets can have runaway directions due to poorly determined PDFs, thus suggesting that a global dataset is necessary for a reliable determination.
A precise knowledge of the value of the strong coupling constant [1] is necessary for accurate collider phenomenology, such as for instance Higgs searches at the Tevatron and the LHC [2]. In particular, in the gluon fusion channel the value of strong coupling is one of the dominant sources of uncertainty [3]. The current PDG [4] value
| (1) |
is taken from Ref. [1], where it is obtained by combining several determinations, including some from processes (such as the decay rate and the total hadrons cross section) which do not require knowledge of nucleon structure, but others (such as deep-inelastic scattering) which do. The value of the uncertainty Eq. (1) may seem overly optimistic in view of the spread of values of available determinations and the significant dependence on the perturbative order of some of them: as a consequence, the use of a somewhat more conservative estimate of the uncertainty, such as at 68% confidence level has been recommended [3, 2] for LHC phenomenology.
The determination of from the same wide of set of data which is used to determine PDFs is appealing because it simultaneously exploits the dependence on the coupling of scaling violations as well as that on individual hard matrix elements of the various processes under consideration. It is thus potentially quite accurate. On the other hand, in such a determination the value of is necessarily correlated to the best-fit form of the PDFs, and thus subject to potential sources of bias, such as for example an insufficiently flexible PDF parametrization.
An example of the possible pitfalls of a simultaneous determination of PDFs and is highlighted by the analysis of Ref. [7], in which the extraction of from BCDMS and NMC deep-inelastic scattering data was performed using a methodology (scaling violations of truncated moments) which avoids completely the use of parton distributions. The result found, , had rather different central value and uncertainties than those obtained by direct analysis of the same BCDMS ( [8]) and NMC ( [9]) data by the respective collaborations. This suggests that the latter results, obtained using a PDF parametrization, were biased by it.
Here we wish to provide a determination of exploiting the NNPDF methodology for determining PDFs [10, 11, 12, 13, 17], which strives to avoid parametrization bias through the use of a Monte Carlo approach combined with neural networks as underlying unbiased interpolating functions. Specifically, we use the latest NNPDF set, NNPDF2.1 [18], which is based on a NLO global fit to all relevant hard scattering data, with heavy quark mass effects included through the so-called FONLL method [19]. NNPDF parton sets have been provided for a variety of values of . Here we will use these sets to study the quality of the global agreement between theory and the data used in the PDF determination as the value of is varied. A similar approach was used in Ref. [13] to provide a determination of the CKM matrix element which turned out to be more accurate than any determination obtained from a single experiment.
The use of NNPDF2.1 parton distributions has not only the advantage that parametrization bias is reduced to a minimum, but also that the same methodology can be used to analyze different datasets, without having to retune the fitting procedure (such as, for instance, the form of parton parametrization) according to the size of the dataset. This enables a direct comparison of values of obtained from different subsets of data which enter the global fit, and also an analysis of the correlation between individual datasets, individual PDFs, and the value of . As a consequence, we will be able to address the issue of whether deep-inelastic scattering data systematically prefer lower values of than hadron or collider data.
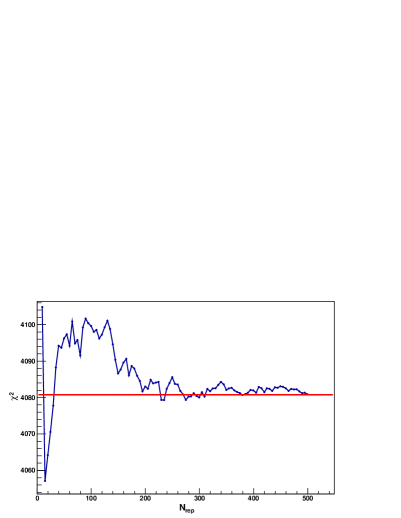
The main difficulty in determining in the NNPDF approach is that, since PDFs are delivered in the form of a Monte Carlo sample, the quality of the fit (i.e. the of the comparison between data and theory) is a random variable, which only tends to a constant value in the limit in which the size of the Monte Carlo sample tends to infinity. The typical fluctuation of the for a single Monte Carlo replica is of the order of the square root of the number of data points , while the fluctuations of the average over a sample of replicas decrease as . So in order to be sensitive to variations of the total by a few units, as required for determination of a physical parameter, one needs for each value of a number of replicas of the same order of magnitude as the number of independent data points. The total number of replicas required is thus rather large, which makes for a rather computationally intensive task. The value of the for a typical NNPDF fit (with ) is shown as a function of in Fig. 1.
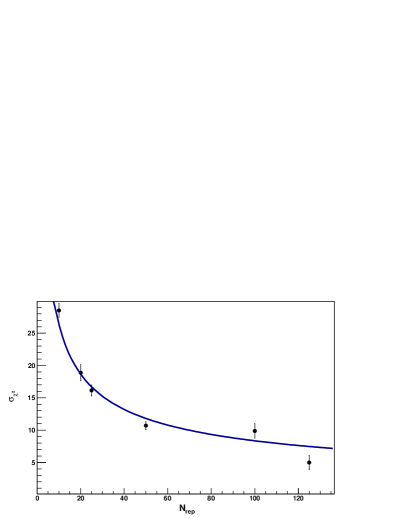
The uncertainty on the value of the due to the finite size of the replica sample may be computed using the so-called bootstrap method. Namely, the sample of replicas is divided into disjoint partitions with replicas each. The variance of the for the full replica sample is then found from the variance of the values of each replica subsample according to
| (2) |
The value of , averaged over all the (eleven) values of to be considered, is displayed in Fig. 1. A fit of the form , also shown in Fig. 1, shows that the expected decrease of the fluctuations with is borne out by the data.
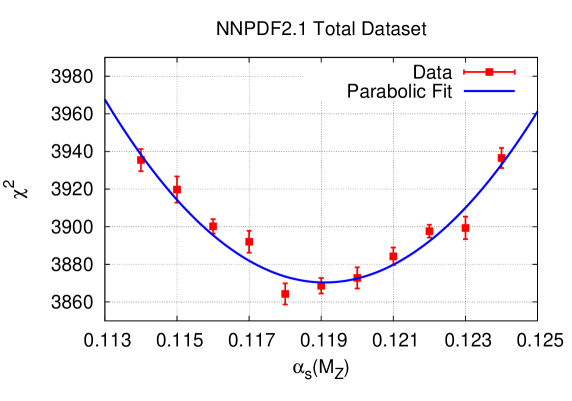
The determination of is performed by simply using a wide enough PDF replica set for fixed values of to compute for each value of the values of and its uncertainty Eq. (2), and then fitting a parabola to the viewed as a function of . The quality of the parabolic fit is then determined by evaluating the corresponding , with : a reasonable value of may be used to confirm that the parabolic approximation to is adequate in the range of under investigation. The minimum of the parabola then provides the best-fit value of while the range gives the uncertainty on it at a 68% confidence level. The further uncertainty due to the finite size of the replica sample is determined by error propagation of Eq. (2) on the position of the minimum of the parabola.
We now turn to results. For each value of we use a sample of at least replicas, with bigger samples of replicas used for more sparse equally–spaced values in order to increase accuracy. For the fit to HERA data only, the range of values considered has been enlarged in order to ensure that the location of the minimum is approximately at the center of the region of which is being explored, and also because in this case the sensitivity to is weaker due to the much smaller size of the data sample. The values of and numbers of replicas used in each case are summarized in Table 1.
| 2.1 global | |
|---|---|
| 0.114 | 500 |
| 0.115 | 500 |
| 0.116 | 1000 |
| 0.117 | 500 |
| 0.118 | 500 |
| 0.119 | 1000 |
| 0.120 | 500 |
| 0.121 | 500 |
| 0.122 | 1000 |
| 0.123 | 500 |
| 0.124 | 500 |
| 2.1 DIS–only | |
|---|---|
| 0.114 | 500 |
| 0.115 | 500 |
| 0.116 | 1000 |
| 0.117 | 500 |
| 0.118 | 500 |
| 0.119 | 1000 |
| 0.120 | 500 |
| 0.121 | 500 |
| 0.122 | 1000 |
| 0.123 | 500 |
| 0.124 | 500 |
| 2.1 HERA–only | |
|---|---|
| 0.100 | 1000 |
| 0.102 | 500 |
| 0.104 | 500 |
| 0.106 | 1000 |
| 0.108 | 500 |
| 0.110 | 500 |
| 0.112 | 1000 |
| 0.114 | 500 |
| 0.115 | 500 |
| 0.116 | 1000 |
| 0.117 | 500 |
| 0.118 | 500 |
| 0.119 | 1000 |
| 0.120 | 500 |
| 0.121 | 500 |
| 0.122 | 1000 |
| 0.123 | 500 |
| 0.124 | 500 |
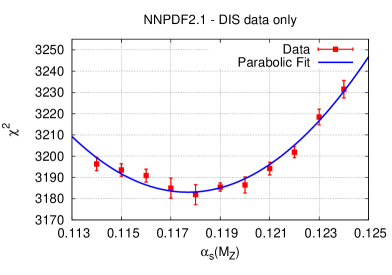
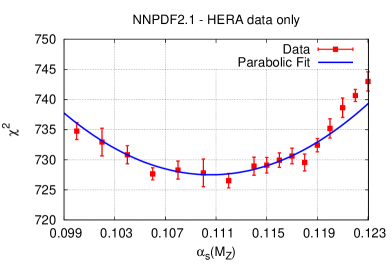
The parabolic profile of as a function of is shown in Fig. 2 for the NNPDF2.1 global fit. Analogous results for fits to DIS data only and to HERA data only are shown in Fig. 3. The corresponding values and uncertainties of are collected Table 2. In each case, we denote with “exp” the uncertainty from the range and with “proc” the propagated “procedural” uncertainty, due the finite size of the replica sample. The quality of the parabolic fit is also shown in each case.
| NNPDF2.1 | 1.6 | |
| NNPDF2.1 DIS–only | 0.7 | |
| NNPDF2.1 HERA–only | 0.7 | |
| NNPDF2.1 red. | 1.5 | |
| NNPDF2.1 DIS–only red. | 0.5 | |
| NNPDF2.1 HERA–only red. | 1.1 | |
| NNPDF2.0 | 0.4 | |
| NNPDF2.0 DIS–only | 1.4. |
The procedural uncertainties in Tab. 2 are all very small. This implies that the best-fit value of is already approximately independent of the size of the replica sample, and a further increase in the number of replicas is not necessary. However, it is useful to check this independence explicitly by varying the number of replicas, in order to make sure that the finite-size uncertainty has been determined correctly. To this purpose, we have repeated the three NNPDF2.1 determination of with for all values of . Results are also collected in Table 2 and indeed show excellent stability: the change in value of is always smaller than the procedural uncertainty as the number of replicas is decreased. The values of the parabolic fit should follow a distribution with degrees of freedom for the global and DIS fits, and for the HERA only fit. The standard deviation of is thus expected to be of order , as indeed observed. We have finally checked that excluding the points at the edge of the fit, and adding extra parameters to the fit, has no significant effect on the results, and in particular it does not improve the quality of the parabolic fit.
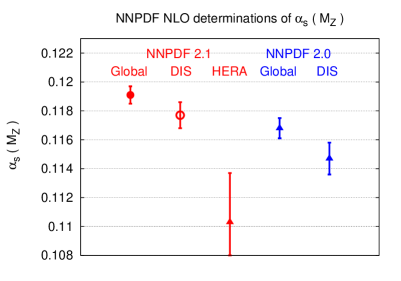
Our results for are displayed graphically in Fig. 4. Our best-fit value of is in good agreement with the PDG value Eq. (1), and has a surprisingly small experimental uncertainty. The experimental uncertainty increases as the size of the dataset is reduced, as it ought to. We see no evidence that DIS data prefer a significantly lower value of : the difference between values of the global and DIS-only determinations is of order of one , and thus entirely compatible with statistical fluctuations. Interestingly, the value found using HERA data only is much smaller, even though, because of the considerable (almost sixfold) increase in statistical uncertainty it is still less than three from the global fit. The fact that HERA data prefer a lower value of may be related to the deviations between HERA data and the predicted NLO scaling violations which was observed in Refs. [5, 6] for the smallest and HERA data: these may be affected by small resummation or saturation effects. As shown there, scaling violations in this region are weaker than predicted from the behaviour observed in other kinematic regions, and thus would tend to bias the value of downwards. A dedicated analysis would be required to prove conclusively that this is the case.
We make no attempt here to estimate theoretical uncertainties in our fit. Uncertainties due to inefficiencies of the global PDF fit (such as, for example, any residual bias related to parton distributions) should show up in the behaviour of the as a function of , either as point-to-point fluctuations or as a systematic deviation from the underlying unbiased quadratic behaviour (if they are correlated to the value of ). The good quality of the parabolic fit suggests that these uncertainties are small, and thus that our uncertainty is an accurate assessment of the total uncertainty due to the statistical and systematic uncertainties in the experimental data. On top of these, however, there will be genuine theoretical uncertainties related to the theory used in the computation of the various processes under investigation. Of these, the main ones are likely to be related to NNLO and higher QCD corrections (and possibly resummation of higher order QCD corrections in some kinematic regions), and to the treatment of heavy quark mass effects. These uncertainties are presumably of similar size here as in other determinations of based on the same QCD processes; whereas they were studied systematically in older determinations (such as Ref. [14]), they have not been assessed for any of the more recent determinations. In cases in which both NLO and NNLO determinations are available, such as Ref. [15, 16], a sizable downward shift of the best-fit value, of order of several percentage points, has been observed when going from NLO to NNLO. It will be interesting to see whether such an effect is also present in the NNPDF approach.
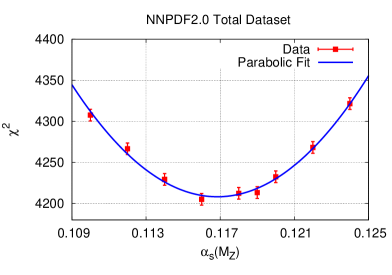
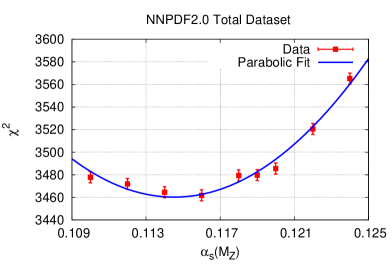
As a very crude estimate of the order of magnitude of effects related to heavy quark masses, we have repeated the fit to the global dataset and that to DIS data using the NNPDF2.0 [17] PDF set, which is based on a zero-mass variable flavour number scheme, in which all heavy quark masses are neglected. The results are also given in Table 2 and shown in Fig. 4, while the corresponding parabolic fits are displayed in Fig 5. For these fits, replicas are used for all values of . Neglecting heavy quark mass effects induces a significant downward shift in . If one were to conservatively estimate the uncertainty due to heavy quark mass effects as the difference between the NNPDF2.1 and NNPDF2.0 results one would get, for the global fit, . In the fit to DIS data only the shift is larger since the hadronic data are unaffected by the treatment of heavy quark mass effects. It is likely that the order of magnitude of uncertainties related to higher order corrections is comparable, so that the theoretical uncertainty is very likely to be the dominant one.
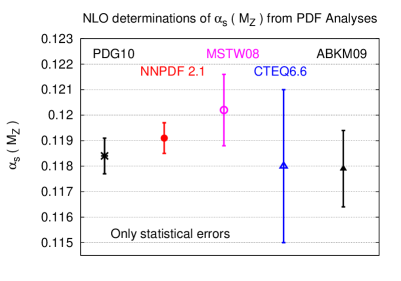
Our result using the standard (global) NNPDF2.1 set is compared in Fig. 4 to other recent NLO determinations of which rely respectively on the MSTW [15], CTEQ [21] and ABKM [16] PDF sets (ABKM and MSTW also provide determinations at NNLO). The MSTW and ABKM groups perform a simultaneous fit of PDFs and the strong coupling, thus obtaining a correlated Hessian matrix which mixes the PDF parameters with , while CTEQ simply studies the dependence of the fit quality on as is done here (see Sect. 3 of Ref. [20]). The equivalence of the uncertainty obtained from either method is explicitly shown in Ref. [21]. The dataset on which the CTEQ and MSTW determinations are based is very similar to our own, while ABKM use a smaller dataset, which in particular does not include collider jet and vector boson production data. All these determinations are in agreement with each other within uncertainties. The rather larger statistical uncertainties found by CTEQ and MSTW can be understood as a consequence of the fact that these groups [15, 21] use a tolerance [22] criterion to obtain 68% confidence levels, based on a substantial rescaling of the uncertainty ranges in parameter space. This is not necessary in our approach because, once the is treated as a random variable, its fluctuations can be studied (and in particular kept under control) by a suitable choice of the size of the Monte Carlo sample, as discussed above.
| Experiment | ||
|---|---|---|
| NMCp | -0.05 | |
| BCDMS | -0.78 | |
| HERA-I | -1.65 | |
| ZEUS-H2 | 0.75 | |
| NuTeV | -0.89 | |
| ZEUSF2C | 0.77 | |
| E605 | 0.22 | |
| E866 | 1.87 | |
| CDFWASY | 0.16 | |
| CDFZRAP | 1.18 | |
| D0ZRAP | -0.53 | |
| CDFR2KT | -1.67 | |
| D0R2CON | 1.57 |
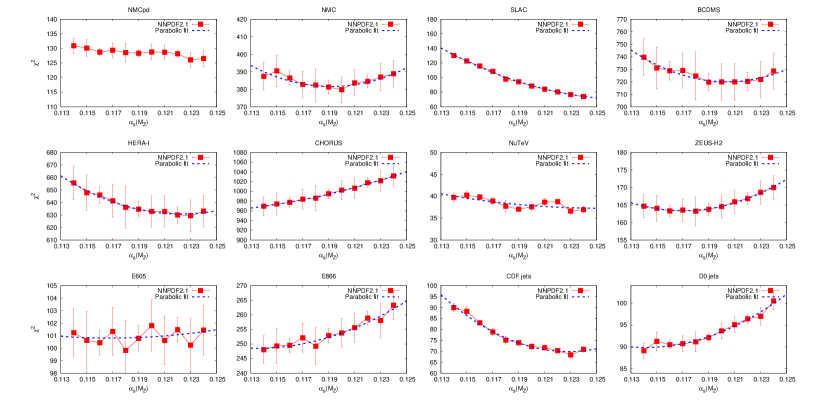
This conclusion may be cross-checked using a variant of the method suggested in Ref. [23], namely, by checking whether the distribution of results obtained from individual datasets follows a gaussian distribution and determining the width of this distribution. To this purpose, we have performed a parabolic fit to the profile for each experiment entering in the global NNPDF2.1 determination. Results are displayed in Fig. 6 together with the uncertainties due to the finite size of the replica sample, determined as above. These uncertainties are clearly much larger than the point-to-point fluctuations of the individual values for each experiment, due to the fact that the latter, being determined from a global fit, are strongly correlated with each other. The value of and its statistical uncertainty for each experiment are determined by performing a parabolic fit to each profile: results are collected in Table 3, for all experiments for which there is a minimum in the fitted range. This is not the case for the NMCratio, SLAC, CHORUS, H1F2C and FLH108 data.
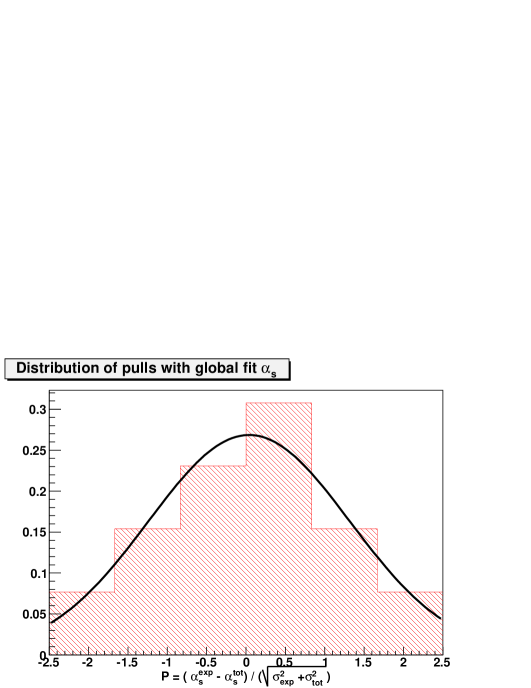
The distribution of results can be studied defining the pull
| (3) |
where is the best fit value for the –th experiment and the associated statistical uncertainty, obtained from the rule. The pulls are summarized in Table 3 and displayed graphically in Fig. 7. A gaussian fit to the distribution of pulls is performed, and also displayed in Fig. 7. The gaussian fit is in good agreement with the histogram data with mean and standard deviation . The standard deviation would be further reduced somewhat if finite-size uncertainties were included; this however would require a lengthy correlation analysis. We conclude that the value of the tolerance required to get a perfectly gaussian distribution of pulls is smaller than — a value which is clearly compatible with a statistical fluctuation.
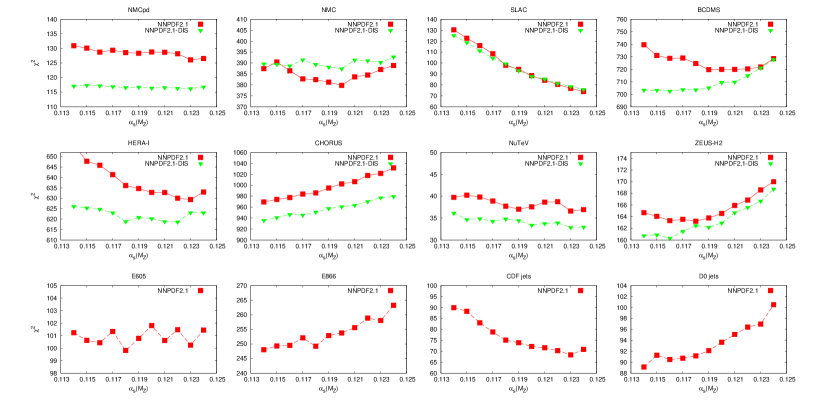
Finally, we exploit the fact that in our approach a single procedure can be used to obtain PDFs from datasets of different size, in order to study the issue of whether (and why) different values of may be preferred by different datasets. In Fig. 8 we compare the profiles for the global NNPDF2.1 fit, already shown in Fig. 6, to the same quantities determined for the fit to DIS data only. The behaviour of the fit quality for BCDMS data is particularly interesting: these data have been repeatedly found [8, 15, 24] to prefer a relatively low value of (in particular, lower than Eq. (1)). It turns out that the profile for these data is rather different according to whether one is looking at PDFs determined using DIS data only (green, lower curve in Fig. 8) or a global fit (red, higher curve in in Fig. 8). Indeed, in the DIS-only case these data indeed seem to prefer a lower value of , but this is no longer the case in the global fit. This suggests that as is lowered, the quality of the fit to BCDMS data can be improved by changing the PDFs in a way which is allowed by DIS data, but which is not compatible with other data in the global fit. In other words, there is a runaway direction in the space of PDF parameters along which the for BCDMS data decreases as is lowered, which is forbidden in the global fit because then the for some other dataset would increase.
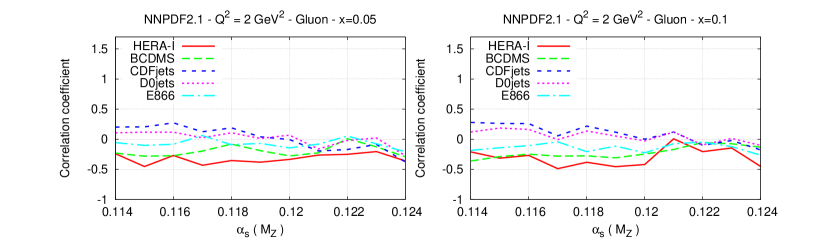
The situation can be further elucidated by studying the correlation [18] between parton distributions and the value of the for individual experiments. The presence of a nonvanishing correlation means that, at the best fit, the for that experiment is not stationary, i.e. it can be lowered or raised by changing the given PDF. Correlations of opposite sign for different experiments then mean that these experiments are pulling the PDF in opposite directions. The correlation coefficients are shown for the gluon PDF as a function of in Fig. 9 for a pair of values of , for the global NNPDF2.1 PDF set (all computed from a set of replicas). It is apparent that while for larger values of correlations are small and with the same sign, as is lowered correlations become larger, with opposite sign for jet and DIS (HERA and BCDMS) experiments (with the Drell-Yan experiment E866 showing no significant correlation). This means that indeed, as suggested above, for low DIS and jet experiments pull the gluon in opposite directions, while they become more consistent for larger : hence, a determination of including DIS data only can easily be biased. The fact that BCDMS data prefer a lower value of in a DIS-only fit, but not if the gluon is constrained by jet data was also found recently in Ref. [24], in the context of the MSTW08 parton determination. However, in that case the BCDMS data were also found to significantly bias downwards the value of of the DIS fit, perhaps due to the fact that the MSTW gluon parametrization, though more flexible than that of other groups, is still less flexible than that of present analysis.
The fact that runaway directions for the may appear in the joint -gluon space can be understood by noting that in DIS the gluon is determined by scaling violations, hence a smaller value of can be partially compensated by a larger gluon and conversely. However, the jet cross section pins down the size of the gluon (at the rather larger scale of the jet data) thereby quenching this potential instability. Hence, we conclude that even though in our fit the DIS-only value of is not significantly smaller than that for the global fit (possibly due to the great flexibility of the functional form of our PDFs), a fit to DIS data, and specifically to BCDMS data, has a potential instability in the direction of lower values of which is only kept under control by the inclusion of jet data.
We conclude that a reliable determination, with surprisingly small statistical uncertainty, can be obtained by a combined analysis of a wide set of data which simultaneously depend on the value of the strong coupling and the parton distributions. Theoretical uncertainties are likely to be dominant and significant. They could be kept under control at least in part by inclusion of higher order corrections, in particular NNLO as well as all-order resummation, which might be especially relevant for small- HERA data [25, 6, 5]. Once resummation corrections are properly included, it might be convenient to use for DIS only HERA data, which are free of ambiguity related to nuclear corrections or power-suppressed corrections. It will be interesting to repeat the analysis presented here once PDF sets which include these higher order effects become available.
Acknowledgments
We thank V. Radescu and G. Watt for discussions, G. Altarelli for a
critical reading of the manuscript, and A. Martin for communicating to
us Ref. [24] prior to publication. We are grateful to
A. Vicini and the
staff of the LCM computer lab at Milan university for support and assistance
with the theory group computing farm. M.U. is supported by the
Bundesministerium für Bildung and Forschung (BmBF) of the Federal
Republic of Germany (project code 05H09PAE).
This work was partly supported by the Spanish MEC FIS2007-60350 grant.
References
- [1] S. Bethke, Eur. Phys. J. C64 (2009) 689, 0908.1135.
- [2] LHC Higgs Cross Section Working Group, S. Dittmaier et al., (2011), 1101.0593.
- [3] F. Demartin et al., Phys. Rev. D82 (2010) 014002, 1004.0962.
- [4] Particle Data Group, K. Nakamura, J. Phys. G37 (2010) 075021.
- [5] F. Caola, S. Forte and J. Rojo, Phys. Lett. B686 (2010) 127, 0910.3143.
- [6] F. Caola, S. Forte and J. Rojo, Nucl. Phys. A854 (2010) 32, 1007.5405.
- [7] S. Forte et al., Nucl. Phys. B643 (2002) 477, hep-ph/0205286.
- [8] M. Virchaux and A. Milsztajn, Phys. Lett. B274 (1992) 221.
- [9] M. Arneodo et al., Phys. Lett. B309 (1993) 222.
- [10] L. Del Debbio et al., JHEP 03 (2005) 080, hep-ph/0501067.
- [11] L. Del Debbio et al., JHEP 03 (2007) 039, hep-ph/0701127.
- [12] R.D. Ball et al., Nucl. Phys. B809 (2009) 1, 0808.1231.
- [13] R.D. Ball et al., Nucl. Phys. B823 (2009) 195, 0906.1958.
- [14] R. D. Ball and S. Forte, Phys. Lett. B358 (1995) 365, hep-ph/9506233.
- [15] A.D. Martin et al., Eur. Phys. J. C64 (2009) 653, 0905.3531.
- [16] S. Alekhin et al., Phys. Rev. D81 (2010) 014032, 0908.2766.
- [17] R.D. Ball et al., Nucl. Phys. B838 (2010) 136, 1002.4407.
- [18] R.D. Ball et al., (2011), 1101.1300.
- [19] S. Forte et al., Nucl. Phys. B834 (2010) 116, 1001.2312.
- [20] S. Alekhin et al., 1101.0536 [hep-ph].
- [21] H.L. Lai et al., Phys. Rev. D82 (2010) 054021, 1004.4624.
- [22] J. Pumplin et al., Phys. Rev. D65 (2001) 014013, hep-ph/0101032.
- [23] J. Pumplin, Phys. Rev. D81 (2010) 074010, 0909.0268.
- [24] A.D. Martin et al., “ is MSTW analyses”, to be published in the proceedings of the Workshop on Precision Measurements of , Munich, February 2011; http://indico.mppmu.mpg.de/indico/getFile.py/access?contribId=27&sessionId=8&resId=0&materialId=slides&confId=973
- [25] G. Altarelli, R.D. Ball and S. Forte, Nucl. Phys. B799 (2008) 199, 0802.0032.