The dark halo of the Hydra I galaxy cluster: core, cusp, cosmological? ††thanks: Based on observations taken at the European Southern Observatory, Cerro Paranal, Chile, under the programs 082.B-0680, 076.B-0154, 065.N-0166, 065.N-0459.
Abstract
Context. Some galaxy clusters exhibit shallow or even cored dark matter density profiles in their central regions rather than the predicted steep or cuspy profiles, conflicting with the standard understanding of dark matter. NGC 3311 is the central cD galaxy of the Hydra I cluster (Abell 1060).
Aims. We use globular clusters around NGC 3311, combined with kinematical data of the galaxy itself, to investigate the dark matter distribution in the central region of Hydra I .
Methods. Radial velocities of 118 bright globular clusters, based on VLT/VIMOS mask spectroscopy, are used to calculate velocity dispersions which are well defined out to 100 kpc. NGC 3311 is the most distant galaxy for which this kind of study has been performed. We also determine velocity dispersions of the stellar component from long slit spectroscopy of NGC 3311 with VLT/FORS1 out to 20 kpc. Moreover, we present a new photometric model for NGC 3311, based on deep VLT/FORS1 images in the V-band. We search for a dark halo which in the context of a spherical Jeans model can reproduce the kinematical data. We also compare the radial velocity distributions of globular clusters and planetary nebulae.
Results. The projected stellar velocity dispersion rises from a central low value of about 185 km/s to 350 km/s at a radius of 20 kpc. The globular cluster dispersion rises as well from 500 km/s at 10 kpc to about 800 km/s at 100 kpc, comparable to the velocity dispersion of the cluster galaxies. A dark matter halo with a core (Burkert.halo) reproduces well the velocity dispersions of stars and globular clusters simultaneously under isotropy. The central stellar velocity dispersions predicted by cosmological NFW halos are less good representations, while the globular clusters allow a wide range of halo parameters. A suspected radial anisotropy of the stellar population as found in merger simulations aggravates the deviations. A slight tangential anisotropy permits better representations. However, we find discrepancies with previous kinematical data, which we cannot resolve and which may indicate a more complicated velocity pattern.
Conclusions. Although one cannot conclusively demonstrate that the dark matter halo of NGC 3311 has a core rather than a cusp, a core seems to be preferred by the present data. A more complete velocity field and an analysis of the anisotropy is required to reach firm conclusions.
Key Words.:
Galaxies: individual: NGC 3311 – Galaxies: kinematics and dynamics – Galaxies: star clusters1 Introduction
Cosmological simulations of dark matter halos of galaxies predict the
density profiles in the very inner regions to be cuspy, i.e. the density
reaches very high values for small radii, and the logarithmic
density slope takes the value (the NFW profile; e.g. Navarro et al. 2004) or even smaller, e.g.
Bullock et al. (2001), Diemand et al. (2005).
Confronted with observations of
low-surface brightness galaxies,
this prediction has not been confirmed (see de Blok 2010 for a review).
It has instead been found that the density profiles are better described
by having a core, i.e. the central logarithmic density slope is zero.
Brighter galaxies are baryon dominated in their centers, and therefore the
inner dark
matter density slopes of bright spirals and ellipticals are more difficult to determine. However, there is some evidence for cuspy halos in early-type galaxies (Tortora et al., 2010).
Since dark matter halos are self-similar,
one also expects cuspy dark halos on the larger scales of galaxy
groups and galaxy clusters. The best test objects are
central cD galaxies with central low surface brightness. For example,
Kelson et al. (2002) investigated NGC 6166, the central galaxy of Abell 2199
by long-slit spectroscopy reaching out to 60 kpc. They found that the
observations were best represented by a halo with a large core rather
than being cuspy.
Moreover, Sand et al. (2004, 2008), using strong and weak lensing
models in combination with the kinematics of the central galaxies, found for
the clusters Abell 383 and MS 2137-23 shallow dark matter profiles which
are incompatible with the steep NFW slope. The same result emerged from a
study of the lens properties of Abell 611 (Newman et al., 2009). See also Newman et al. (2011) for
an improved analysis of Abell 383.
These are important observations, pointing towards some fundamental deficiency of the present understanding of dark matter. It is therefore of high interest to investigate this issue by using a variety of dynamical tracers.
In this context, NGC 3311, the central galaxy of Abell 1060, is one of the most attractive targets. It is the nearest cD galaxy, has a low surface brightness, and exhibits an extremely rich globular cluster system, (e.g. Wehner et al. 2008), providing a wealth of very bright globular clusters which can be used as dynamical tracers. NGC 3311 is probably the most distant galaxy where this kind of study can currently be performed. Here we measured radial velocities of about 120 globular clusters. Simultaneously, we use long-slit spectra of NGC 3311 itself to investigate the kinematics of the stellar body. Our objective is to describe the stellar kinematics and the GC kinematics consistently with the same dark halo model.
We adopt a distance modulus of 33.4 (a handy value close to the mean given by NED), corresponding to 47.9 Mpc and a scale of 232 pc/arcsec.
2 Observations and data
Observations and reductions of all data used here are extensively presented in parallel or previous contributions. Here we give a few basic remarks only. The globular cluster data have been taken with VLT/VIMOS on Cerro Paranal in service mode. We merged two VIMOS programmes, using multi-slit masks with the medium resolution grism. Details of the observations, data reduction, and derivation of radial velocities are described by Misgeld et al. 2011 (submitted to A&A). The VLT/FORS1 images in the V-band which provide the photometric model of NGC 3311, are discussed in Misgeld et al. (2008). The long-slit spectra have been obtained using VLT/FORS1 at Cerro Paranal, using the grism 600B. Observations and data reduction are described in detail by Spolaor et al. 2010 (submitted to MNRAS). A preliminary account of the long-slit data has been given by Hau et al. (2004).
3 Ingredients for a Jeans-analysis: Photometric model and kinematics
3.1 Photometric model for NGC 3311
We derive the light profile of NGC 3311 by applying IRAF/ELLIPSE in an iterative manner, subtracting in each iteration the contributing light of the neighbouring galaxy NGC 3309 until its residual light is not longer noticeable.
Since we want to work with an analytical expression for the projected light which also permits an analytical deprojection and an analytical cumulative luminosity, we prefer a double beta-model for the surface brightness (see also Schuberth et al. 2010) for which we obtain:
| (1) |
with = 1.83810-8, = 2.6710-9, = 5″, = 50″, = . To transform this surface brightness into , one has to apply a factor to the argument of the logarithm. An additional factor 1.27 corrects for the extinction in the V-band (Schlegel et al. 1998).
Fig.1 shows in its upper panel the measured surface brightness, and in its lower panel the difference of our photometric model with the measurements in the sense measurements-model.
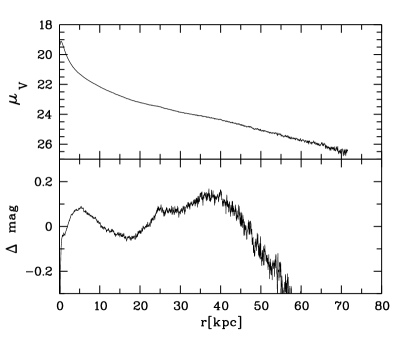
Out to 50 kpc, the representation is excellent, the largest residuals being 0.1 mag. Then the model becomes gradually fainter. However, that happens at such faint magnitudes that neither the deprojection nor the cumulative luminosity are significantly affected. Furthermore, the accuracy of the photometry may be questioned. While the low central surface brightness of NGC 3311 and its extended light profile (besides its central position) are characteristics of a cD-galaxy, we cannot identify an inflection point (Kormendy & Djorgovski, 1989) which would mark a transition between a normal elliptical galaxy and a halo with a shallower light profile. For example, the difference with NGC 1399 in the Fornax cluster is the larger core of the NGC 3311 light profile. At large radii, both profiles decline approximately as (Dirsch et al., 2003).
3.2 Globular clusters: dispersion and number density profile
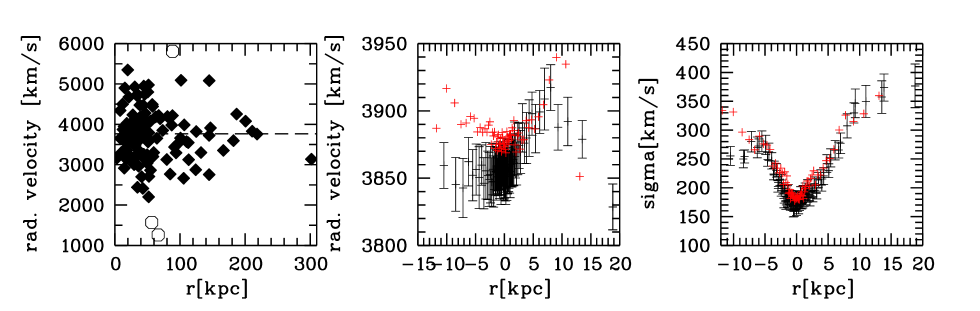
We measured radial velocities for 118 bright globular clusters (GCs) in the absolute magnitude range . We use this label for simplicity although the vast majority of these objects also can be named “Ultracompact Dwarfs” (e.g. Mieske et al. 2009). Fig.2 (left panel) displays the velocities versus galactocentric distance. While for distances less than 60-70 kpc the velocity dispersion seems to be statistically well defined, it is not the case for larger distances. It is clear that the removal of the two objects near 5000 km/s with distances 100 kpc and 120 kpc would lower the dispersion considerably. However, a sudden drop of the dispersion beyond 100 kpc does not seem physical. Moreover, the velocity dispersion of the cluster galaxies is about 800 km/s at 100 kpc (Łokas et al., 2006) which suggests the outer GC dispersion to be of similar order. We consider the three open circles as obvious outliers and do not include them in the dispersion calculation. We think, however, that these are interesting objects, see the remarks in section3.6. Here we only consider the full GC sample. Subsamples are discussed in Misgeld et al. 2011 (submitted to A&A).
The upper panel of Fig.4 shows the corresponding dispersion values and their uncertainties for 7 overlapping bins. Their widths of 1.5-2 arcmin assure that each bin contains about 30 objects (the two outermost bins have widths of 6 and 16 arcmin, respectively), enabling a solid statistical definition of the velocity dispersion (with the caveat given above for large radii). The velocity dispersions have been determined using the estimator of Pryor & Meylan (1993). For a Jeans-analysis, we need the number density profile of the GCs which we adopt from Wehner et al. (2008), but their study reaches out to 3 only and thus must be extrapolated to larger radii. For a convenient deprojection, we fit their density profile to a Hubble-Reynolds law (see e.g. Schuberth et al. 2010 ; equation (11)) and obtain for the surface density
| (2) |
with N(r) as the number per kpc2.
3.3 The role of NGC 3309 and remarks on the validity of equilibrium
One might suspect a certain level of contamination of the cluster system of NGC 3311 by clusters from the nearby giant elliptical NGC 3309, which has a projected distance of only 100 from NGC 3311. Already Harris et al. (1983) and McLaughlin et al. (1995) estimated this contamination globally to be small considering the huge cluster system of NGC 3311. Wehner et al. (2008) quote as the total number of NGC 3311 clusters in comparison to only in the case of NGC 3309 which means an abnormally low specific frequency of about 0.9 for NGC 3309. This suggests that NGC 3309 might have lost part of its original cluster system to NGC 3311. The pair NGC 3311/NGC 3309 bears some resemblance to the central pair NGC 1399/NGC 1404 in the Fornax cluster with NGC 1404 being also underabundant in globular clusters (Richtler et al., 1992) and clusters actually belonging to NGC 1404 indeed contaminate the cluster system of NGC 1399 (Schuberth et al., 2010). However, our sample of NGC 3311 clusters exclusively consists of very bright objects which are genuinely sparse in normal ellipticals, so we expect the contamination by NGC 3309 to be even lower than the 2% quoted by Wehner et al. (2008).
A further difference to NGC 1399/NGC 1404 is visible in the X-ray isophotes. At radii larger than 8 kpc, the X-ray isophotes of NGC 1404 are distorted (Paolillo et al., 2002) which indicates the spatial proximity of NGC 1404 to NGC 1399, while no distortion is visible in the isophotes of NGC 3309 observed with Chandra (Yamasaki et al., 2002) and XMM-Newton (Hayakawa et al., 2006) These observations support the assumption that NGC 3311 is at the center of the cluster potential and NGC 3309 spatially at a larger distance from NGC 3311 than the projected one. Yamasaki et al. also point out the good isothermality (the XMM-Newton temperature slightly decreases) and apparent equilibrium of the X-ray gas in NGC 3311. Signs of an ongoing merger are at least not noticable. This is in line with the relative distance between NGC 3309 and NGC 3311 given by Mieske et al. (2005) using surface brightness fluctuations. NGC 3309 appears to be somewhat in the foreground.
The assumption of spherical equilibrium of the NGC 3311 cluster system and of Abell 1060 as a whole probably is invalid to a certain degree. The notion of Fitchett & Merritt (1988) that the galaxy velocity distribution in Abell 1060 is flatter than a Gaussian, still holds with the extended sample of Christlein & Zabludoff (2003). We did the excercise of performing a Shapiro-Wilk W-test for normality and found for 212 galaxies ( 6000 km/s) within a radius of 600 kpc a p-value of 0.003 which indicates a non-Gaussian distribution (note that this does not mean non-isotropy: in the galaxy cluster sample of Łokas et al. 2006, Abell 1060 is the most isotropic cluster). On the other hand, our globular cluster sample gives a p-value of 0.68, not contradicting a normal distribution.
3.4 Stellar kinematics
We analysed major axis (PA=28.9∘) and minor axis (PA=118.9∘) long slits. The NW-part of the minor axis is influenced by NGC 3309 at radii larger than 10 kpc. The spectra are spatially rebinned in order to achieve a constant S/N of 40 (major axis) and 30 (minor axis). Mean velocity and velocity dispersion were measured employing the penalized pixel fitting (pPXF) method by Cappellari & Emsellem (2004). In the pPXF analysis, stellar templates from the MILES spectral library (Sánchez-Blázquez et al., 2006) are convolved with a Gaussian model (plus higher order corrections) of the line-of-sight velocity distribution until the -deviations become minimal.
Fig.2 (middle and right panel) shows the results. Radial distances are given in kpc with the negative values referring to the SW-part of the major axis and to the NW-part of the minor axis. The radial velocity curve (middle) exhibits a slightly asymmetric shape in both axes, perhaps indicating a small-scale complex velocity field. The rise of the velocity dispersion (right panel) from a quite low central value of about 180 km/s to 350 km/s at 20 kpc (already shown in Hau et al. 2004) resembles NGC 6166 in Abell 2199 (Carter et al. 1999, Kelson et al. 2002) where the dispersion rises to about 600 km/s at 60 kpc.
The velocity dispersion along the major axis shows some asymmetry as well in the sense that the SW part rises slightly faster than the NE part, also seen in the minor axis. Loubser et al. (2008) also show velocity dispersions for NGC 3311 with a radial limit of 15(3.5 kpc). Our measurements agree with their values in the common inner region. Recently, Ventimiglia et al. (2010) presented stellar kinematics of NGC 3311 out to 30 kpc. Their interesting interpretation of NGC 3311 is that of a small galaxy embedded in a cluster-bound stellar halo, the transition occurring between 4 and 12 kpc. We plot their outer six bins in the two lower panels of Fig.4. Their two inner values (from Gemini/GMOS) are compatible with our measurements while their intermediate values (from VLT/FORS2) are considerably higher. Their outermost value is again compatible with our model prediction (see 4). Our major axis slit crosses their FORS2 slit in the NE-quadrant at a radius of about 50(11.6 kpc). Large azimuthal differences over scales of 10- 20 would be very surprising. Furthermore, the comparison of the major and minor axes rather supports sphericity. This issue remains open until a full map of kinematical data becomes available.
3.5 X-ray gas mass
On the galaxy cluster scale, the dominant baryonic component is the hot X-ray plasma. From various X-ray studies of Abell 1060, we adopt the most recent XMM-Newton work by Hayakawa et al. (2006) and neglect that their adopted distance is slightly smaller (45.6 Mpc). One finds the gas mass by numerical integration over a beta-profile for the gas density
| (3) |
where = 11.7 cm-3 is the central electron density, the mean molecular weight, the proton mass, kpc the scale radius, and .
In the isothermal case with kT= 3.3 KeV, the dynamical mass is then given by e.g. Grego et al. (2001)
| (4) |
We note, that this mass profile is not a good description for small radii: within 25 kpc, the stellar mass alone is larger than the dynamical mass. The notion of Hayakawa et al. that the central density profile is cuspy, therefore must be seen with caution. We find good agreement with their gas mass profile. However, the gas mass has only a minor influence on the dynamics, but we include it as the main baryonic component on larger scales. The dynamical mass is used in section 4.3.
3.6 Comparison of globular cluster velocities with planetary nebulae
During the revision process of this paper, Ventimiglia et al. (2011) published radial velocities of a sample of 56 planetary nebulae (PNe) around NGC 3311. It is therefore appropriate to make a brief comparison of PNe and GCs.
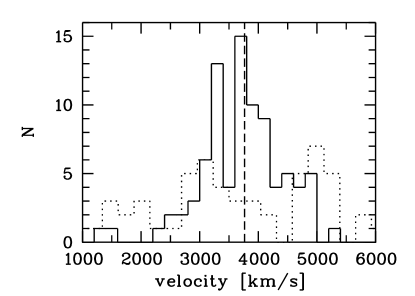
Fig.3 compares the velocity histograms of PNe and GCs inside a radius of 65 kpc which is set by the radial extent of the PNe sample. The first remark is that the PNe sample suffers even more from small number statistics than the GC sample. Any conclusion has to be confirmed with a larger sample. It is, however, striking that the velocity distribution lacks the peak around the velocity of NGC 3311 which the GC sample prominently shows. Ventimiglia et al. (2011) suggest (along with the speculation that NGC 3311 is intrinsically devoid of PNe) that ram pressure stripping of the PN-shells in the dense parts of the hot X-ray plasma might be responsible by shortening the lifetimes of PNe. In this case the PNe are sampled outside a cavity around NGC 3311. The questions remain why such effect should remove the velocity peak and why this is neither visible in NGC 1399 (McNeil et al., 2010) nor in M87 (Doherty et al., 2009) where the gas densities are of comparable order. One could add the speculation that the PNe stem from different stellar parent populations, perhaps partly of intermediate-age reminiscent of earlier infall of (dwarf?)-galaxies.
The peak at 3300 km/s in the GC distribution is within the present sample not trustworthy. Only a few more objects with about 3500 km/s would suffice to erase it. However, there is a similarity with PNe concerning GCs at larger radii than 100 kpc. As visible in Fig.2, there seems to be a bias towards velocities below the systemic velocity. Again: whether this a sample size effect or not, must be investigated with a larger sample.
Interesting is the occurrence of PNe with velocities smaller than 1500 km/s in which range also two GCs are found (1293 km/s and 1570 km/s, Misgeld et al. 2011, submitted to A&A ). These are deviations of partly more than 3 for a Gaussian distribution centered on NGC 3311, corresponding to a probability of 0.1% or less. For the GCs it is already improbable to have objects at this velocity, for the PNe due their smaller sample and three objects even more so. The much larger samples of galaxies (Christlein & Zabludoff, 2003) and dwarf galaxies (Misgeld et al., 2008) do not contain velocities below 2000 km/s.
The question is therefore whether these low velocities are recession velocities rather than Doppler-velocities. While the existence of stellar populations between galaxy clusters would be intriguing, one has to wait for future surveys. However, very high peculiar velocities are principally possible. We come back to this issue in section 4.4.
4 Dynamical models
We present dynamical models which are solutions of the non-rotating spherical Jeans-equation (see Mamon & Łokas 2005 for a collection of the relevant formulae). They can be considered good approximations to spherical stellar systems, assuming equilibrium. We further assume that NGC 3311 is at rest at the center of the cluster potential. Given the data limitations, we regard our results as a first approximation to the mass distribution which will be refined later both observationally and theoretically.
With the stellar mass component, the gaseous component and an assumed dark halo, for which we try out various representations, we model the projected velocity dispersions versus projected radius, using the formulae quoted in Mamon & Łokas (2005). We require a dark halo, which simultaneously can account for the dispersion of globular clusters and stars.
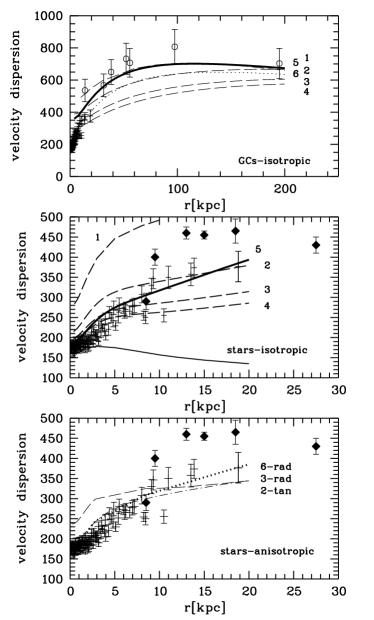
The upper panel in Fig.4 shows the dispersion of GCs as described in section 3.2. Various models are indicated. All use for the stellar population which is needed to reproduce the inner stellar velocity dispersion, and which also is close to the expected value for an old metal-rich population such as NGC 3311 (Spolaor et al. 2011, submitted to MNRAS). The middle panel shows the velocity dispersion of the stellar population where the same models are indicated. These models assume isotropy for the stellar distribution of orbits. To demonstrate the need for dark matter, the lower solid line is the expected dispersion without a dark halo. The lower panel shows for selected halos the effect of radial and tangential anisotropies. The kinematical data of Ventimiglia et al. (2010) are plotted In the lower two panels.
In the following we discuss the models individually.
4.1 NFW halos
The dark halo of Abell 1060 has been previously investigated by Łokas et al. (2006) by a Jeans-analysis, using published galaxy velocities. They use NFW-halos (e.g. Navarro et al. 2004) which are analytically represented by
| (5) |
where and are the characteristic density and radius, respectively. They have the cumulative mass
| (6) |
It is customary to define a virial radius (which includes the virial mass ) inside which the mean density is by a certain factor higher than the critical density of the Universe. This factor is mostly set to 200. A further parameter is the ”concentration” . Simulations agree in that there is a relation between and c, albeit with some scatter. (Macciò et al., 2008) quote for that relation (we adopt their eq.10 for relaxed halos and set h=1 for convenience)
| (7) |
In Fig.4, the upper panel refers to the regime of globular clusters, the middle panel to the regime of stars, showing isotropic models, the lower panel as well to the stars, but with a radial and a tangential model indicated. The numbers always indicate the same halos. For the halo properties, see Table LABEL:tab:models.
Halo 1 in Fig.4 shows the best fitting NFW halo of Łokas et al. (2006) with and kpc is and c=10.9 (note that these values use a factor 200 for defining the virial mass, while Łokas et al. (2006) use 101.9 and therefore quote c= 14). This halo marginally fits the globular clusters, but definitely not the stars. It has a higher concentration than a cosmological halo in the sense of eq.7, from where one would expect c=3.4. However, Łokas et al. (2006) give a large uncertainty range for their c-value, which expresses the fact that the galaxies do not strongly constrain the halo shape.
We therefore try out halos which approximately fulfill the Maccio et al.-relation and which do not deviate too strongly from the mass quoted by Łokas et al. (2006). Halo 3 falls onto this relation while halo 2 and 4 are approximately 1-sigma deviations.
Halo 3 and 4 are neither good fits for the globular cluster under isotropy (upper panel) nor do they fit the stars beyond about 8 kpc (middle panel). In order to make halo 3 a better representation, one could introduce a stellar radial anisotropy.
Modest radial anisotropies are common in elliptical galaxies and are also expected from simulations of mergers (Hansen & Moore 2006, Mamon et al. 2006). A radial anisotropy elevates the velocity dispersions, most strongly in the central regions. The prescription of Hansen & Moore (2006) minimizes the central elevation
| (8) |
where the logarithmic slope of the baryonic mass profile enters. is the anisotropy parameter. Our mass profile gives a somewhat complicated behavior, but a very good approximation is the form with =3 kpc which corresponds to eq. 60 of Mamon & Łokas (2005) and permits us to employ their analytical solutions.
This radial anisotropy for halo 3 is displayed in the lower panel. With some more fine-tuning, one could probably reach a good representation of the stellar kinematics. The problem with globular clusters of course remains.
Halo 2 is so far the most promising, although not really satisfactory. The effect of a slight, radially constant tangential anisotropy of is shown in the lower panel. One needs, however, a higher mass and/or a radial anisotropy of the globular clusters. To boost the velocity dispersion at, say, 100 kpc from 600 km/s to 750 km/s, one needs approximately a factor 1.6 in mass (which may be difficult to justify), but then a stronger tangential isotropy together with some fine-tuning is needed. We remark, however, that tangential anisotropies in elliptical galaxies seem to be rare but see NGC 1407 for an example (Romanowsky et al., 2009).
4.2 A cored halo
A more straight-forward representation can be achieved by considering a halo with a core instead of a cusp. One could think of the simple density profile , being the central density and a scale radius. However, this profile, although it permits a good representation for small radii, corresponds to very high masses for large radii, which deviate strongly from the X-ray mass profile. We therefore use the ”Burkert profile” (Burkert, 1995) which has been introduced for the dark matter profiles of spiral dwarf galaxies
| (9) |
The cumulative mass is
| (10) |
This halo is shown in Fig.4 as the thick solid line (halo 5). Such halo seems to provide the best representation.
To illustrate how the radial anisotropy of eq.8 affects this kind of halo, we plot halo 6 in the lower panel (solid thick line) which fits the stars quite well. However, we had to decrease the stellar M/L to 3 in order not to boost the central velocity dispersion. This low M/L-value is not supported by Spolaor et al. (submitted to MNRAS). Also here, a radial bias needs a lower halo mass which in turn causes difficulties to fit the globular clusters.
| ID | c | type | |||
|---|---|---|---|---|---|
| 1 | 0.0072 | 140 | 3.87 | 10.9 | NFW |
| 2 | 0.0013 | 290 | 3.97 | 5.3 | NFW |
| 3 | 0.00051 | 440 | 3.94 | 3.94 | NFW |
| 4 | 0.0003 | 570 | 4.05 | 2.7 | NFW |
| 5 | 0.02 | 75 | 2.0 (1 Mpc) | - | Burkert halo (isotropic) |
| 6 | 0.012 | 90 | 1.9 (1 Mpc) | - | Burkert halo (radial) |
4.3 Comparison with the X-ray dynamical mass and with the halos of other nearby central galaxies

.
It is interesting to compare the various halos with the X-ray based mass (Hayakawa et al. 2006; eq.4) on larger scales.
Fig.5 shows total mass profiles (stellar mass of NGC 3311 + gaseous mass+dark mass) for halos from Table LABEL:tab:models. The thick solid line is the Burkert-halo, the thin solid line is halo 1, and the dashed line is halo 2. With the exception of halo 1, they are in reasonable agreement at large distances with the X-ray based mass. We recall that halo 1 is not well defined, so its deviation might not be alarming. We moreover remark that the X-ray mass also is an extrapolation with the outermost measurement at about 170 kpc. It is amazing that the extrapolation out of a small volume of 20 kpc radius still results in sensible masses on the scale of several hundreds kpc. This raises an oddity: halo 2 represents a ”cosmological” cluster-wide halo, but there is no room anymore for a galaxy-wide halo.
Thus the central dark matter in NGC 3311 “knows” about its location within a galaxy cluster. While this is plausible with view on pure dark matter simulations, one should conclude that baryons were not strongly involved in shaping the inner dark matter profile.
A transition between a galaxy halo and a cluster halo has been claimed to be detected in the X-ray profile of NGC 1399, the central galaxy of the Fornax cluster (Ikebe et al., 1996). However, this feature could not be found in the kinematics of the GC system (Schuberth et al., 2010). The best fitting dark halos (see Table 6 of Schuberth et al.) are those which use only the metal-rich GCs. These halos have small core radii and clearly are not cosmological. The metal-poor GCs show a more erratic behaviour and indicate halos which are marginally cosmological, but fit worse.
On the other hand, the dark halo of M87, the central galaxy of the Virgo cluster, which is advocated by Côté et al. (2001) (NFW halo, their eq.11), is similar to our halo 4 with , kpc, and c= 2.8.
In conclusion, there is not yet a uniform picture for the halos of nearby central galaxies.
4.4 Extreme velocities
Some GCs and PNe show radial velocities with offsets of about 2700 km/s with respect to the mean cluster velocity. Are such orbits consistent with the halo masses? We consider the most favorable case, namely that these velocities are space velocities near their perigalactica. We adopt halo 2, neglecting stellar and gas masses. Our GC with the lowest velocity (1259 km/s) has a projected distance of 66 kpc from NGC 3311. We use an orbit program kindly provided by M. Fellhauer (private communication) to calculate the apogalactic distance if the perigalactic distance is 66 kpc and the perigalactic velocity is 2465 km/s. The result is an apogalactic distance of 1237 kpc and an orbital period of 2.8 Gyr. These orbits are thus possible, but since it is improbable to pick up an object near its pericenter while its velocity vector points towards the observer, one may expect a larger population of these ‘”intra-cluster” objects with less inclined orbits. These have also been found among GCs in the Fornax (Schuberth et al., 2010, 2008) and Coma (Peng et al., 2011) galaxy clusters. PNe associated with the intra-cluster light in Hydra I have been discussed in Ventimiglia et al. (2008). This is in line with studies finding the contribution of intra-cluster stellar populations to be considerable, e.g. Gonzalez et al. (2007).
5 Conclusions
The core-cusp controversy regarding the inner shape of dark matter halos in galaxies seems to be far from being resolved. Particularly in low surface brightness galaxies, cuspy halos which are predicted by cosmological simulations, do not find support in the observational data (e.g. de Blok 2010, but see Goerdt et al. 2010 for a mechanism of how to transform a cuspy dark matter profile into a cored profile). Therefore, it is of fundamental interest to investigate the more massive halos of galaxy clusters. NGC 3311, the central galaxy in the Hydra I cluster (Abell 1060), appears as an interesting test object due to its low surface brightness which makes dark matter effects better visible.
We use the velocity dispersion profile of the stellar population of NGC 3311 together with 118 radial velocities of bright globular clusters for an attempt to constrain the shape of the dark matter halo. With simplifying assumptions (equilibrium, sphericity, NGC 3311 at rest), we find that cuspy dark matter halos of the NFW type, which obey the relation between concentration and virial mass found in cosmological simulations and which explain the globular cluster velocity dispersion, do not satisfactorily account for the smooth rise of the stellar velocity dispersion at small radii under isotropy. Halos with a core better reproduce the stellar and globular cluster kinematics observed for NGC 3311.
A radial anisotropy, which is frequently observed in elliptical galaxies, aggravates the problem for any kind of halo in that the projected velocity dispersions are boosted and the halo mass becomes too low to account for the globular clusters. Tangential anisotropies (best a fine-tuned radial behaviour) could perhaps provide a solution, but they never have been found observationally neither in dynamical models of galaxies.
With the present analysis, one cannot claim that a cuspy halo of NGC 3311 is ruled out, but a cored dark matter halo seems to be favored.
Our assumptions may be questioned. More sophisticated dynamical modelling on the basis of an extended data set (many more velocities, a better knowledge of the structural parameters of the globular cluster system, and a precise two-dimensional velocity field of the NGC 3311 galaxy light) may find slightly different halos. However, the finding of a core would be in line with other work pointing at shallow dark matter profiles in galaxy clusters (see introduction). Any resolution of the conflict with the standard knowledge of dark matter must work on a very large mass scale from dwarf galaxies (e.g. Gentile et al. 2007) to galaxy clusters. A comparison with other nearby central galaxies does not yet reveal a uniform picture.
The potential of NGC 3311 and other central galaxies with low surface brightness to trace the dark cores of galaxy clusters awaits exciting future work.
Acknowledgements.
We thank an anonymous referee for a thoughtful report and particularly for emphasizing the role of the concentration-mass relation of cosmological halos. We thank Michael Fellhauer for providing his orbit program. TR acknowledges financial support from the Chilean Center for Astrophysics, FONDAP Nr. 15010003, from FONDECYT project Nr. 1100620, and from the BASAL Centro de Astrofisica y Tecnologias Afines (CATA) PFB-06/2007. IM acknowledges support through DFG grant BE1091/13-1. AJR was supported by National Science Foundation grants AST-0808099 and AST-0909237.References
- Bullock et al. (2001) Bullock, J. S., Kolatt, T. S., Sigad, Y., et al. 2001, MNRAS, 321, 559
- Burkert (1995) Burkert, A. 1995, ApJ, 447, L25+
- Cappellari & Emsellem (2004) Cappellari, M. & Emsellem, E. 2004, PASP, 116, 138
- Carter et al. (1999) Carter, D., Bridges, T. J., & Hau, G. K. T. 1999, MNRAS, 307, 131
- Christlein & Zabludoff (2003) Christlein, D. & Zabludoff, A. I. 2003, ApJ, 591, 764
- Côté et al. (2001) Côté, P., McLaughlin, D. E., Hanes, D. A., et al. 2001, ApJ, 559, 828
- de Blok (2010) de Blok, W. J. G. 2010, Advances in Astronomy, 2010
- Diemand et al. (2005) Diemand, J., Zemp, M., Moore, B., Stadel, J., & Carollo, C. M. 2005, MNRAS, 364, 665
- Dirsch et al. (2003) Dirsch, B., Richtler, T., Geisler, D., et al. 2003, AJ, 125, 1908
- Doherty et al. (2009) Doherty, M., Arnaboldi, M., Das, P., et al. 2009, A&A, 502, 771
- Fitchett & Merritt (1988) Fitchett, M. & Merritt, D. 1988, ApJ, 335, 18
- Gentile et al. (2007) Gentile, G., Salucci, P., Klein, U., & Granato, G. L. 2007, MNRAS, 375, 199
- Goerdt et al. (2010) Goerdt, T., Moore, B., Read, J. I., & Stadel, J. 2010, ApJ, 725, 1707
- Gonzalez et al. (2007) Gonzalez, A. H., Zaritsky, D., & Zabludoff, A. I. 2007, ApJ, 666, 147
- Grego et al. (2001) Grego, L., Carlstrom, J. E., Reese, E. D., et al. 2001, ApJ, 552, 2
- Hansen & Moore (2006) Hansen, S. H. & Moore, B. 2006, New A, 11, 333
- Harris et al. (1983) Harris, W. E., Smith, M. G., & Myra, E. S. 1983, ApJ, 272, 456
- Hau et al. (2004) Hau, G. K. T., Hilker, M., Bridges, T., et al. 2004, in IAU Colloq. 195: Outskirts of Galaxy Clusters: Intense Life in the Suburbs, ed. A. Diaferio, 491–495
- Hayakawa et al. (2006) Hayakawa, A., Hoshino, A., Ishida, M., et al. 2006, PASJ, 58, 695
- Ikebe et al. (1996) Ikebe, Y., Ezawa, H., Fukazawa, Y., et al. 1996, Nature, 379, 427
- Kelson et al. (2002) Kelson, D. D., Zabludoff, A. I., Williams, K. A., et al. 2002, ApJ, 576, 720
- Kormendy & Djorgovski (1989) Kormendy, J. & Djorgovski, S. 1989, ARA&A, 27, 235
- Łokas et al. (2006) Łokas, E. L., Wojtak, R., Gottlöber, S., Mamon, G. A., & Prada, F. 2006, MNRAS, 367, 1463
- Loubser et al. (2008) Loubser, S. I., Sansom, A. E., Sánchez-Blázquez, P., Soechting, I. K., & Bromage, G. E. 2008, MNRAS, 391, 1009
- Macciò et al. (2008) Macciò, A. V., Dutton, A. A., & van den Bosch, F. C. 2008, MNRAS, 391, 1940
- Mamon et al. (2006) Mamon, G. A., Łokas, E., Dekel, A., Stoehr, F., & Cox, T. J. 2006, in EAS Publications Series, Vol. 20, EAS Publications Series, ed. G. A. Mamon, F. Combes, C. Deffayet, & B. Fort, 139–148
- Mamon & Łokas (2005) Mamon, G. A. & Łokas, E. L. 2005, MNRAS, 363, 705
- McLaughlin et al. (1995) McLaughlin, D. E., Secker, J., Harris, W. E., & Geisler, D. 1995, AJ, 109, 1033
- McNeil et al. (2010) McNeil, E. K., Arnaboldi, M., Freeman, K. C., et al. 2010, A&A, 518, A44+
- Mieske et al. (2005) Mieske, S., Hilker, M., & Infante, L. 2005, A&A, 438, 103
- Mieske et al. (2009) Mieske, S., Hilker, M., Misgeld, I., et al. 2009, A&A, 498, 705
- Misgeld et al. (2008) Misgeld, I., Mieske, S., & Hilker, M. 2008, A&A, 486, 697
- Navarro et al. (2004) Navarro, J. F., Hayashi, E., Power, C., et al. 2004, MNRAS, 349, 1039
- Newman et al. (2011) Newman, A. B., Treu, T., Ellis, R. S., & Sand, D. J. 2011, ApJ, 728, L39+
- Newman et al. (2009) Newman, A. B., Treu, T., Ellis, R. S., et al. 2009, ApJ, 706, 1078
- Paolillo et al. (2002) Paolillo, M., Fabbiano, G., Peres, G., & Kim, D. 2002, ApJ, 565, 883
- Peng et al. (2011) Peng, E. W., Ferguson, H. C., Goudfrooij, P., et al. 2011, ArXiv e-prints
- Pryor & Meylan (1993) Pryor, C. & Meylan, G. 1993, in Astronomical Society of the Pacific Conference Series, Vol. 50, Structure and Dynamics of Globular Clusters, ed. S. G. Djorgovski & G. Meylan, 357–+
- Richtler et al. (1992) Richtler, T., Grebel, E. K., Domgoergen, H., Hilker, M., & Kissler, M. 1992, A&A, 264, 25
- Romanowsky et al. (2009) Romanowsky, A. J., Strader, J., Spitler, L. R., et al. 2009, AJ, 137, 4956
- Sánchez-Blázquez et al. (2006) Sánchez-Blázquez, P., Peletier, R. F., Jiménez-Vicente, J., et al. 2006, MNRAS, 371, 703
- Sand et al. (2008) Sand, D. J., Treu, T., Ellis, R. S., Smith, G. P., & Kneib, J. 2008, ApJ, 674, 711
- Sand et al. (2004) Sand, D. J., Treu, T., Smith, G. P., & Ellis, R. S. 2004, ApJ, 604, 88
- Schlegel et al. (1998) Schlegel, D. J., Finkbeiner, D. P., & Davis, M. 1998, ApJ, 500, 525
- Schuberth et al. (2008) Schuberth, Y., Richtler, T., Bassino, L., & Hilker, M. 2008, A&A, 477, L9
- Schuberth et al. (2010) Schuberth, Y., Richtler, T., Hilker, M., et al. 2010, A&A, 513, A52+
- Tortora et al. (2010) Tortora, C., Napolitano, N. R., Romanowsky, A. J., & Jetzer, P. 2010, ApJ, 721, L1
- Ventimiglia et al. (2008) Ventimiglia, G., Arnaboldi, M., & Gerhard, O. 2008, Astronomische Nachrichten, 329, 1057
- Ventimiglia et al. (2011) Ventimiglia, G., Arnaboldi, M., & Gerhard, O. 2011, ArXiv e-prints
- Ventimiglia et al. (2010) Ventimiglia, G., Gerhard, O., Arnaboldi, M., & Coccato, L. 2010, A&A, 520, L9+
- Wehner et al. (2008) Wehner, E. M. H., Harris, W. E., Whitmore, B. C., Rothberg, B., & Woodley, K. A. 2008, ApJ, 681, 1233
- Yamasaki et al. (2002) Yamasaki, N. Y., Ohashi, T., & Furusho, T. 2002, ApJ, 578, 833