Near-Infrared properties of the X-ray emitting young stellar objects in the Carina Nebula
Abstract
The Great Nebula in Carina (NGC 3372) is the best target to study in detail the process of violent massive star formation and the resulting feedback effects of cloud dispersal and triggered star formation. While the population of massive stars is rather well studied, the associated low-mass stellar population was largely unknown up to now. The near-infrared study in this paper builds on the results of the Chandra Carina Complex Project (CCCP), that detected 14 368 X-ray sources in the 1.4 square-degree survey region, an automatic source classification study that classified 10 714 of these X-ray sources as very likely young stars in Carina, and an analysis of the clustering properties of the X-ray selected Carina members. In order to determine physical properties of the X-ray selected stars, most of which were previously unstudied, we used HAWK-I at the ESO VLT to conduct a very deep near-IR survey with sub-arcsecond angular resolution, covering an area of about 1280 square-arcminutes. The HAWK-I images reveal more than 600 000 individual infrared sources, whereby objects as faint as , , and are detected at S/N . While less than half of the Chandra X-ray sources have counterparts in the 2MASS catalog, the mag deeper HAWK-I data reveal infrared counterparts to 6636 (= 88.8%) of the 7472 Chandra X-ray sources in the HAWK-I field. We analyze near-infrared color-color and color-magnitude diagrams to derive information about the extinctions, infrared excesses (as tracers for circumstellar disks), ages, and masses of the X-ray selected objects. The near-infrared properties agree well with the results of the automatic X-ray source classification, showing that the remaining contamination in the X-ray selected sample of Carina members is very low (). The shape of the -band luminosity function of the X-ray selected Carina members agrees well with that derived for the Orion Nebula Cluster, suggesting that, down to the X-ray detection limit around , the shape of the IMF in Carina is consistent with that in Orion (and thus the field IMF). The fraction of stars with near-infrared excesses is rather small, , but shows considerable variations between individual parts of the complex. The distribution of extinctions for the diskless stars ranges from mag to mag (central 80th percentile), clearly showing a considerable range of differential extinction between individual stars in the complex.
1 Introduction
The Great Nebula in Carina (NGC 3372; see Smith & Brooks, 2008, for an overview) is the best galactic analog of giant extragalactic H II and starburst regions and a superb location to study the physics of violent massive star formation and the resulting feedback effects, including cloud dispersal and triggered star formation. At a distance of 2.3 kpc (Smith, 2002), it represents the nearest southern region with a large massive stellar population (65 O-type stars; see Smith, 2006). Among these are several of the most massive and luminous stars known in our Galaxy, most notably the famous Luminous Blue Variable Car. Most of these very massive stars reside in the clusters Tr16, Tr 14, and Tr 15, for which ages between 1 and several Myr have been estimated.
In the past, the Carina Nebula was usually considered to be just an evolved HII region, devoid of active star formation. However, new sensitive observations have changed this view drastically during recent years. The region contains more than of gas and dust (see Yonekura et al., 2005; Smith & Brooks, 2007; Preibisch et al., 2011a), and deep infrared observations showed clear evidence of ongoing star formation in these clouds. Several very young stellar objects (Megeath et al., 1996; Mottram et al., 2007) and a spectacular young embedded cluster (the “Treasure Chest Cluster”; see Smith et al., 2005) have been found in the molecular clouds, a deep HST H imaging survey revealed dozens of jet-driving young stellar objects (Smith et al., 2010a), and Spitzer surveys located numerous embedded protostars throughout the Carina complex (Smith et al., 2010b; Povich et al., 2011a). The formation of these young stars was probably triggered by the advancing ionization front, and thus a substantial population of very young, partly embedded stars seems to be present.
While the unobscured population of high-mass stars in the Carina Nebula Complex (= CNC hereafter) is rather well known and characterized (Smith, 2006), the much fainter low-mass stellar population remained largely unexplored until now. However, a good knowledge of the low-mass stellar content is essential for any determination of the global properties of this region, which are the key towards understanding the star formation process in the CNC. Important topics, for which the low-mass stellar population plays a crucial role, include the initial mass function (IMF) (e.g., Bastian et al., 2010) of the region, the star formation history (e.g., Briceno et al., 2007), and the effects of the feedback from the numerous massive stars on the formation and evolution of low-mass stars and their protoplanetary disks (e.g., Whitworth & Zinnecker, 2004; Throop & Bally, 2005).
The obvious first step of any study of the low-mass stellar population is the identification of the individual low-mass stars. However, this is quite a difficult task in the case of the CNC for several reasons. First, due to its location very close to the galactic plane () and near the tangent point of a spiral arm, any optical and infrared observations of the CNC suffer from extremely strong field star contamination and confusion problems. Second, these problems are amplified by the strongly variable and highly position dependent pattern of cloud extinction across the CNC, that ranges from mag at some positions up to mag only a few arcminutes away (Rowles & Froebrich, 2009). The dark clouds in the CNC thus do not serve as an opaque111Since the maximum extinction of mag corresponds to only mag in the near-infrared, the clouds are mostly transparent for wavelengths m. “screen” that would hide the background sources, but rather introduce a complicated pattern of strong variations in the extinction of the individual complex members as well as the background objects seen through these clouds. Third, strong and complex nebular emission (in particular H in the optical and Br in the -band) is present from interstellar gas ionized by the CNC OB stars. Furthermore, due to the relatively large distance, the low-mass stars are relatively faint, making an individual spectroscopic identification of young low-mass stars (e.g. by their Lithium lines or gravity-sensitive lines; see, e.g., Preibisch et al., 2002; Slesnick et al., 2008) unfeasible.
Until recently, essentially all of the few known young low-mass stars in the CNC were identified by infrared excess emission (e.g., Ascenso et al., 2007), which is a tracer of circumstellar material surrounding young stellar objects. However, there are (at least) two problems with excess-selected samples: First, from studies of other regions it is well known that infrared excess emission in young stars disappears on timescales of just a few Myr (e.g., Briceno et al., 2007); at an age of Myr only of the young stars still show near-infrared excesses, and by Myr this is reduced to . Since the expected ages of most young stars in the CNC are a few Myr, any excess-selected sample will be highly incomplete. On the other hand, excess-selected samples can be strongly contaminated by background sources, since evolved Be stars, carbon stars, planetary nebulae, star-forming galaxies, and AGN can show near-infrared excesses very similar to those of young stars (e.g., Mentuch et al., 2009; Oliveira et al., 2009; Rebull et al., 2010). This background contamination is particularly strong in Carina due to its position at the galactic plane and the moderate level of cloud extinction. These two factors strongly limit the usefulness of a near-infrared excess selected sample of young stars in the case of the CNC.
Sensitive X-ray observations can provide a very good solution of this problem, since one can detect the young stars by their strong X-ray emission (e.g., Feigelson et al., 2007) and efficiently discriminate them from the numerous older field stars in the survey area. X-rays are equally sensitive to young stars which have already dispersed their circumstellar disks, thus avoiding the bias introduced when selecting samples based only on infrared excess. Many X-ray studies of star forming regions have demonstrated the success of this method (see, e.g., Preibisch & Zinnecker, 2002; Broos et al., 2007; Forbrich & Preibisch, 2007; Wang et al., 2010). Also, the relations between the X-ray properties and basic stellar properties in young stellar populations are now very well established from very deep X-ray observations such as the Chandra Orion Ultradeep Project (COUP) (see Feigelson et al., 2005; Preibisch et al., 2005; Preibisch & Feigelson, 2005).
Although the CNC has been observed with basically all X-ray observatories of the last few decades, only the Chandra X-ray Observatory has good enough angular resolution () to allow a proper identification of the individual X-ray sources in such a crowded region. The basis of the study presented in this paper are the results of a wide-field X-ray survey performed in the Chandra Carina Complex Project (CCCP). General aspects of this survey and the resulting X-ray data are described in full detail in Townsley et al. (2011a) and Broos et al. (2011a). While these Chandra data provide an unbiased (although luminosity-limited) sample of the young stars in the region, the X-ray data alone do not yield much information about the properties of the individual stars. For these purposes, deep optical or near-infrared data are fundamentally required in order to determine key stellar parameters including mass, age, and circumstellar disk properties. Numerous optical and infrared observations exist already (see, e.g., Smith, 1987; Kaltcheva & Georgiev, 1993; DeGioia-Eastwood et al., 2001; Tapia et al., 2003), but they are either too shallow to detect the low-mass stellar populations, or cover only relatively small parts of the complex (see, e.g., Sanchawala et al., 2007; Smith et al., 2004; Ascenso et al., 2007). This was the motivation for our new deep wide-field near-infrared survey of the CNC discussed in this paper.
In this paper we briefly summarize basic results of the X-ray observations (Sect. 2), describe the near-infrared observations (Sec. 3), use the near-infrared data to identify infrared counterparts of the X-ray sources (Sec. 4), determine key properties of the X-ray selected young stellar populations in the CNC (Sec. 5), and finally draw conclusions about the star formation process in the CNC (Sect. 6).
2 Basic results on the CNC X-ray sources from the CCCP
The Chandra Carina Complex Project (CCCP) has mapped the CNC with a mosaic of 22 individual ACIS-I pointings, each with an exposure time of ksec ( hours). A complete overview of the project can be found in Townsley et al. (2011a). Data analysis followed procedures described by Broos et al. (2010). After extensive source detection efforts, a final merged list of 14 368 individual X-ray sources222Note that (as described in more detail in Townsley et al., 2011a) the star Car, which is a very strong X-ray source, is not included in the CCCP source list, because it is so bright that it caused very strong pileup in our Chandra data. Car is therefore not considered in the analysis of this paper. was compiled (Broos et al., 2011a). As in any X-ray observation, there must be some degree of contamination by foreground stars as well as by background stars and extragalactic sources (see Getman et al., 2011). Since these different kinds of contaminants have different typical X-ray, optical, and infrared properties, a statistical approach was used to compute the probability that, based on its individual source properties, a given X-ray source is a member of the CNC or one of three different contaminant classes. The results of this classification, which is described in full detail in Broos et al. (2011b), are as follows: 716 X-ray sources are classified as very likely foreground stars (class = H1), 16 as very likely galactic background stars (class = H3), 877 X-ray sources as very likely extragalactic (AGN) contaminants (class = H4), and 10 714 X-ray sources are classified as very likely young stars in the CNC (class = H2). Finally, the classification remained ambiguous for a total of 2045 X-ray sources; these sources are denoted as “unclassified”. It should be noted that, due to the statistical nature of this analysis, these classifications do not provide final evidence about the physical nature of the individual X-ray sources. The review of these classifications by Broos et al. (2011b) suggested that among the very weak X-ray sources classified as likely Carina members there may still be a small degree of contamination by foreground stars and AGN (see Sect. 5.4); on the other hand, some fraction of the unclassified X-ray sources may in fact be young stars in the CNC.
Feigelson et al. (2011) studied the spatial distribution and the clustering properties of the X-ray sources classified as likely Carina members. They identified 20 principal clusters of X-ray stars (most of which correspond to known optical clusters in the CNC), 31 small groups of X-ray stars outside the major clusters, and a widely dispersed, but highly populous, distribution of more than 5000 X-ray stars.
The well established correlation between X-ray luminosities and bolometric luminosities of young stars (see Preibisch et al., 2005; Telleschi et al., 2007) leads to correlations between the near-infrared magnitudes and the X-ray fluxes (or source count rates) that can be used to infer the expected NIR magnitudes for the Chandra X-ray sources detected in the CNC. The observed correlations in the Orion/COUP data (Preibisch et al., 2005) predict that the weakest detected X-ray sources in the Carina mosaic should have near-infrared magnitudes in the range and (quoted ranges are 90th percentiles). Comparing these values to the nominal 2MASS Survey completeness limits for crowded locations near the galactic plane, i.e. and (Skrutskie et al., 2006), it follows that a substantial fraction of the X-ray sources is expected to remain undetected in the 2MASS data. This expectation is confirmed when considering the results of the matching of X-ray source positions to the 2MASS catalog (Broos et al., 2011a): only 6194 () of the 14 368 X-ray sources have valid counterparts in the 2MASS catalog. Furthermore, many of these 2MASS matches have upper magnitude limits in one or more bands; just 4502 of these 2MASS matches have valid -, -, and -band photometry. The fact that 68.7% of the X-ray sources have no or incomplete NIR photometry from 2MASS clearly illustrates the need for a much deeper near-infrared survey of the CNC.
3 HAWK-I Observations of the Carina Nebula Complex
3.1 Observations and data analysis
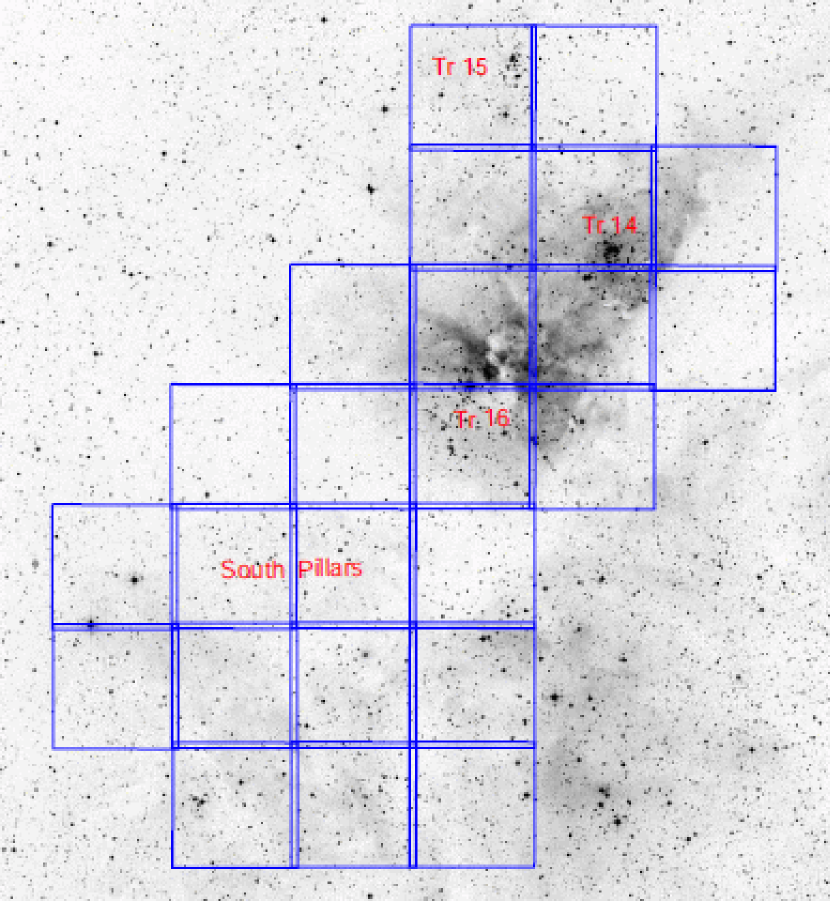
HAWK-I (see Kissler-Patig et al., 2008) is the new near-infrared imager at the ESO 8 m Very Large Telescope, available since the year 2008. It is equipped with a mosaic of four Hawaii 2RG pixel detectors with a scale of per pixel. The camera has a field of view on the sky of with a small cross-shaped gap of between the four detectors. The observations of the CNC were performed from 24 to 31 January 2008 in service mode as part of the scientific verification program for HAWK-I. The observing conditions were generally good, with a typical seeing of (FWHM). The data discussed in this paper are derived from images taken through the standard broadband , , and filters. Our survey consists of a mosaic of 24 contiguous HAWK-I fields (see Fig. 1) covering a total area of about 1280 square-arcminutes; it includes the central part of the Nebula with Car and Tr 16, the clusters Tr 14 and Tr 15, and large parts of the South Pillars region. A full description of the HAWK-I data will be given in Preibisch et al. (2011b).
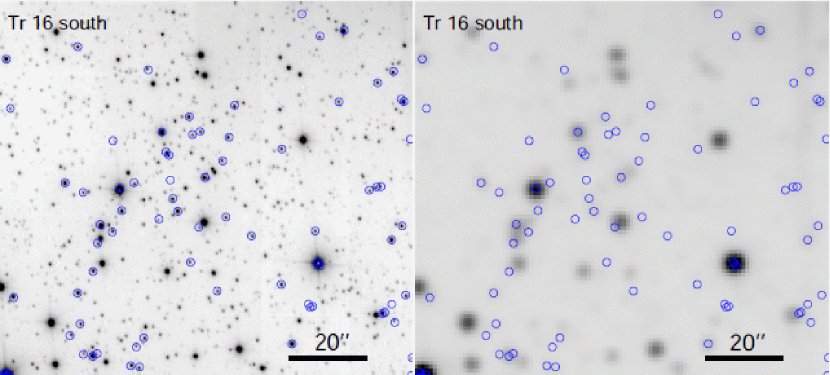
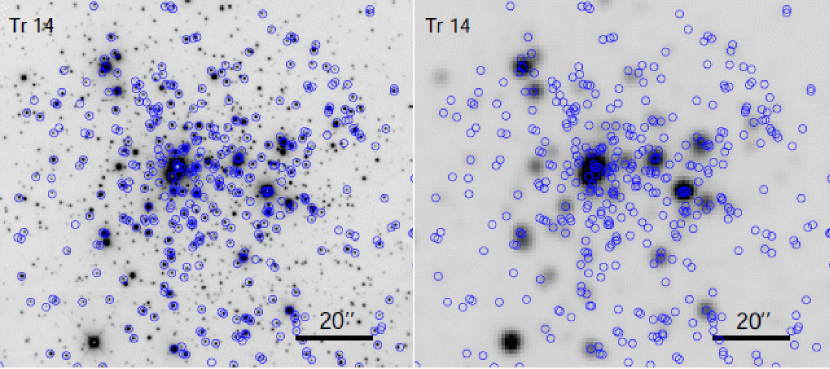
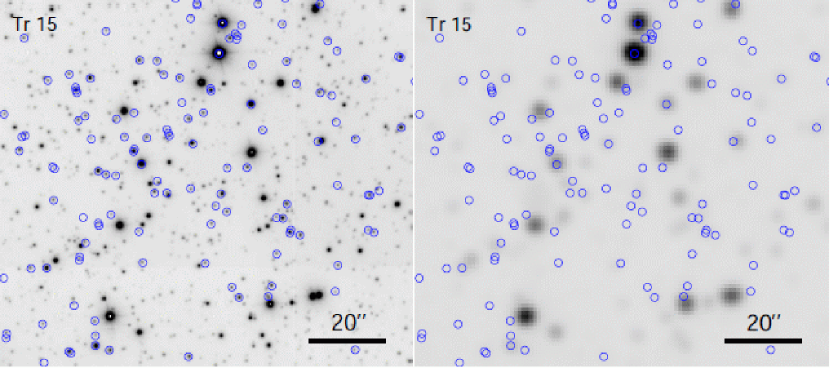
The aim of the HAWK-I survey was to detect the full stellar population through extinctions of mag simultaneously in the -, -, and -band. With magnitude limits of , , and , all stars with masses down to and an age of 3 Myr should be detectable according to the pre-main-sequence models of Baraffe et al. (1998). The required exposure times for S/N=10 detections are 12, 8, and 5 minutes in , , and . We used a 5-point dither pattern with steps and took co-added images with detector integration times of 3 seconds at each mosaic position. As examples, we show in Fig. 2 HAWK-I images of three selected regions of the mosaic and compare them to the corresponding 2MASS images.
All HAWK-I data were processed and calibrated by the Cambridge Astronomical Survey Unit using pipeline software originally designed for the analysis of the UKIRT Infrared Deep Sky Survey (see Irwin et al., 2004). After the initial standard reduction steps for each individual image, the dithered images of each mosaic position were stacked together, thereby “removing” the gaps between the four infrared arrays. After the automatic detection of point-like sources in the images (see Irwin, 1985) the source extraction software measured aperture photometry for each detected source. The photometric analysis and calibration followed closely the procedures described in detail in Hodgkin et al. (2009). The photometric calibrators are drawn from stars in the 2MASS Point Source Catalog, which are present in large numbers (several hundred) in each HAWK-I mosaic field.
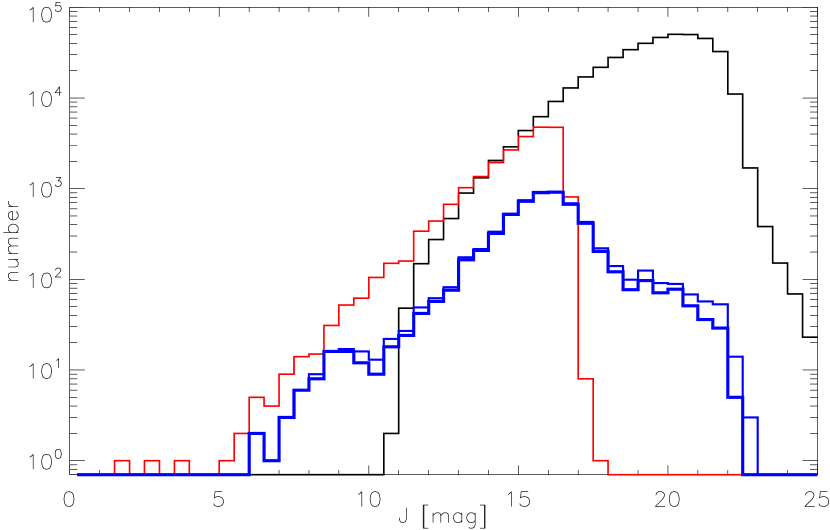
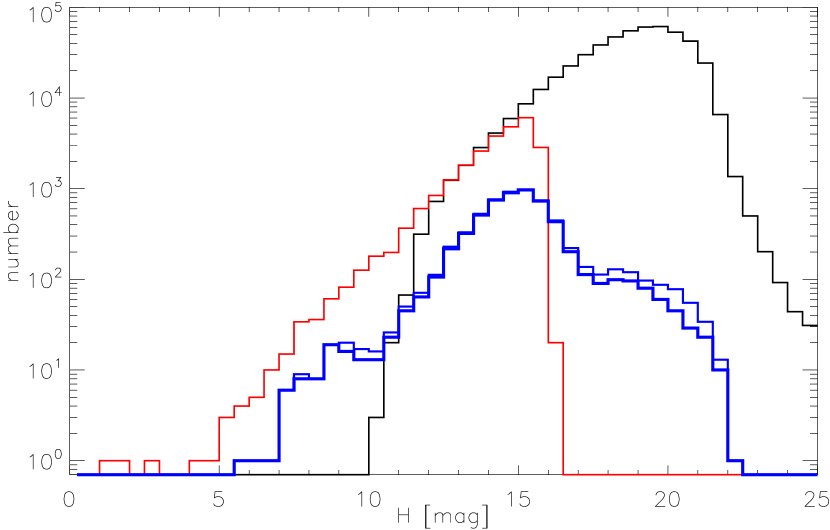
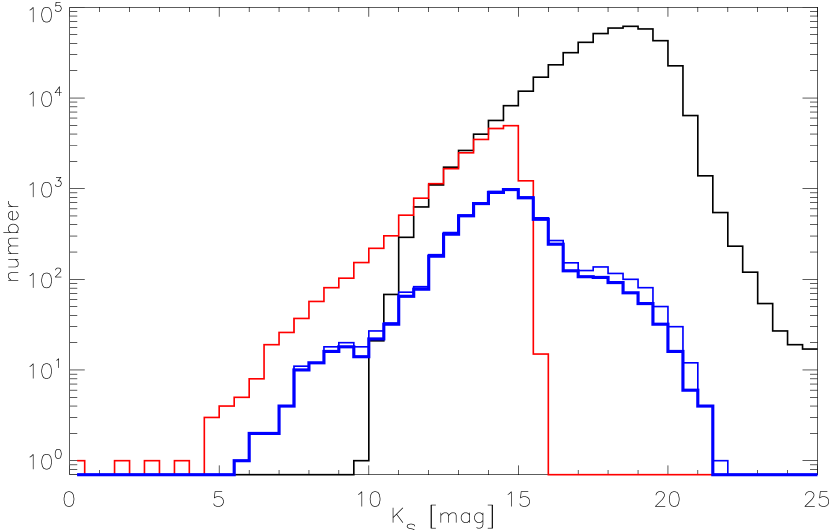
Objects as faint as , , and are detected with S/N . However, since significant parts of the CNC are pervaded by very strong and highly variable diffuse emission that reduces the local source detection sensitivity, it is not possible to determine a strict and unique value for a completeness limit valid for the full area of the HAWK-I survey. An estimate for the “typical” completeness limit (i.e. the limit above which we can expect most objects in the survey area to be detected) can be derived from the histograms of the magnitudes333Although the turnover in the source count curves is not a formal measure of completeness, it can serve as a proxy to show the typical values of the completeness limit across the field. (see Fig. 3) and yields , , and . Nearly all objects above these limits are S/N detections.
The total number of detected objects is highest in the -band images and smaller in the -band (mainly due to extinction) and in the -band (mainly due to the strong diffuse nebulosity). Finally, a merged HAWK-I photometric catalog was generated from the source lists of all 24 mosaic positions and all three photometric bands; duplicates from the overlap regions between the individual mosaic positions were removed by keeping the catalog entry with the highest signal-to-noise ratio.
3.2 The HAWK-I source catalog
The final HAWK-I photometric catalog contains 600 336 individual objects. This is about 20 times more than the number of 2MASS sources in the area of the HAWK-I mosaic (29 218). Most (502 714) catalog objects are simultaneously detected in the -, -, and the -band. Since the main aim of the HAWK-I study was to detect the faintest possible objects, the catalog contains numerous very weak objects close to the detection limit, some of which may be spurious false-detections. However, the objects that are detected independently in all three NIR bands are very likely real detections. The significance of the infrared source detection can be quantified by the formal photometric uncertainties444What we denote as “formal photometric uncertainties” are errors reported by the photometry software. In addition to these random errors, the total photometric uncertainty also includes systematic error components in the HAWK-I data and calibration errors, as discussed below. in the following way: the magnitude limits below which more than 90% of the listed sources have formal photometric uncertainties less than 0.1 mag (corresponding approximately to detections) are , , and . On the other hand, the magnitude limits above which more than 90% of the listed sources have formal photometric uncertainties larger than 0.3 mag (corresponding approximately to detections) are , , and .
Finally, we checked the integrity of the derived photometric data in the HAWK-I catalog by comparing the HAWK-I and 2MASS photometry for a carefully selected sample of stars that are (1) detected with S/N in 2MASS, (2) faint enough to avoid saturation problems in the HAWK-I data, (3) isolated enough to have no other infrared source in the HAWK-I images within , and (4) have formal photometric uncertainties of mag in each band. For the 714 stars in this sample we determined the standard deviations between HAWK-I and 2MASS magnitudes and colors. Applying “-clipping” to remove obvious outliers, we found mag, mag, mag, mag, and mag. This level of accuracy appears quite reasonable if we consider the numerous sources of uncertainties. Firstly, the accuracy of the photometric calibration is naturally limited by the photometric quality of 2MASS. The mean photometric errors listed for the 2MASS stars suitable for calibration are mag, mag, and mag. Therefore, a large part of the total photometric uncertainties originates from the 2MASS data. Secondly, we are dealing here with a wide-field mosaic of a region pervaded by strong and highly variable diffuse nebulosity, that was observed during a number of nights with slightly variable conditions. Thirdly, we note that the accuracy to which such a dataset can be photometrically calibrated is limited by a number of effects, including variations in the pixel spatial scale across the camera, geometrical/optical effects such as vignetting, non-uniformity in the flat illumination, chip-to-chip quantum-efficiency color effects, non-linearities in the detectors, and color differences in the illumination of the flats and the average astronomical objects. Although each of these effects is quite small, their combination will undoubtedly cause systematic spatial photometry effects at the level of several percent, particularly around the edges of the detectors. In our data set, such spatial effects seem to produce systematic uncertainties at levels of up to mag. Although this would be problematic if one would try to use color-selection criteria to define samples of young stars, it is a much less serious problem for our analysis of the X-ray selected sample of objects. For the present study, this level of photometric accuracy is sufficient for our scientific purposes.
3.3 Background contamination in the HAWK-I catalog
Although we can expect that our HAWK-I data detect essentially all young stars in the survey area, these infrared data alone do not allow reliable distinction of young stars from the numerous background objects. Simple extrapolations, based on the known population of high-mass stars in the CNC, show that most of the objects in the HAWK-I catalog must be background sources, unrelated to the CNC. Smith & Brooks (2007) estimate that the total stellar population of the CNC consists of about 65 000 stars. About 40 000 of these should be located in the HAWK-I field-of-view. This suggests that the vast majority () of the detected infrared sources in our HAWK-I catalog must be foreground or background sources. This estimate agrees well with the results from Povich et al. (2011a), who found that 93.4% of all infrared sources seen by Spitzer in the CNC are probably unrelated field stars. Considering the above described problems with infrared-excess selected samples of young stars, we conclude that the HAWK-I data alone can yield only very limited insight into the young stellar populations in the CNC; only a combination of X-ray and infrared data can yield a reasonably clean and complete sample of young stars.
4 Infrared counterparts of the X-ray sources
4.1 Catalog matching
We employed the method described by Broos et al. (2011a), that uses positional uncertainties for individual sources plus a match significance threshold, to match the X-ray and infrared catalogs in the CNC. In the first stage, the algorithm tests the hypothesis that a possible pair of sources from the two catalogs is spatially coincident. The most significant match of each master source is referred to as its “Primary Match”; any other significant matches are “Secondary Matches”. The second stage of the algorithm resolves possible many-to-one and one-to-many relationships between the X-ray “master catalog” and the infrared “slave catalog”. Clear one-to-one relationships are classified as “successful primary matches”, while in cases where, e.g., two master sources are significantly close to a single slave source, the less significant primary match is labeled as “failed”. This finally provides a reasonable one-to-one set of matches. We point out that no source-matching method can produce 100% perfect results; both false negative (true physical associations that are missed) and false positive (unphysical associations that are listed) are likely present, but their numbers should be quite small.
The area of the HAWK-I mosaic covers 27% of the area of the Chandra survey and contains 52% (7472) of all 14 368 Chandra sources. Only 3620 (48.4%) of these 7472 Chandra sources in the HAWK-I field have successful primary matches with 2MASS counterparts, and just 2534 (33.9%) have valid - and - and -band photometry from 2MASS. The matching of the Chandra X-ray catalog to the HAWK-I infrared catalog improves these numbers substantially: For 6583 of the 7472 Chandra sources in the HAWK-I field successful primary matches are found. Among these are 3016 Chandra sources that had no 2MASS matches. The matching with our HAWK-I catalog increases the number of known infrared counterparts to the Chandra sources in the HAWK-I field to 6636 (88.8%), nearly two times more than based on the 2MASS catalog alone.
In the probabilistic source classification described in Broos et al. (2011b), 6173 (93.0%) of these 6636 X-ray sources with infrared counterparts are classified likely Carina members, 131 (2.0%) as likely foreground stars, none (0%) as likely background stars, 66 (1.0%) as likely AGN, and 266 (4.0%) remain unclassified.
For 836 (11.1%) of all X-ray sources in the HAWK-I field no matching infrared counterpart is found in the HAWK-I catalog. 31 (3.7%) of these are classified as likely foreground stars, 626 (74.7%) as likely Carina members, none (0%) as likely background stars, 41 (4.9%) as likely AGN, and 138 (16.6%) remain unclassified. In about half of these cases, a visual inspection of the HAWK-I images shows no perceptible infrared source at the X-ray source position. Besides extragalactic sources that are extremely faint in the near-infrared, some X-ray detected young stars in the CNC may remain undetected in the HAWK-I data due to very strong extinction555 A star with an age of 3 Myr should have ; for mag such a star would be fainter than the typical completeness limit of the HAWK-I data and might be undetected in the near-infrared. In the X-ray band, however, young stellar objects with optical extinctions of several hundred magnitudes have been detected, (see, e.g. Grosso et al., 2005). or because of very strong local nebulosity. Finally, in some cases, the X-ray source may be spurious; we note that 242 (28.9%) of the 836 X-ray sources in HAWK-I field without infrared match have net counts in the Chandra data. In the other half of these cases, an infrared source is seen close (within ) to the X-ray source position, but just outside the matching region. Some of them may be ”false negative” rejections of physical matches. We decided not to add matches “by hand” in such cases, in order to keep the matching as objective as possible.
4.2 Secondary matches
A substantial number (1184 of 6583, i.e. 18%) of the Chandra sources in the HAWK-I field with infrared matches have more than one possible counterparts within the search radius. Any of these matches qualifies as a counterpart to the X-ray source, and thus we have to decide which of these matches (the primary match or one of the secondary matches) we consider to be the most likely true counterpart. In the automatic source matching, this decision is purely based on the angular separation between the positions of the X-ray sources and the possible matches. This is a reasonable choice in the absence of further information, but may, of course, not always be correct. Due to the very high density of very faint objects in the HAWK-I catalog, some of the matches with very faint infrared sources may in fact be chance superpositions of physically unrelated sources, and one of the “secondary matches” may be the true counterpart.
We note that some a-priori information about the likely nature of the X-ray sources is actually available and can be used as a guide for this decision. Since we are looking at a star forming region, we can clearly expect that many of the X-ray sources are young stars in Carina, most of which should be relatively bright infrared sources. The statistical analysis of possible X-ray contaminants (Getman et al., 2011) actually shows that the number of expected infrared-faint background (stellar and extragalactic) contaminants is much smaller than the number of detected X-ray sources. Thus, a given X-ray source in the Carina Nebula is a-priori more likely to be a young star than a background object. This is relevant for cases where the primary match of an X-ray source is a very faint infrared source (especially if it is below the expected infrared brightness for X-ray detected Carina members, i.e. ) and a significantly brighter secondary match is present. In these cases, the brighter secondary match can be more likely to be the true physical counterpart to the X-ray source666 The following “Gedankenexperiment” may illustrate the situation: imagine that we are searching for the counterpart of a specific X-ray source in a sequence of deeper and deeper infrared images, and assume that the nth image in the sequence reveals the true physical counterpart of the X-ray source. Due to the unavoidable uncertainties of the position determinations, the angular offset between the X-ray and infrared positions is not exactly zero but some (small) fractions of the search radius. The subsequent, deeper infrared images will detect an ever increasing number of very faint infrared sources. It will thus get more and more likely that one of these very faint infrared sources falls randomly very close to the X-ray source position and edges out the true physical match with the brighter infrared source. The frequency of unphysical random matches depends on the number density of the faint infrared sources, i.e. increases strongly with the depth of the data set used for X-ray source matching. It is very low for typical medium-deep data (such as 2MASS), but increases strongly for very deep infrared data such as our HAWK-I survey. .
A statistical estimate of how often one of the very numerous very faint infrared sources should fall randomly into the match region of an X-ray source and thus might displace an otherwise perfectly valid match with a brighter infrared source, can be made as follows: The HAWK-I catalog contains 250 790 very faint sources with in the 1280 square-arcmin field, i.e. the mean number of these faint sources is 0.051 per square-arcsecond. Since the median X-ray error circle radius is (see Broos et al., 2011a), Poisson statistics shows that the probability to have one or more purely random match with such very faint infrared sources is 0.017. We thus expect that about 130 of the 7472 X-ray sources in the HAWK-I field should have one or more unphysical random matches with very faint infrared sources.
This estimate is in good agreement with the results of the source matching: For 115 Chandra sources one of the secondary matches is brighter (in the -band) than the primary match. Since there is a high probability that these very faint primary matches are unphysical random associations, we performed a detailed visual inspection of these sources. We found 74 cases where one of the secondary matches is considerably brighter than the very faint primary match, and its position is very well consistent with that of the X-ray source; in these cases, we replaced the original very faint primary match by this brighter secondary match. The remaining cases were unclear: often, the X-ray sources are located just between two similarly bright infrared sources, only marginally closer to the slightly fainter source. In these unclear cases, we kept the identification with the primary match.
To conclude the justification for this procedure, we note that if we would have used less deep infrared images (such as the 2MASS data) for the identification of the X-ray sources, the very faint primary matches (some of which we have deleted) would not have been detected and thus the brighter secondary match (which we prefer in some cases) would have been regarded as the primary match from the beginning.
4.3 Final selection of NIR magnitudes for the Chandra sources
For our final infrared counterpart catalog we generally preferred the HAWK-I magnitudes. The 2MASS magnitudes were used for 360 X-ray sources, including bright objects that are above or close to the expected saturation limit of the HAWK-I images, and cases where an X-ray source has a valid 2MASS match and its HAWK-I match is very faint777The justification for this is analogous to the arguments given in Sect. 4.2 ().
The central region of the dense cluster Tr 14 requires special attention. The stellar density there is so high that even our HAWK-I images are affected by crowding and source blending, which may lead to unreliable photometry for some objects. Ascenso et al. (2007) imaged a area centered on the cluster core with the near-infrared adaptive optics instrument NACO. With an angular resolution of these AO images resolved the cluster core and allowed them to derive -, -, -photometry for about 180 stars in their field-of-view. Matching the Chandra catalog to the NACO source table (Broos et al., 2011a) yields 54 successful primary matches, 45 of which have NACO photometry in all three bands. We therefore used the NACO photometry for these 45 Chandra source matches in the center of Tr 14 instead of the 2MASS or HAWK-I photometry. This yields -, -, -photometry for 8 X-ray sources that had neither 2MASS nor HAWK-I counterparts.
In our final combined catalog, which is given in Table 1, 6241 X-ray sources in HAWK-I field have valid photometry in all three -, -, and -bands.
5 Results
5.1 Infrared magnitudes of the X-ray sources
In Fig. 3 we compare histograms of the infrared magnitudes of all 2MASS and HAWK-I sources in the HAWK-I field to those of the X-ray selected sources in this area. The peak of X-ray selected sources is at , , and . This agrees well with the expected NIR magnitudes of the faintest detectable X-ray sources discussed above. A few hundred X-ray sources have very faint infrared counterparts with magnitudes ; many of these are likely (extragalactic) background contaminants, but some may be flaring very low-mass stars or deeply embedded young stellar objects.
5.2 Near-infrared excesses of the X-ray sources
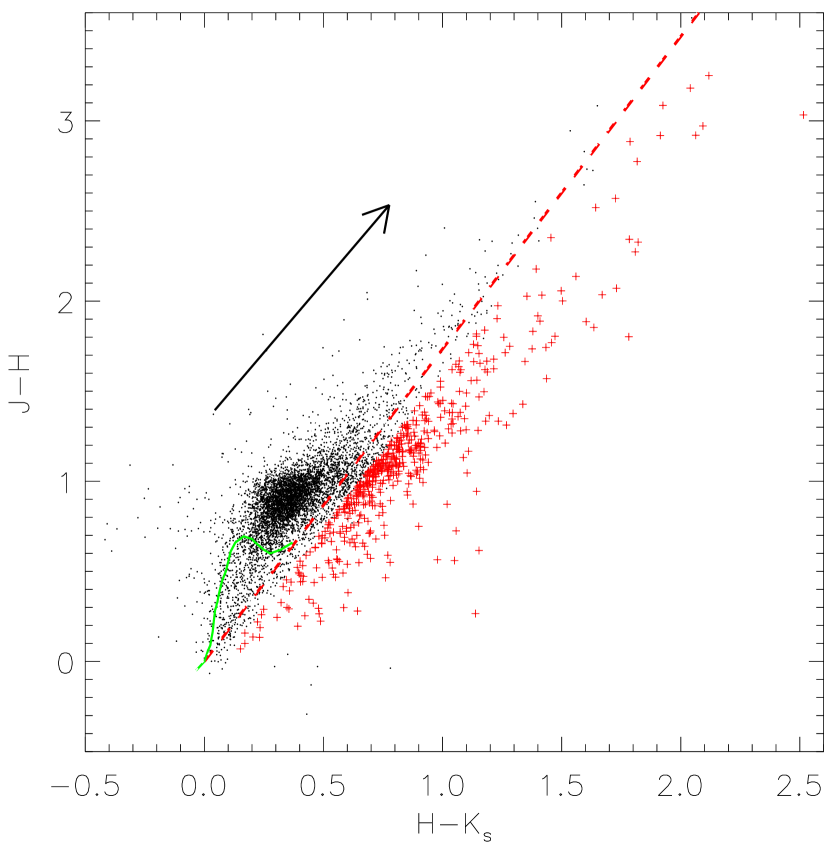
In Fig. 4 we show the vs. color-color diagram for the X-ray selected sources. We find that 485 of the 6241 X-ray sources in HAWK-I field with valid photometry in the -, -, and -band show near-infrared excess. The global excess fraction of the X-ray selected sample of infrared sources in HAWK-I field is thus .
In order to compare the excess fraction to other star forming regions, we have to take into account that the CNC contains clusters with different ages (we adopt the age estimates as given in Smith & Brooks, 2008). We use the results of the clustering analysis of Feigelson et al. (2011) to define the membership of the individual X-ray sources to the different clusters or the distributed population. Note that further and more comprehensive studies of some of these sub-populations of the CNC are given in other publications in the frame of the CCCP (see Wang et al., 2011; Wolk et al., 2011).
Tr 16: According to the results of the clustering study, Tr 16 consists of seven sub-clusters that contain a total of 530 X-ray sources that are classified as likely Carina members. For 449 of these we have - and - and -band magnitudes, and 31 of these sources show near-infrared excess, resulting in an near-infrared excess fraction of . This value is clearly lower than the near-infrared excess fraction expected for a Myr old population (Briceno et al., 2007).
Tr 14: The clustering analysis related 1378 Chandra sources to Tr 14, for 1219 of which we have complete NIR photometry. 118 of these objects have near-infrared excesses; with , the near-infrared excess fraction is slightly higher than in Tr 16, but again lower than typical for Myr old populations.
Tr 15: The clustering analysis related 481 Chandra sources to Tr 15, for 436 of which we have NIR photometry; only 9 of these have near-infrared excesses. The resulting near-infrared excess fraction of ) in Tr 15 is thus clearly lower than for Tr 16 and Tr 14.
Treasure Chest: There are 96 Chandra sources associated with the very young ( Myr)“Treasure Chest” cluster. 25 of the 78 X-ray detected cluster members for which we have NIR photometry display near-infrared excesses. The corresponding near-infrared excess fraction of is clearly much higher than for the other clusters in the CNC.
The “widely distributed” population: According to the clustering analysis of Feigelson et al. (2011), 5185 of the X-ray sources are not associated with any cluster and thus belong to a widely dispersed population of young stars, extending throughout the CNC. For 1412 of these objects in the field of the HAWK-I survey we have complete - and - and -band photometry, and 94 of these stars have near-infrared excesses. The near-infrared excess fraction of is slightly lower but still similar to that in the clusters Tr 16 and Tr 14.
5.3 Extinction of the X-ray sources
In principle, the location of a specific source in the color-color diagram can be used to infer its extinction by shifting it “back” to the intrinsic (un-reddened) color along the direction of the reddening vector. Since the intrinsic colors of the sources depend on their spectral type, which we do not know for most objects, we cannot determine accurate extinction values of individual objects. Nevertheless, we can derive statistical estimates of the distribution of extinction for the whole sample of objects in the following way: We assume a “typical” intrinsic color of , which is roughly correct for K-type stars888Note that, at an age of Myr, a solar-mass pre-main sequence star has a spectral type of . which are thought to dominate the X-ray selected sample. In order to compute an estimate of the visual extinction, we take the apparently anomalous extinction law in Carina into account: as discussed in more detail in Povich et al. (2011b), the average extinction law toward the CNC stars is better represented by instead of the standard diffuse interstellar medium value of . According to the relations given in Mathis (1990), the formula connecting color excess to visual extinction is then . We restrict this analysis to sources within the photospheric reddening band, since for sources with near-infrared excesses the colors are no longer proportional to the extinction (e.g., Stark et al., 2006). Furthermore, we exclude all objects with photometric uncertainties larger than 0.1 mag in any of the near-infrared bands and all objects classified as background stars and AGN. By using the notation we want to emphasize that these values do not accurately reflect the true extinction for individual objects; however, the distribution of values should yield a reasonably good proxy for the distribution of the true extinctions, since most errors are expected to cancel out in this large sample.
The resulting distribution of extinction estimates for 4879 objects (see Fig. 5) has a median value of mag and extends up to mag. The 10th and 90th percentile values are 1.6 mag and 6.2 mag, respectively. This variation by a factor of nearly 4 implies that there is considerable differential extinction between the individual young stars in the region. Note that this range is in good agreement with the above mentioned estimates of the cloud extinction ( mag); this suggests that the X-ray selected stars fill the whole range of cloud depths, i.e. we do not systematically miss a population of highly obscured members.
Finally, we emphasize again that these extinction estimates are only valid for the sub-sample of objects without near-infrared excess (i.e. diskless stars). Among the objects with near-infrared excesses, stars with very red color suggesting higher extinctions ( mag) are clearly present. However, the relative number of X-ray detected objects with very red colors is considerably smaller than seen in many other star forming regions: only 29 (0.5%) out of 6241 X-ray selected objects have .
We conclude that the vast majority of the X-ray detected young stellar population in the CNC shows rather moderate extinction, mag; the X-ray selected Carina members can thus be considered as a “lightly obscured” population of young stars. In this context, it is important to note that the study of Povich et al. (2011a), which is based on deep Spitzer mid-infrared images of the CNC, found a considerable population (1439) of young star candidates with strong mid-infrared excesses, most of which are not detected in the Chandra X-ray data. This non-detection seems to be related to the relatively strong obscuration of many of these objects.
5.4 Color-Magnitude Diagrams of the X-ray selected objects
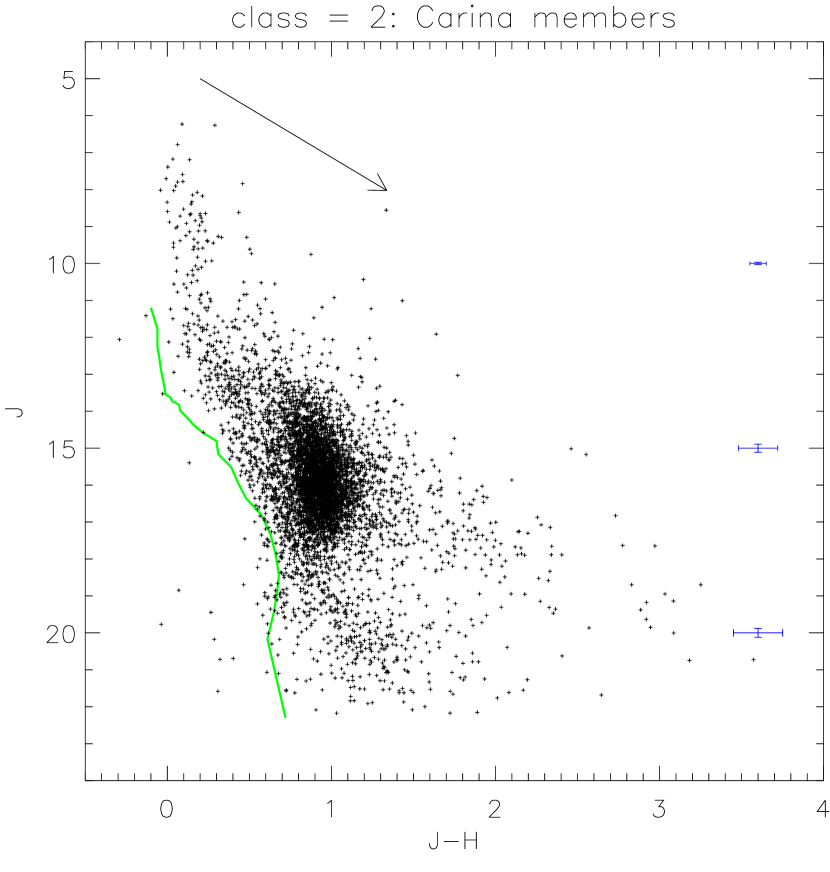
In Fig. 6a we show the versus CMD of the X-ray selected objects that were classified as likely Carina members (class = H2). The stars at the top of the diagram, i.e. at , are O- and early B-type stars which are known to be strong X-ray emitters. Going towards fainter magnitudes, the CMD shows a “gap” (i.e. a lower number of objects) in the range ; this corresponds to stars with late B and A spectral types, most of which are not expected to be strong X-ray sources. Proceeding to fainter magnitudes, the number of objects increases strongly, as expected for a mass function rising towards lower masses. The vast majority of the objects are at CMD locations corresponding to stellar masses of , as expected from the X-ray detection limits. The objects with very faint magnitudes () may be very-low mass stars with unusually high X-ray luminosities (perhaps due to X-ray flares), or objects that are surrounded by circumstellar disks seen approximately edge-on.
As the probabilistic source classification cannot provide definitive evidence for the nature of individual objects, we use this diagram to search for indications of remaining contamination among the objects classified as likely Carina members. The first thing to note is that nearly all objects lie to the right of the zero-age main sequence (ZAMS), i.e. at a location where one would expect young pre-main sequence stars in Carina. However, 46 of the 6230 objects in the diagram lie to the left of the ZAMS, and another 90 objects on or within 0.1 mag of the ZAMS. These objects may actually be mis-classified fore- or background objects, suggesting a low level () of field star contamination in the X-ray selected sample. Further indications of contamination are seen at the faintest magnitudes. If X-ray detected young stars are very faint () because they suffer from strong inter- or circumstellar extinction, they should show correspondingly red colors (). However, the CMD contains some very faint objects that have only moderately red colors (); many of these objects may actually be mis-classified AGN.
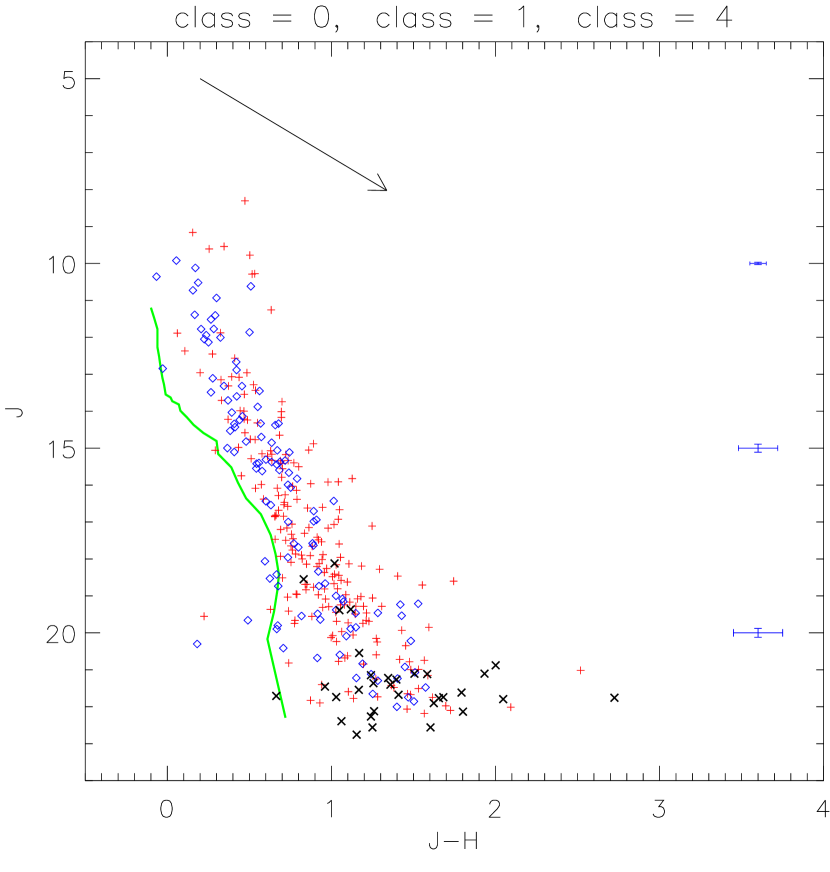
Looking at the CMD for the objects that were classified as likely non-members (Fig. 6b), we see that likely galactic foreground objects are at CMD locations consistent with slightly reddened main-sequence stars, whereas the likely extragalactic (AGN) objects are strongly concentrated towards very faint magnitudes. Again, we conclude that the CMD positions of the objects are consistent with their automatic classifications. Although it is possible that some of the objects classified as background are actually Carina members (see Broos et al., 2011a), their number is too small to significantly affect the source statistics. There is not much we can conclude about the unclassified sources; some fraction of these may actually be Carina members, but again their number is rather small.
In summary, we find that the automatic source classification produced very reasonable results and the remaining level of contamination among the objects classified as Carina members (class = H2) is very low. Even if we assume that most (i.e. ) of the very faint class = H2 objects are actually mis-classified AGN, the total number of mis-classifications (i.e. 250 plus the objects to the left or close to the ZAMS) would be only , i.e. just 6.4% of all class = H2 objects in the HAWK-I field. From this we conclude that a maximum of of X-ray sources with H2 classifications may in fact not be Carina members. We therefore will from now on focus on the infrared properties of the objects classified as Carina members and assume that these constitute a reasonably complete (but of course X-ray luminosity-limited, i.e. approximately mass-limited) and only very marginally contaminated sample of the young stellar population in the CNC.
5.5 The -band luminosity-function of X-ray sources
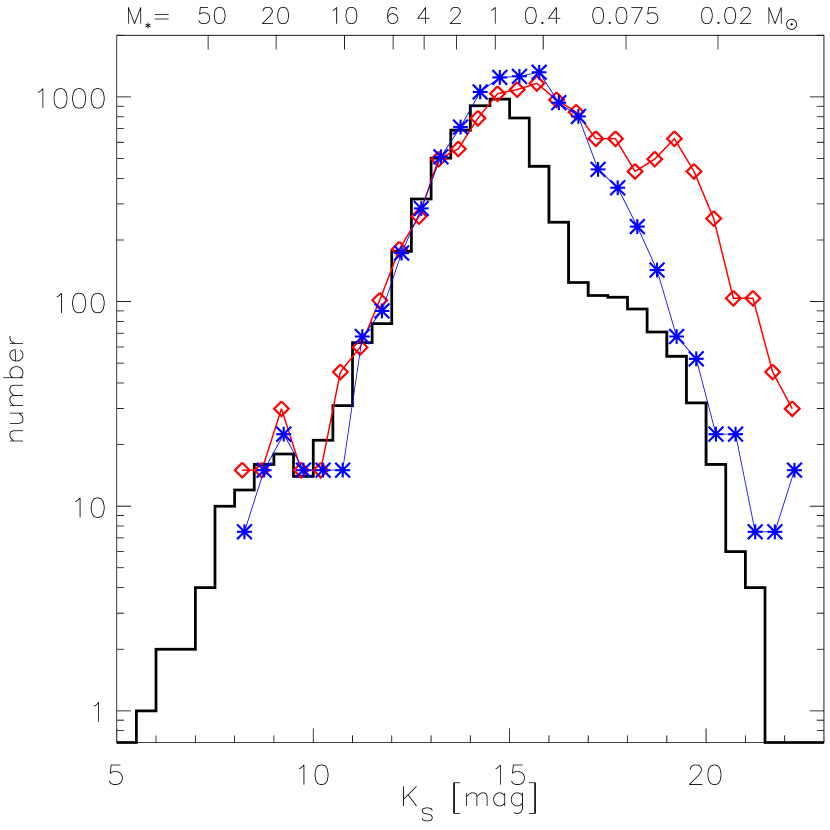
Information about the distribution of stellar masses of the X-ray selected objects in the CNC can be inferred from the -band luminosity function (KLF). In Fig. 7 we compare the KLF of the X-ray selected objects classified as Carina members in the HAWK-I field to the KLFs of the infrared sources and the X-ray selected young stars in the Orion Nebula Cluster. Up to magnitudes of , i.e. the level above which we expect the X-ray selected Carina sample to be nearly complete, the Carina and Orion KLFs agree very well. This implies that for masses of the shape of the IMF in the CNC is consistent with the IMF in the Orion Nebula Cluster (which, in turn, is known to agree with the field IMF). At fainter magnitudes, for , the steep drop in the number of X-ray detected Carina members reflects the expected incompleteness of the X-ray selected Carina sample arising from the X-ray completeness limit (which is roughly at erg/s for Carina, compared to erg/s for the “lightly absorbed optical sample” in the Orion data).
For even fainter magnitudes, , the Carina KLF does not drop as steeply as the Orion KLF of X-ray selected stars, but seems to show a “bump” in the histogram, i.e. a surplus of very faint objects. The stellar masses corresponding to these magnitudes would be , i.e. below the estimated X-ray detection limit. Although some of these faint objects might be optically strongly obscured, highly X-ray luminous young stars, at least some fraction of them might be mis-classified non-members of the CNC. The size of this “faint surplus population” is, however, rather small; by extrapolation of the histogram slope in the mag interval we find that it comprises just objects. This number agrees well with the estimate made above that some of the faintest objects may in fact be mis-classified background objects.
In summary, our analysis of the KLF does not reveal any indications for systematic differences between the shape of the IMF in the CNC and the Orion Nebula Cluster (in the mass range . This suggests that the shape of the IMF in the CNC is (at least down to ) consistent with the field IMF. This conclusion relies on the assumption that the X-ray luminosity function (XLF) of the CNC stars is similar to that of the Orion stars. This assumptions appears reasonable, because X-ray studies of a large number of young stellar clusters have shown that the XLF appears to be universal (see Feigelson & Getman, 2005). Furthermore, the analysis of the CCCP data in Feigelson et al. (2011) has directly shown that the Carina XLF has (above the completeness limit) a very similar shape to the Orion XLF.
6 X-ray clusters and infrared clusters
Feigelson et al. (2011) investigated the clustering properties of the X-ray sources classified as likely Carina members and identified 20 principal clusters of X-ray stars as well as 31 small groups of X-ray stars outside the major clusters. While most of the principal clusters are clearly evident in optical images, the reality of most of the apparent small groups of X-ray stars is not completely sure; some of them could perhaps just be random fluctuations in the spatial X-ray source density. To investigate the reality of these clusterings, we inspected our HAWK-I images at the positions of all X-ray clusters and groups. The advantage of the HAWK-I images is that they show essentially all young stars (except some very deeply embedded objects), whereas the flux limit of the Chandra data implies that only of the stellar cluster members are detected as X-ray sources. However, the HAWK-I images have the disadvantage of a much higher level of background contamination, that may easily prevent a loose clustering of sources from being recognized against the dense and irregular background of contaminating infrared sources.
In our inspection we found that all but one of the 20 principal X-ray clusters are related to obvious clusterings in the HAWK-I images. The exception is cluster 19 (104559.5-600832), for which no indication of a clustering can be seen in the HAWK-I images; we note that the X-ray sources in this cluster show unusually high median photon energies, suggesting that the objects are particularly strongly obscured, which may explain the non-detection in the HAWK-I images. This is supported by the fact that this X-ray cluster coincides with a clustering seen in the Spitzer images (see Smith et al., 2010b). While the near-infrared confirmation of the X-ray clusters is trivial for the well known optical clusters, it is relevant for the small clusters 13, 14, 16, 17, 18, and 20. For the 31 small groups of X-ray stars outside of major clusters, the results are mixed (see Tab. 2). For nine of the 16 small groups in the HAWK-I field, small infrared clusterings are clearly apparent in our images; for two cases the situation remains unclear, and for five small X-ray groups we see no indication of corresponding infrared clusterings. The general level of agreement (i.e. the infrared confirmation of of the reported X-ray clusterings) appears quite good.
7 Summary and conclusions
Our deep HAWK-I images of the central parts of the CNC provide crucial information about the infrared counterparts of the X-ray sources detected in the Carina Survey. Being mag deeper than the 2MASS point source catalog, our HAWK-I source catalog raises the fraction of known infrared counterparts to X-ray sources from to nearly . The near-infrared properties of the X-ray counterparts are consistent with the results of the automatic X-ray source classification and show that the remaining contamination in the sample of 10 714 X-ray sources classified as pre-main sequence stars in the CNC is very low ().
Our analysis of the near-infrared data shows that the -band luminosity function for the X-ray selected young stars in the CNC agrees (within the completeness limits) well to that of the young stars in the Orion Nebula Cluster. This suggests that the initial mass function in the CNC is similar to that in Orion. It also directly supports the estimate in Feigelson et al. (2011) (derived by scaling of the X-ray luminosity functions) of a total population of young stars in the CNC, which clearly shows that the CNC contains a very large population of low mass stars.
We find considerable variations in the near-infrared excess fractions for the different clusters in the CNC. Whereas 32% of the X-ray selected stars in the Myr old “Treasure Chest” cluster show near-infrared excesses, these fraction are 10% for the Myr old cluster Tr 14, 6% for the Myr old cluster Tr 16, and only 2% for the Myr old cluster Tr 15. While the temporal decay of excess fraction with increasing cluster age is qualitatively similar to what is found for other galactic clusters, the absolute values of the near-infrared excess fractions for the clusters in the CNC are clearly lower than those typical for nearby, less massive clusters of similar age (e.g., Briceno et al., 2007). This suggests that the process of circumstellar disk dispersal proceeds on a faster timescale in the CNC than in the more quiescent regions, and is most likely the consequence of the very high level of massive star feedback in the CNC.
Finally, we note that the infrared data presented in this paper are also used in the more detailed studies of individual clusters in the CNC in the context of the CCCP (see Wang et al., 2011; Wolk et al., 2011).
References
- Ascenso et al. (2007) Ascenso, J., Alves, J., Vicente, S., & Lago, M. T. V. T. 2007, A&A, 476, 199
- Baraffe et al. (1998) Baraffe, I., Chabrier, G., Allard, F., Hauschildt, P.H. 1998, A&A, 337, 403
- Bastian et al. (2010) Bastian, N., Covey, K. R., & Meyer, M. R. 2010, ARA&A, 48, 339
- Briceno et al. (2007) Briceno, C., Preibisch, Th., Sherry, W., Mamajek, E., Mathieu, R., Walter, F., Zinnecker, H. 2007, in: Protostars & Planets V, eds. B. Reipurth, D. Jewitt, & K. Keil, University of Arizona Press, Tucson, p. 345
- Broos et al. (2007) Broos, P. S., Feigelson, E. D., Townsley, L. K., Getman, K. V., Wang, J., Garmire, G. P., Jiang, Z., & Tsuboi, Y. 2007, ApJS, 169, 353
- Broos et al. (2010) Broos, P. S., Townsley, L. K., Feigelson, E. D., Getman, K. V., Bauer, F. E., & Garmire, G. P. 2010a, ApJ, 714, 1582
- Broos et al. (2011a) Broos, P. S., et al. 2011a, ApJS, 193, in press (CCCP Catalog Paper; arXiv1102.5121)
- Broos et al. (2011b) Broos, P. S., et al. 2011b, ApJS, 193, in press (CCCP Classifier Paper; arXiv1102.5120)
- DeGioia-Eastwood et al. (2001) DeGioia-Eastwood, K., Throop, H., Walker, G., & Cudworth, K. M. 2001, ApJ, 549, 578
- Feigelson & Getman (2005) Feigelson, E. D., & Getman, K. V. 2005, The Initial Mass Function 50 Years Later, 327, 163 [arXiv:astro-ph/0501207]
- Feigelson et al. (2005) Feigelson, E. D., Getman, K., Townsley, L., et al. 2005, ApJS, 160, 379
- Feigelson et al. (2007) Feigelson, E. D., Townsley, L., Güdel, M., Stassun, K. 2007, Protostars & Planets V, (eds. B. Reipurth, D. Jewitt, and K. Keil, Univ. Arizona Press), p. 313
- Feigelson et al. (2011) Feigelson, E. D., et al. 2011, ApJS, 193, in press (CCCP Clustering Paper; arXiv1103.0802)
- Forbrich & Preibisch (2007) Forbrich, J., & Preibisch, T. 2007, A&A, 475, 959
- Getman et al. (2005) Getman, K. V., Flaccomio, E., Broos, P.S., et al. 2005, ApJS, 160, 319
- Getman et al. (2011) Getman, K. V., et al. 2011, ApJS, 193, in press (CCCP Contaminants Paper; arXiv1102.5122)
- Grosso et al. (2005) Grosso, N., Feigelson, E. D., Getman, K. V., et al. 2005, ApJS, 160, 530
- Hodgkin et al. (2009) Hodgkin, S. T., Irwin, M. J., Hewett, P. C., & Warren, S. J. 2009, MNRAS, 394, 675
- Irwin (1985) Irwin, M. J. 1985, MNRAS, 214, 575
- Irwin et al. (2004) Irwin, M. J., Lewis, J., Hodgkin, S., et al. 2004, Proc. SPIE, 5493, 411
- Kaltcheva & Georgiev (1993) Kaltcheva, N. T., Georgiev, L.N. 1993, MNRAS 261, 847
- Kissler-Patig et al. (2008) Kissler-Patig, M., Pirard, J.F., Casali, M, et al. 2008, A&A, 491, 941
- Lejeune & Schaerer (2001) Lejeune T., Schaerer D. 2001, A&A, 366, 538
- Mathis (1990) Mathis, J. S. 1990, ARA&A, 28, 37
- Megeath et al. (1996) Megeath, S. T., Cox, P., Bronfman, L., & Roelfsema, P. R. 1996, A&A, 305, 296
- Mentuch et al. (2009) Mentuch, E., Abraham, R.G., Glazebrook, K., et al. 2009, ApJ, 706, 1020
- Mottram et al. (2007) Mottram, J. C., Hoare, M.G., Lumsden, S.L., et al. 2007, A&A, 476, 1019
- Muench et al. (2002) Muench, A. A., Lada, E. A., Lada, C. J., & Alves, J. 2002, ApJ, 573, 366
- Oliveira et al. (2009) Oliveira, I., Merin, B., Pontoppidan, K.M., et al. 2009, ApJ, 691, 672
- Povich et al. (2011a) Povich, M. S., et al. 2011a, ApJS, 193, in press (CCCP IR YSOs Paper)
- Povich et al. (2011b) Povich, M. S., et al. 2011b, ApJS, 193, in press (CCCP Massive Star Candidates Paper)
- Preibisch & Zinnecker (2002) Preibisch, Th., & Zinnecker H. 2002, AJ, 123, 1613
- Preibisch et al. (2002) Preibisch, Th., Brown, A.G.A., Bridges, T., Guenther, E., & Zinnecker, H. 2002, AJ, 124, 404
- Preibisch & Feigelson (2005) Preibisch, Th., & Feigelson, E. D. 2005, ApJS, 160, 390
- Preibisch et al. (2005) Preibisch, Th., Kim, Y.-C., Favata, F., et al. 2005a, ApJS, 160, 401
- Preibisch et al. (2011a) Preibisch, Th., Schuller, F., Ohlendorf, H., Pekruhl, S., Menten, K.M., Zinnecker, H. 2011a, A&A, 525, A92
- Preibisch et al. (2011b) Preibisch, Th., Ratzka, T., Kuderna, B., Ohlendorf, H., King, R.R., Hodgkin, S., Irwin, M., Lewis, J.R., McCaughrean, M.J., Zinnecker, H. 2011b, A&A, submitted
- Rebull et al. (2010) Rebull, L. M., Padgett, D.L., McCabe, C.-E., et al. 2010, ApJS, 186, 259
- Rowles & Froebrich (2009) Rowles, J., & Froebrich, D. 2009, MNRAS, 395, 1640
- Sanchawala et al. (2007) Sanchawala, K., Chen, W.-P., Ojha, D., Ghosh, S.K., Nakajma, Y., Tamura, M., Baba, D., Sato, S., Tsujomoto, M. 2007, ApJ, 667, 963
- Siess et al. (2000) Siess, L., Dufour, E., & Forestini, M. 2000, A&A, 358, 593
- Skrutskie et al. (2006) Skrutskie, M. F., Cutri, R.M., Stiening, R., et al. 2006, AJ, 131, 1163
- Slesnick et al. (2008) Slesnick, C. L., Hillenbrand, L. A., & Carpenter, J. M. 2008, ApJ, 688, 377
- Smith (1987) Smith, R.G. 1987, MNRAS, 227, 943
- Smith (2002) Smith, N. 2002, MNRAS, 337, 1252
- Smith (2006) Smith, N. 2006, MNRAS, 367, 763
- Smith & Brooks (2007) Smith, N., & Brooks, K. J. 2007, MNRAS 379, 1279
- Smith & Brooks (2008) Smith, N., & Brooks, K. J. 2008, Handbook of Star Forming Regions, Volume II: The Southern Sky, ASP Monograph Publications, Vol. 5. Edited by Bo Reipurth, p.138
- Smith et al. (2004) Smith, N., Barba, R.H., Walborn, N.R. 2004, MNRAS, 351, 1457
- Smith et al. (2005) Smith, N., Stassun, K.G., & Bally, J. 2005, AJ, 129, 888
- Smith et al. (2010a) Smith, N., Bally, J., & Walborn, N.R. 2010a, MNRAS, 405, 1153
- Smith et al. (2010b) Smith, N., Powich, M.S., Whitney, B.A., et al. 2010b, MNRAS, 406, 952
- Stark et al. (2006) Stark, D. P., Whitney, B. A., Stassun, K., & Wood, K. 2006, ApJ, 649, 900
- Tapia et al. (2003) Tapia, M., Roth, M., Vazques, R.A., Feinstein, A. 2003, MNRAS 339, 444
- Telleschi et al. (2007) Telleschi, A., Güdel, M., Briggs, K. R., Audard, M., & Palla, F. 2007, A&A, 468, 425
- Throop & Bally (2005) Throop, H.B., & Bally, J. 2005, ApJ, 623, L149
- Townsley et al. (2011a) Townsley, L. K., et al. 2011, ApJS, 193, in press (CCCP Intro Paper; arXiv1102.4779)
- Wang et al. (2010) Wang, J., Feigelson, E. D., Townsley, L. K., Broos, P. S., Román-Zúñiga, C. G., Lada, E., & Garmire, G. 2010, ApJ, 716, 474
- Wang et al. (2011) Wang, J., et al. 2011, ApJS, 193, in press (CCCP Tr15 Paper; arXiv1103.0785)
- Whitworth & Zinnecker (2004) Whitworth, A.P., & Zinnecker, H. 2004, A&A, 427, 299
- Wolk et al. (2011) Wolk, S. J., et al. 2011, ApJS, 193, in press (CCCP Tr16 Paper)
- Yonekura et al. (2005) Yonekura, Y., Asayama, S., Kimura, K., et al. 2005, ApJ 634, 476

| CCCP number | (mag) | (mag) | (mag) | (mag) | (mag) | (mag) |
|---|---|---|---|---|---|---|
| 1719 | 11.26 | 0.02 | 10.63 | 0.02 | 10.47 | 0.02 |
| 1730 | -9.99 | 0.00 | -9.99 | 0.00 | -9.99 | 0.00 |
| 1786 | -9.99 | 0.00 | 19.64 | 0.09 | 18.56 | 0.07 |
| 1844 | 15.78 | 0.01 | 15.16 | 0.01 | 14.97 | 0.01 |
| 1846 | 14.51 | 0.01 | 13.54 | 0.01 | 13.20 | 0.01 |
Note. — Table 1 is available in its entirety in the electronic edition of the Astrophysical Journal Supplement. A portion is shown here for guidance regarding its form and content. The listed errors are the statistical errors reported from photometry routine and do not include possible systematic uncertainties (see discussion in the text). A value of -9.99 means that no magnitude value is available.
| Group number | RA (J2000) Dec | IR |
|---|---|---|
| 1 | 10:42:13.5 -59:35:59 | outside HAWK-I |
| 2 | 10:42:25.8 -59:46:21 | outside HAWK-I |
| 3 | 10:42:46.7 -59:46:56 | outside HAWK-I |
| 4 | 10:42:47.3 -59:25:35 | outside HAWK-I |
| 5 | 10:42:49.5 -59:09:05 | outside HAWK-I |
| 6 | 10:42:52.8 -60:13:20 | outside HAWK-I |
| 7 | 10:42:53.4 -59:26:15 | no IR cluster |
| 8 | 10:43:34.6 -60:00:18 | outside HAWK-I |
| 9 | 10:43:41.0 -60:01:16 | outside HAWK-I |
| 10 | 10:43:46.6 -60:02:24 | outside HAWK-I |
| 11 | 10:43:59.9 -60:01:59 | outside HAWK-I |
| 12 | 10:44:15.0 -60:00:05 | outside HAWK-I |
| 13 | 10:44:20.8 -59:59:03 | outside HAWK-I |
| 14 | 10:44:22.5 -59:59:37 | outside HAWK-I |
| 15 | 10:44:22.6 -59:25:14 | no IR cluster |
| 16 | 10:44:26.3 -59:59:55 | outside HAWK-I |
| 17 | 10:44:40.2 -59:46:52 | small group |
| 18 | 10:44:51.9 -60:25:09 | outside HAWK-I |
| 19 | 10:44:56.7 -59:24:51 | no IR cluster |
| 20 | 10:44:58.5 -59:47:11 | small embedded group |
| 21 | 10:45:30.0 -59:57:41 | no IR cluster |
| 22 | 10:45:36.8 -59:57:58 | low-density group |
| 23 | 10:45:38.5 -60:00:44 | loose group |
| 24 | 10:45:40.4 -60:01:07 | unclear, part of group 23 ? |
| 25 | 10:45:44.9 -59:55:27 | loose group of bright stars |
| 26 | 10:46:05.8 -59:56:55 | loose group |
| 27 | 10:46:06.0 -59:58:59 | no IR cluster |
| 28 | 10:46:50.7 -60:04:23 | loose clustering |
| 29 | 10:46:52.0 -60:06:03 | loose clustering |
| 28 | 10:46:54.4 -60:04:39 | dense clustering |
| 31 | 10:47:17.4 -60:07:51 | unclear |