The BHB stars in the Survey Fields of Rodgers et al. (1993): New Observations and Comparisons with other Recent Surveys.
Abstract
We study blue horizontal branch (BHB) and RR Lyrae stars in the Rogers et al. (1993a) fields and compare their velocity and density distributions with other surveys in the same part of the sky. Photometric data are given for 176 early-type stars in the northern field. We identify fourteen BHB stars and four possible BHB stars, and determine the selection efficiency of the Survey, the Survey, and the survey for BHB stars. We give light curves and radial velocities for three type RR Lyrae stars in the northern field; comparison with the nearby Survey shows that there is likely to be an equal number of lower-amplitude type RR Lyrae stars that we do not find. There are therefore at least twice as many BHB stars as type RR Lyrae stars in the northern field — similar to the ratio in the solar neighborhood. The velocity distribution of the southern field shows no evidence for an anomalous thick disk that was found by Gilmore et al. (2002); the halo velocity peaks at a slightly prograde rotational velocity but there is also a significant retrograde halo component in this field. The velocity distribution in the northern field shows no evidence of Galactic rotation for 4 kpc and a slight prograde motion for 4 kpc. The space densities of BHB stars in the northern field agree with an extrapolation of the power-law distribution recently derived by de Propris et al. (2010). For 4 kpc, however, we observe an excess of BHB stars compared with this power-law. We conclude that these BHB stars mostly belong to a spatially flattened, non-rotating inner halo component of the Milky Way in confirmation of the Kinman et al. (2009) analysis of Survey BHB stars.
Subject headings:
stars: horizontal branch, Galaxy: structure, Galaxy: halo1. Introduction
In this paper we identify blue horizontal branch (BHB) and RR Lyrae stars among the 176 early type stars in the Rodgers et al. (1993a) fields and compare their velocity and density distributions with those of other surveys in the same part of the sky. BHB and RR Lyrae stars are interesting because they are luminous tracers of the old stellar population. Our targets come from Rodgers et al. (1993a), who used the Anglo-Australian Observatory Schmidt Telescope to make an objective-prism survey (600 Å mm-1 at H) in two 70 deg2 fields: in the North (hereafter ) and in the South (hereafter ). They determined spectral types using the relative strengths of the Caii K-line and the H Balmer line for stars in the magnitude range . They obtained follow-up coudé spectra (2.4 Å resolution) of 332 of these stars at the Mt. Stromlo 74-inch telescope. The resulting sample of high Galactic latitude metal-rich stars are discussed in Rodgers et al. (1993b), an extension of Rodgers (1971). The sample of metal-weak stars is discussed in Rodgers et al. (1993c); they conclude that this sample contains BHB stars but do not identify these stars individually.
We use photometry and spectroscopy to determine the stellar nature of the BHB and RR Lyrae candidates given by Rodgers et al. (1993c). BHB stars can be identified with considerable certainty, for example, by using a vs plot (Kinman et al. 1994). GALEX ultraviolet magnitudes can also be used to identify BHB stars (Kinman et al. 2007b). Rodgers et al. (1993a) give no colors for their stars, only magnitudes calculated from the Hubble Space Telescope () Guide Star Catalog (Lasker et al. 1990). We therefore obtain , and photometry for most of the stars of spectral type A8 and earlier in the field. Photometry is also taken from the 2MASS and GALEX catalogs. In addition, the field is covered by the Northern Sky Variability Survey (hereafter ; Wózniak et al. 2004) and the ASAS-3 variability survey (Pojmański, 2002). We use these two surveys to study variability among the early-type stars and identify possible new RR Lyrae stars. We obtain light-curves and phase-corrected radial velocities for the three brightest RR Lyrae stars in the field.
The radial velocity distribution of the stars is important because the and fields have Galactic longitudes for which the sight-line component of Galactic rotation is the greatest and thus for which radial velocity can distinguish between disk and halo populations. An additional constraint on the nature and origin of the BHB and RR Lyrae stars is provided by their spatial distribution. We combine our photometry and luminosity estimates to make accurate distance estimates and establish that most of these stars belong to a flattened, non-rotating inner halo component of the Milky Way.
1.1. Comparison with Other Surveys
Gilmore et al. (2002) obtained radial velocities for 2000 main sequence turn-off stars in two southern fields, one of which is coincident with (but smaller) than the field. The distribution of radial velocities in the Gilmore et al. fields showed a thick disk that had an unusually low galactic rotation at a few kpc above the plane; their data was also “suggestive of a retrograde halo stream”. They concluded that their sample was dominated by stars from a disrupted satellite that had merged with the disk of the Milky Way some 10 to 12 Gyr ago. Navarro et al. (2004) suggested that these kinematically anomalous thick disk stars are connected with the metal-poor high-velocity “Arcturus Group” in the solar neighborhood. Carollo et al. (2010) have also identified a disk population with an anomalously low rotation (the metal-weak thick disk) and noted its similarity to the population found by Gilmore et al.111The analysis of Carollo et al. (2010) has, however, been criticized by Schönrich et al. (2010). A broader discussion of these streams has been given by Minchev et al. (2009).
Our main interest in this paper is the field, which is overlapped by and/or contiguous with a number of recent surveys. Stripes 76 and 79 of the Seventh Data Release () of the Sloan Digital Sky Survey (Abazajian et al. 2009) cross the field and contain 33 stars whose positions coincide with those listed in the field, but only 8 of these (roughly those with 14.5) are faint enough to have reliable photometry222 The BHB star surveys by Xue et al. (2008) and Brown et al. (2010) that are based on the of the do not include stars from the field.. Smith et al. (2010) have given probabilities that a star is a BHB star for 27,074 stars in the of the ; five of our candidate BHB stars in the field are included in their catalog. The field is also contiguous to the Stripe 82 which has been searched for RR Lyrae stars, subdwarfs and BHB stars by Watkins et al. (2009), Smith et al. (2009) and Deason et al. (2010) respectively. These studies and that of Belokurov et al. (2007) show that the field is unlikely to be affected by the Hercules-Aquila Cloud (the nearest large sub-structure in the halo).
The two surveys most relevant to our study are the Survey and the Survey. Beers et al. (2007b) (hereafter ) used 2MASS colors to assign “High”, “Medium’ or “Low” probabilities that the stars of the Survey (Beers et al. 1988, 1996) are BHB stars. The survey overlaps 50% of the area of the survey. In this overlap region they list 45 stars; 28 of these were given by Rodgers et al. (1993a) and which we include in our list of BHB candidates (Table 5). The 17 stars not listed by Rodgers et al. are given separately in Table 10 in Appendix B; these are mostly stars that are either too red or too faint to have been included in the survey. The Century Halo Star Survey (Brown et al. 2004, 2008) (hereafter ) overlaps 30% of the field and has 12 stars in this area333This survey used the 2MASS survey to extract stars with 12.515.5, –0.200.10 and 0.10. Spectroscopic analysis showed that 47% of these were BHB stars.. Ten are listed by Rodgers et al. (1993a). The other two have 15.0 and thus are fainter than the limit at which the survey is complete. Both the and surveys use colors to select BHB candidates but since the additionally uses slit spectra (2.3Å resolution, 3450—5450 Å), it is much more effective in identifying these stars.
Spectra are already available for 18 of the stars in the field; they were obtained with the RC spectrograph at the 4m Mayall telescope at Kitt Peak (0.8 Å resolution, 3880–4580 Å). We are grateful to Dr. Nick Suntzeff (priv. communication 1996, 1998) for making available the radial velocities from these spectra. Additional spectra for this study were obtained with the FAST spectrograph of the Whipple 1.5-m telescope (2.3 Å resolution, 3600–5500 Å).
2. Photometry of Stars in the Field.
We first consider the photometry of the stars in the field. We give photometric data for 176 stars in the Northern field of Rodgers et al. (1993) in Table 1 (at end of paper). New photometry is given for 105 of these stars; Johnson photometry is taken from the literature for 7 others.
Our new photometric observations were made with the KPNO 0.9-m telescope between August 1996 and December 1997, inclusive. The detector was a 512512 Tektronix chip under control of the CCDPHOT program (Tody & Davis, 1992). The measurements were made in a 128128 pixel area at the center of the chip. This 9090 arcsec area was small enough to allow a rapid readout and yet large enough for acquisition to be easy. The filter slide was under computer control so that the observations could be made with an assigned integration time for each filter and this cycle could be repeated for a chosen number of times. Bias and flat-field observations were made in the usual way and used by the program to compute instrumental magnitudes that were immediately available at the end of each integration cycle. Thus, the approximate magnitude and color of the star were available immediately after each integration cycle. The integrations through the various filters were made in rapid succession and so the colors were relatively unaffected by slow trends in the transparency. We concentrated on the stars with spectral types earlier than A8. One or two integration cycles with the program were sufficient to decide whether a star had the appropriate color for a BHB star; if it had, the observations were continued.
The , and observations were made as described in Kinman et al. (1994). We used the standards of Landolt (1992) — primarily those in SA-114 and SA-115. For , the following secondary standards near the Rodgers field were used: HD 2857 (2.094); BD +02–0089 (1.938); BD +00–0145 (1.831); SA 114–750 (1.952); SA 115–271 (1.918); SA 115–420 (1.924). The adopted value of is given in parentheses following the name of each star. We measured the Strömgren H index for 30 of the brighter program stars (14) using well-observed early-type stars taken from Stetson (1991) as standards. The E correction for galactic extinction given in col. 7 of Table 1 is from Schlegel et al. (1998). We assumed A = 3.1E and A = 0.89E (Kinman et al. 1994).

Our mean , and for the program stars are given with their errors in cols. 3, 4 and 5 of Table 1. A magnitude that has no error and a superscript a is taken from the ASAS-3 catalog (Pojmański 2002). A with a superscript b is a mean of the magnitudes given in the ASAS-3 catalog and the GSC-2.3 catalog (Lasker et al. 2008). The sources of the other magnitudes are given in the table notes.
The GALEX magnitudes (col. 8) are taken from MAST (The Multimission Archive at STSci, http://archive.stsci.edu/). is a near- magnitude (effective wavelength 2267Å ) that can be used to select BHB stars (Kinman et al. 2007b). The and magnitudes are taken from the 2MASS Point Source Catalog using the Vizier access tool. The red magnitude (col. 11) and its scatter () (col. 12) were taken from the Northern Sky Variability Survey (Woźniak et al. 2004).
We also calculated from both and from using the following relations that were derived from the program stars with known :
| (1) |
| (2) |
Brown et al. (2008) derived from Balmer line equivalent widths but we found that the scatter in the relation between our and the Balmer line equivalent widths given in Rodgers et al. (1993b) is much larger than for the relations with and . We therefore only used the relations with and (given above) to derive . The scatter in these relations is shown in Fig. 1(b) and Fig. 1(c) and the difference between the derived from the two relations is shown in Fig. 1(a). The relation was not used for stars with 14.5 because the magnitude is poorly determined for fainter stars. For stars with 14.5, the color given in col. (3) of Table 1 is followed by a single colon and can be assumed to have an error of 0.1 magnitude. For stars with 14.5, the colors are followed by a double colon and can be assumed to have an error of 0.2 mag.. Only a few of these stars (75 (Pn24l–13), 104 (Pn23l2–58), 132 (Pn24l–20) and 159 (Pn24l–60)) have colors that may be blue enough for them to be possible BHB candidates.
The stars in Table 1 are given in order of RA and identified by a running number (col. 1) and the ID given by Rodgers et al. (1993a) (col. 2); the former is used throughout the rest of this paper. The coordinates of the brighter stars given by Rodgers et al. (1993a) were taken from the Guide Star Catalog and are accurate to one or two arcsec and are not repeated here. The coordinates of some of the fainter stars, however, were of lower accuracy and improved coordinates (taken from the USNO B Catalog) are given for them in Table 9 in the Appendix B.1.
| No.aaNumber given in Table 1 and Fig. 2. A is described in text. | ID bbIdentification | RA | DEC | Spectral Type ccRodgers et al. (1993b) | Period | Type ddRR = RR Lyrae; EC = Contact binary. | Notes |
|---|---|---|---|---|---|---|---|
| J 2000 | (days) | ||||||
| 12 | CS 29521-078 | 23:10:43.0 | +10:36:03 | A0 | EC? | (1) | |
| 16 | IX PEG | 23:11:12.9 | +13:50:56 | A2 | 0.601 | RRab | (2) |
| 37 | 14601441 | 23:14:17.5 | +02:37:31 | A7 | 0.554 | EC | (3) |
| 47 | 11843625 | 23:15:46.0 | +09:18:01 | F0 | 0.381 | EC | (4) |
| 84 | NSVS 11847482 | 23:21:51.0 | +12:47:24 | A3 | 0.555 | RRab | (5) |
| 164 | NSVS 14611789 | 23:32:18.8 | +06:47:03 | F0 | (6) | ||
| 168 | CS 30333-0136 | 23:32:59.0 | +08:26:14 | A3 | (7) | ||
| 169 | NSVS 9062655 | 23:33:14.7 | +09:00:57 | A1 | (8) | ||
| 173 | NSVS 9063965 | 23:34:58.9 | +13:44:06 | F0 | 0.694 | RRab | (9) |
| A | NSVS 9062108 | 23:31:50.0 | +12:51:00 | 0.328 | EC | (10) | |

3. The Variability of the Program Stars in the Field.
Before discussing the colors of our program stars, we need to test them for variability. Fig. 2 (left) shows a plot of the scatter in the individual magnitudes () against their red magnitude () as given in the Northern Sky Variability Survey (Wózniak et al. 2004). Most of these stars show a well-defined trend of increasing scatter with increasing . Stars that show more scatter than this trend (at roughly more than the 2-level) are shown by filled circles and labelled with the number of the star (Table 1, col. 1). Fig. 2 (right) shows a similar plot of the error of a single observation in of a star in the catalog (Pojmański, 2002) against its magnitude. The numbered stars in Fig. 2 (left) are also shown by numbered filled circles in Fig. 2 (right). The star marked A in both plots is NSVS 9062108 (23:31:50, +12:51:00 (2000) ); it is listed in the catalog as type RRC/EC with 12.0512.43 and a period of 0.328712 days. More information about these stars (including previous identifications as variables) is given in the notes to Table 2. In summary, three (16, 84 and 173) are RRab stars, four (12, 37, 47 and A) are eclipsing stars and the remaining three (164, 168 and 169) are probably not variable. We have made new photometric and spectroscopic observations of the three RR Lyrae stars and these are discussed in Sec. 4.
The RR Lyrae star IO PEG (period = 0.567 days; 15.0 16.5; Goranskij, 1986) is too faint to be listed in the and has only 3 observations in the catalog ( = 15.30.3). Although its magnitude is uncertain, we take it to be fainter than the limit of the survey.


4. RR Lyrae stars.
4.1. RR Lyrae stars in
In addition to BHB stars, RR Lyrae stars are important tracers of the halo. In our discussion of the variability of the stars in the field in Sec. 3, we found that Nos 16, 84 and 173 (Table 2 and Fig. 2) are type RR Lyrae stars. We made photometric observations of these stars in 2008 and 2009 with the commercial robotic f/7 0.8-m telescope of the Tenagra Observatory in Arizona which has a 10241024 SITe CCD. Details of similar photometry with this telescope are given by Kinman & Brown (2010). Periods were determined from this data using the periodogram program of Horne & Baliunas (1986). The period of 0.601089 days found for No. 16 (IX Peg) is satisfactorily close to the periods of 0.60103 days and 0.60099 days that were found by Kinemuchi et al. (2006) and Wils et al. (2006) respectively from the Northern Sky Variability Survey () data (Wózniak et al. 2004). The periods of 0.555135 and 0.6945125 days found for Nos 84 and 173 respectively are also close to the periods of 0.55514 and 0.69417 days that Kinemuchi et al. (2006) found for them. The light curves for these stars are given in Fig. 3. Metallicities [Fe/H] were derived from the amplitudes and periods (using eqn. 6 in Sandage (2004)) and are given with other photometric data in Table 3.
Radial velocities were measured from spectra taken in December 2009 with the FAST spectrograph of the Whipple 1.5-m telescope (resolution 2.3 Å and waveband 3600–5500 Å). The -velocities were derived following Liu (1992). The spectra of Nos 16 and 84 were were taken close to maximum light and so were not suitable for deriving [Fe/H] from the Ca ii K-line equivalent width. The spectrum of No. 173 was taken at phase 0.451, however, so we were able to derive an [Fe/H] of –1.99 by the S-method (Preston 1959). This [Fe/H] is in satisfactory agreement with the –2.15 derived from the amplitude and period. The spectroscopic data for these stars are summarized in Table 3.
Kinemuchi et al. (2006) found a fourth and fainter type RR Lyrae star ( 14602495; R.A. 23:15:56.66, DEC. +03:02:58 (2000)) within the field but not identified by Rodgers et al. (1993a). It has a period of 0.59355 days and a amplitude of 1.56 mag, from which they derived an [Fe/H] of –2.60. Our amplitudes are less than theirs by a factor of 0.700.06, so the amplitude of this star is 1.09 mag. on our scale. This impllies an [Fe/H] of –1.9 according to Sandage (2004). Kinemuchi et al. also give an intensity-weighted -magnitude of 15.03 mag. Their mean -magnitudes are calculated from unfiltered CCD magnitudes and (for the other three RR Lyrae stars) average 0.26 mag fainter than the intensity-weighted magnitudes that we derived from our photometry. We have therefore assumed an intensity-weighted -magnitude of 14.77 for this star and an absolute magnitude of +0.45 (following Clementini et al. (2003)) to derive a distance of 6.67 kpc.
4.2. RR Lyrae stars in Survey
The survey for RR Lyrae stars by Miceli et al. (2008) covers the sky in the neighborhood of the field; they discovered 838 type RR Lyrae stars in this field. Fig. 4 (below) shows the location of the stars in this survey that have 15.25 and that have 21h R.A. 01h and declinations between –20∘ and +15∘; the magnitude distribution of the brighter of the variables is shown in Fig. 4 (above). About 45% of this sample have amplitudes of less than 0.75 mag. One of these lower amplitude variables lies in the field but is not identifiable as a variable in the because it lies close to a brighter star.
The sample of stars shown in Fig. 4 cover roughly 400 deg2 and contains 31 stars with 14.75 and 42 stars with 15.00. We might therefore expect 5 and 7 stars in these magnitude intervals, respectively, in the 70 deg2 of .
| ID aaNo. of star in Table 1. | Star 16 | Star 84 | Star 173 |
|---|---|---|---|
| IX PEG | |||
| 11840238 | 11847482 | 9063965 | |
| RA(J2000) | 23:11:12.84 | 23:21:50.95 | 23:34:58.88 |
| DEC(J2000) | +13:50:56.2 | +12:47:24.5 | +13:44:06.3 |
| Type | |||
| Period (days) | 0.601089 | 0.555135 | 0.694125 |
| JD(max)bbHeliocentric Julian Date of maximim light. | 2454776.9770 | 2451444.6900 | 2454777.5497 |
| ccIntensity-weighted mean magnitude. | 13.676 | 14.443 | 13.269 |
| 13.030 | 13.900 | 12.780 | |
| 14.158 | 14.801 | 13.655 | |
| Rise Time | 0.160 | 0.175 | 0.220 |
| 2.05 | 1.82 | 2.42 | |
| E | 0.070 | 0.059 | 0.071 |
| ddDerived from eqn. (6) in Sandage (2004). | –2.02 | –1.41 | –2.15 |
| eeKinemuchi et al. (2006). | –2.43 | … | –2.16 |
| JD(hel) ffHeliocentric Julian Date of mid-exposure of spectrum. | 2455184.5558 | 2455184.6159 | 2455184.6201 |
| T ggIntegration time for spectrum in seconds. | 300 | 270 | 270 |
| Phase hhPhase of spectrum. | 0.067 | 0.966 | 0.451 |
| Rad. Vel. iiObserved radial velocity in km s-1 relative to LSR. | –359.85.1 | –113.84.6 | –098.65.9 |
| Rad. Vel. jj-velocity in km s-1 relative to LSR. | –325.9 | –87.5 | –104.4 |
| S kkPreston (1959) S derived from the calibration of equivalent widths given in Kinman & Carretta (1992). | … | … | 10.0 |
| llDerived from S following Suntzeff et al. (1994). | … | … | –1.99 |
| Mv mmAbsolute magnitude from following Clementini et al. (2003). | 0.428 | 0.558 | 0.434 |
| DistancennDistance in kpc. | 4.01 | 5.47 | 3.31 |
| No. | ID aaID from Rodgers et al. (1993b) | bbRadial velocity relative to LSR. Rodgers et al. (1993b) | ccHeliocentric radial velocity. Rodgers et al. (1993b) | RVKPNOddHeliocentric radial velocity. (This paper). | RVCenturyeeHeliocentric radial velocity. (Brown et al. 2008). | RVAdoptedffAdopted radial velocity relative to LSR. |
|---|---|---|---|---|---|---|
| km s-1 | km s-1 | km s-1 | km s-1 | km s-1 | ||
| 4 | Pn24l–37 | +015 | +009 | +019 | +013 | |
| 16 | Pn23l2–1 | –352 | –358 | –351 | –355 | |
| 38 | Pn24l–51 | –147 | –153 | –186 | –171 | |
| 41 | Pn23l2–14 | –256 | –262 | –289 | –277 | |
| 48 | Pn24l–45 | –130 | –136 | –104 | –121 | |
| 60 | Pn24l–42 | –207 | –213 | –216 | –216 | |
| 63 | Pn23l2–2 | –018 | –024 | –065 | –045 | |
| 72 | Pn23l2–4 | +014 | +008 | –002 | +002 | |
| 90 | Pn23l2–36 | –025 | –031 | –020 | –028 | |
| 99 | Pn23l2–22 | –201 | –207 | –232 | –217 | –221 |
| 110 | Pn23l2–28 | –061 | –067 | –0054 | –062 | |
| 115 | Pn24l–55 | –142 | –148 | –127 | –140 | |
| 120 | Pn24l–56 | –047 | –053 | –086 | –072 | |
| 126 | Pn23l1–18 | –057 | –059 | |||
| 128 | Pn23l2–30 | +063 | +057 | +047 | +050 | |
| 134 | Pn24l–8 | –117 | –123 | –140 | –134 | |
| 140 | Pn23l2–53 | –038 | –044 | –051 | –050 | |
| 141 | Pn24l–22 | –116 | –122 | –123 | –125 | |
| 145 | Pn24l–4 | –131 | –137 | –174 | –158 | |
| 146 | Pn24l–27 | –038 | –044 | –066 | –057 | |
| 148 | Pn24l–26 | –070 | –076 | –027 | –054 | |
| 151 | Pn24l–6 | +043 | +037 | +045 | +039 | |
| 157 | Pn23l1–39 | –056 | –062 | –051 | –0052 | –057 |
| 158 | Pn24l–28 | +042 | +036 | +033 | +032 | |
| 163 | Pn23l2–43 | +015 | +009 | 000 | +002 | |
| 169 | Pn23l2–45 | 000 | –006 | –030 | –020 |
5. The Radial Velocity Distribution in the Field.
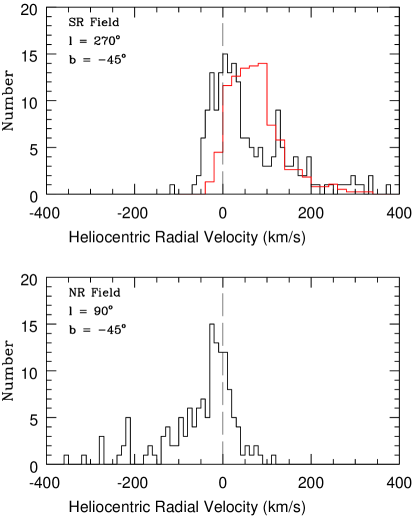
We begin by discussing the radial velocity distribution of stars in the field. The field covers a pair of overlapping objective prism fields with plate centers at 03h 40m, –65.∘0 and 03h 48m, –60.∘0. Rodgers et al. (1993a) list 259 early-type stars in this field and give radial velocities for 191 of them. This field has the same galactic coordinates as the (l,b) = (270°,–45°) field observed by Gilmore et al. (2002) although the field covers a much larger area to a brighter limiting magnitude. Fig. 5 shows the distributions of the heliocentric radial velocities of both the (above) and fields; in both cases these histograms refer to early-type stars that are brighter than = 15. The red histogram in the upper figure shows the distribution of the stars with 18 given by Gilmore et al. (2002); the numbers of these turn-off stars have been normalized to be the same as for the early-type stars in the field. At this galactic latitude (b = ), the heliocentric velocity will be about 70% of the galactic rotational velocity. Gilmore et al. describe the velocity distribution for their 18 stars as that to be expected for a canonical thick-disk with a lag of less than 50 km s-1. Their velocity distribution (the red histogram) actually shows a broad peak between 0 and +100 km s-1, and so the lag seems more like 70 km s-1 but this is a minor point. The velocity distribution for the early-type stars in the field, on the other hand, shows a broad asymmetrical peak centered on +5 km s-1 that continues out to large positive velocities (like the red histogram).
The radial velocity distribution of the early-type stars differs quite markedly from that of the turn-off stars: the distribution for the early type stars has a peak that is close to zero, and so the early type stars presumably have a significant old thin disk component (which according to Gilmore et al. should have a lag of 20 km s-1). “Early-type stars,” however, comprise a wide variety of types with a range of scale-heights (Preston et al. 1994; Knude 1997) and so it is probably over-simplistic to characterize them as belonging to either thin disk, thick disk or halo as may be done for turn-off stars.
The early-type stars in the field also show a peak in their heliocentric radial velocities at +125 km s-1; this corresponds to a lag of +180 km s-1 which is what one might expect for a prograde halo. Both the early-type stars and the turn-off stars show extended distributions of heliocentric radial velocities to +350 to +400 km s-1 which shows that both contain a significant component of halo stars with retrograde orbits; Gilmore et al. (2002) already noted this for their turn-off stars that have 18.
Too great a correspondence between different tracer populations should not be expected. Stars as closely related as RR Lyrae stars and BHB stars can show different kinematics in the same field (Kinman et al. 2007a), and the ratio of BHB to turn-off stars can vary (Bell et al. 2010). Nevertheless, further observations of the early-type stars in the field would be of interest; in particular, an investigation of the sharp peak in their radial velocities at +125 km s-1. A list of these stars and a brief discussion of their possible nature is given in Appendix A.
6. The Metallicites and Radial Velocities of the Program Stars in the Field.
6.1. Metallicities.
We now consider the metallicities of the early-type stars in the field. In their second paper, Rodgers et al. (1993b) give the equivalent widths of the Ca ii K line and the H Balmer line for 141 of their program stars. They do not derive metallicities for the individual stars but, in their third paper, Rodgers et al. (1993c) used these equivalent widths to show that many of their program stars have [Fe/H] –1.0. They conclude that while some of these metal-poor stars have halo kinematics, a significant proportion of those with 14 (which they took to be less than 2.5 kpc above the plane) have kinematics that are consistent with them belonging to a metal-weak thick disk.
We derive a metallicity [m/H] for each star from a plot of the equivalent width of its Ca ii K line against using the calibration given in Fig. 9 of Clewley et al. (2002). These metallicities and the data from which they are derived are given in Table 11 in Appendix B. The equivalent width W0(K) of the Ca ii K line given by Rodgers et al. (1993b) was corrected for an interstellar component of 0.6 Å . The value of is discussed in Appendix D where we conclude that a value of 0.3 Å would be more appropriate than the 0.6 Å correction used by Rogers et al. (1993b). We therefore also computed metallicities for the program stars using = 0.3 Å and these are given in the last column of Table 11 in Appendix B. Our derived metallicities [m/H] can only be considered approximate because of the combined errors of and and the uncertainties in the calibration plot. This will be particularly the case for the hottest and most metal-poor stars where the K-line is weak and also for the faintest stars for which the measured equivalent widths are likely to be the least accurate. Brown et al. (2008) give [Fe/H] for six of these stars. The mean difference of the [m/H] in the last column of Table 11 and the [Fe/H] of Brown et al. (2008) for these stars is +0.350.27. We therefore consider that although these [m/H] have statistical value, their individual values should be taken with considerable reserve.
6.2. Radial Velocities of program stars in the Field.
We now discuss the radial velocities that are available for the early-type stars in the field. Rodgers et al. (1993b) give radial velocities for their program stars that were obtained with the coudé spectrograph of the Mt Stromlo 1.88-m telescope. The detector was the Mt Stromlo Photon Counting Array which gave a resolution of 2.4 Å over the waveband 3830 to 4370 Å. The velocities were given with respect to the local standard of rest (LSR) by adding +6.0 km s-1 to the heliocentric velocities; their probable error was estimated to be 18 km s-1. Spectra of 18 of these program stars were obtained with RC spectrograph of the Mayall 4-m telescope at Kitt Peak; the spectral resolution was 0.8 Å over the waveband 3880 to 4580 Å (for further details see Kinman et al. 1996). The heliocentric radial velocities from these spectra were kindly supplied by Dr Nick Suntzeff (priv. comm. 1996, 1998); their estimated errors are 5 km s-1. Radial velocities of 8 of the program stars are available from the Survey (Brown et al. 2008). These spectra were taken with the FAST spectrograph on the Whipple 1.5-m telescope (resolution 2.3 Å, waveband 3450 to 5450, S/N = 30). These velocities have an estimated error of 16 km s-1.
These velocities are compared in Table 4. The mean difference of Stromlo Kitt Peak is +8.14.9 km s-1 where the of a single difference is 20.3 km s-1. The mean difference of Stromlo Whipple is –0.78.7 km s-1 and the of a single difference is 24.5 km s-1. These differences are in satisfactory agreement with quoted errors from the individual sources and there is no evidence for any systematic error in the Stromlo velocities. The adopted radial velocities with respect to the LSR are given in the final column of Table 3. Our corrections to the LSR have been made separately for each star and not, as was done by Rodgers eta l. (1993b), with a single correction for the whole field.
| No. | aa Outside defining window in plot. See Fig. 10(c) and Fig, 10(d). | bbBHB class from plot. See Sec. 7.5. | ccBHB class from plot. See Sec. 7.5. | ddBHB class from Strömgren plot. See Sec. 7.5. | eeBHB class in Survey, See Sec. 7.5. | ffBHB class in B2M Survey; See Sec. 7.5. | [m/H] ggMetallicity from Ca ii K line assuming correction for interstellar component of 0.3Å (Rodgers et al. 1993b). Metallicities in bold-face are from Brown et al. (2008). | RV hhAdopted radial velocity corrected to LSR. The velocity in bold-face is from Brown et al. (2008). | Class ii Adopted Class. BHB3 are the most likely to be BHB stars and BHB1 are the least likely. | |
|---|---|---|---|---|---|---|---|---|---|---|
| km s-1 | ||||||||||
| 2 | 12.15 | +0.198 | –3 | 0 | –3 | –0.8 | +000 | BHB1 | ||
| 3 | 13.15 | –0.031 | –3 | H | –2.0 | –218 | BHB1 | |||
| 4 | 13.07 | +0.144 | +4 | +4 | –3 | –1.2 | +013 | BHB2 | ||
| 15 | 14.87 | +0.038 | +2 | +4 | 0.0 | –211 | BHB3 | |||
| 17 | 12.33 | +0.180 | –3 | +2 | –0.8 | –007 | BHB1 | |||
| 27 | 12.62 | +0.164 | –3 | 0 | –1.5 | +071 | BHB1 | |||
| 30 | 14.53 | –0.049 | +4 | +4 | –2.0 | –227 | BHB3 | |||
| 34 | 13.14 | +0.237 | –3 | –3 | H | –0.3 | –004 | BHB1 | ||
| 38 | 12.75 | +0.045 | +4 | +4 | +3 | –2.2 | –171 | BHB3 | ||
| 41 | 14.29 | +0.023 | +4 | +4 | H | –2.2 | –277 | BHB3 | ||
| 48 | 14.43 | +0.020 | +2 | H | –0.8 | –121 | BHB1 | |||
| 52 | 14.06 | +0.246 | –3 | –3 | H | –0.7 | –161 | BHB1 | ||
| 53 | 13.62 | +0.122 | +2 | +4 | –1.4 | –029 | BHB3 | |||
| 56 | 13.50 | –0.261 | H | BHB1 | ||||||
| 60 | 14.62 | +0.057 | +2 | +2 | H | –2.6 | –216 | BHB2 | ||
| 63 | 14.60 | +0.184 | 0 | 0 | –1.13 | –045 | BHB1 | |||
| 72 | 14.84 | +0.282 | –3 | –3 | 0 | –0.94 | +002 | BHB1 | ||
| 77 | 11.93 | +0.158 | +2 | +2 | –3 | H | –0.9 | –007 | BHB1 | |
| 79 | 13.58 | –0.062 | 0 | –3 | H | –2.0 | +006 | BHB1 | ||
| 83 | 14.63 | +0.090 | –4 | –3 | H: | –1.2 | –114 | BHB1 | ||
| 87 | 15.2: | +0.5:: | –3 | H | –281 | BHB1 | ||||
| 90 | 12.80 | –0.063 | 0 | –3 | –4 | 0.00 | –028 | BHB1 | ||
| 92 | 15.53 | +0.037 | +2 | +2 | –1.0 | –228 | BHB2 | |||
| 94 | 13.6: | +0.4: | –3 | H | –073 | BHB1 | ||||
| 99 | 14.53 | +0.104 | +4 | +4 | +4 | –2.14 | –221 | BHB3 | ||
| 104 | 15.1: | +0.150 | +2 | H | –2.7 | –273 | BHB1 | |||
| 106 | 12.44 | +0.132 | –3 | –3 | H | +0.0 | +070 | BHB1 | ||
| 110 | 14.91 | +0.073 | +4 | +4 | +4 | –3.00 | –062 | BHB3 | ||
| 115 | 14.37 | +0.042 | +4 | +4 | –1.8 | –140 | BHB3 | |||
| 116 | 12.89 | +0.195 | –3 | 0 | H | –1.3 | –017 | BHB1 | ||
| 120 | 12.88 | +0.198 | 0 | 0 | +3 | –1.6 | –072 | BHB2 | ||
| 121 | 14.59 | +0.124 | –3 | +4 | –1.4 | –027 | BHB1 | |||
| 122 | 14.2: | +0.18: | M | BHB1 | ||||||
| 126 | 14.1: | –0.1:: | –3 | –4 | –059 | BHB1 | ||||
| 128 | 12.22 | +0.057 | +4 | +4 | +3 | H | –1.8 | +050 | BHB3 | |
| 133 | 14.84 | +0.176 | +2 | 0 | –1.8 | –009 | BHB1 | |||
| 134 | 13.96 | +0.148 | +2 | +4 | –0.4 | –134 | BHB3 | |||
| 136 | 11.05 | +0.074 | –3 | +4 | –3 | H | –1.6 | +023 | BHB1 | |
| 138 | 10.78 | +0.097 | –3 | –3 | –1.2 | –017 | BHB1 | |||
| 140 | 13.70 | +0.265 | –3 | –4 | H | –1.04 | –050 | BHB1 | ||
| 141 | 14.08 | +0.208 | +2 | –3 | –1.5 | –125 | BHB1 | |||
| 143 | 11.89 | +0.116 | –3 | –3 | –3 | H | –1.4 | +009 | BHB1 | |
| 145 | 12.64 | +0.027 | +4 | +4 | –3 | –0.2 | –158 | BHB2 | ||
| 146 | 13.46 | +0.058 | +4 | +4 | H | +0.0 | –057 | BHB3 | ||
| 148 | 14.20 | +0.089 | 0 | 0 | H | –0.25 | –054 | BHB1 | ||
| 151 | 14.64 | +0.009 | +4 | +4 | 0.0 | +039 | BHB3 | |||
| 156 | 13.73 | +0.299 | –3 | –3 | M | –1.9 | –106 | BHB1 | ||
| 157 | 12.81 | +0.073 | +4 | +4 | +4 | +4 | H | –0.75 | –057 | BHB3 |
| 158 | 12.47 | +0.165 | +4 | +4 | –3 | +0.0 | +032 | BHB2 | ||
| 161 | 12.63 | +0.261 | –3 | H | –1.3 | –044 | BHB1 | |||
| 162 | 13.99 | +0.062 | +4 | H | –2.3 | –025 | BHB2 | |||
| 163 | 14.37 | +0.227 | –3 | 0 | H | –0.91 | +002 | BHB1 | ||
| 168 | 11.96 | +0.158 | –3 | +2 | –3 | H | –0.6 | +020 | BHB1 | |
| 169 | 13.83 | +0.047 | +4 | +4 | M | –2.0 | –020 | BHB3 |
7. The Selection of the Blue Horizontal Branch (BHB) stars in the Field.
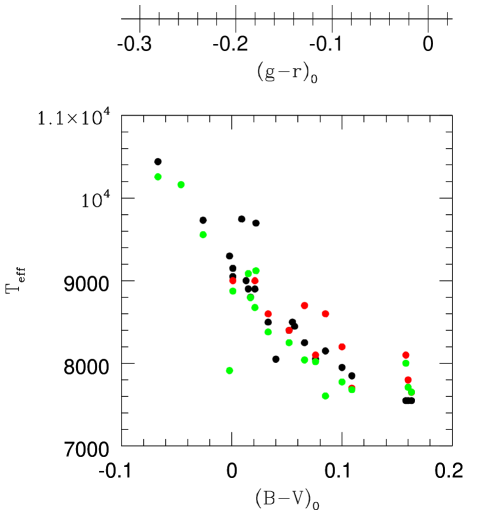
The blue horizontal branch of a globular cluster can be quite complex (e.g. as in NGC 2808 (Dalessandro et al. 2010)) and here we consider only those BHB stars with effective temperatures () less than 10,000 K (called HBA stars by Möhler (2004)). The primary criterion for selecting BHB stars is that they lie close to the Zero Age Horizontal branch (ZAHB) in a plot of g (see Fig. 5 in Behr (2003)). Fig. 6 shows a plot of for 25 local BHB stars; is taken from Kinman et al. (2000) (black circles), Behr (2003) (green circles) and For and Sneden (2010) (red circles) and the is taken from Kinman et al. (2000). This shows that the errors are substantial even when high-resolution ( 15,000) and high S/N spectra are available and these limit our ability to distinguish BHB stars from other types — especially for 10,000 K where the ZAHB and Main Sequence converge in the g plot. In this paper we use colors as surrogates for g and and calibrate these color-color plots using local bright BHB stars that have been identified by the authors referred to above.
Preston et al. (1991) identified BHB stars by their position in a plot of the gravity-sensitive index against over the range –0.020.18. This is an appropriate range of since the blue end roughly corresponds to = 10,000 K and the red end corresponds to the blue edge of the instability gap Sandage (1990). The Strömgren filter is better than the Johnson filter for use with the Johnson filter for measuring the Balmer jump. Consequently, in this paper we use the index as defined by Kinman et al. (1994) as our primary discriminant. This index was measured for 67 stars in the field. These include all those stars in the appropriate range with 15.0 except for stars 97, 104, 122, 126, 139, 148 and 162. For these latter stars we used the index as a discriminant as described by Kinman et al. (2007b).
7.1. Selection using the Plot.
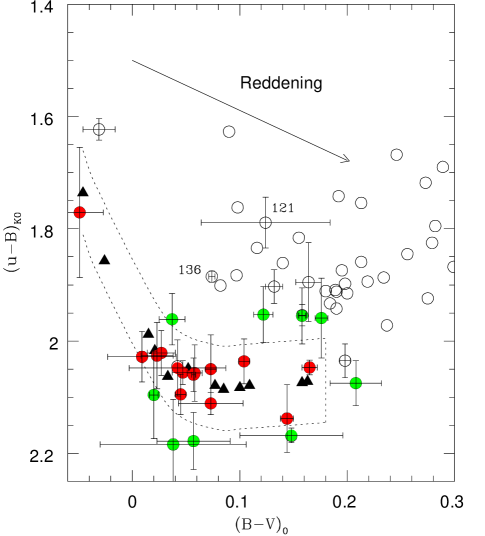
The plot is shown in Fig. 7. Here, nearby BHB stars whose classification is secure (Kinman et al. 2000; Behr 2003) are shown as filled triangles that lie on a well-defined curve. The dotted lines in Fig. 7 enclose an area in which 0.18 and is within 0.075 mag. of the curve defined by the nearby BHB stars. Stars that lie within this area are shown as red filled circles while those whose error bars lie within or very close to this area are shown as green filled circles. Error bars are also shown for the five stars (3, 27, 106, 121, & 136) for which there is some evidence that they might be BHB stars.
7.2. Selection using the plot.
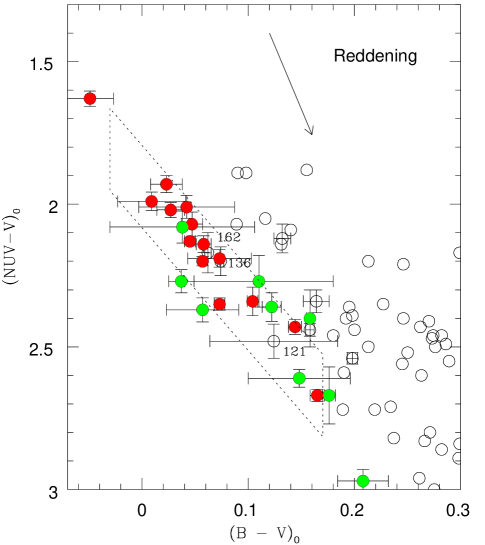
The plot is shown in Fig. 8. The dotted parallelogram (taken from Kinman et al. 2007b) shows the expected location of the BHB stars. The red and green filled circles show the stars that are in or close to the BHB location in Fig. 7; these stars also lie satisfactorily close to the defining area in Fig. 8. There are, however, three stars (121, 136 & 162) that are BHB stars according to their index although stars 121 and 136 are not BHB stars according to their index. The magnitude of star 136 is close to the saturation limit for this magnitude (Morrissey et al. 2007) so its error may have been underestimated. Its identification as a BHB star is therefore uncertain.
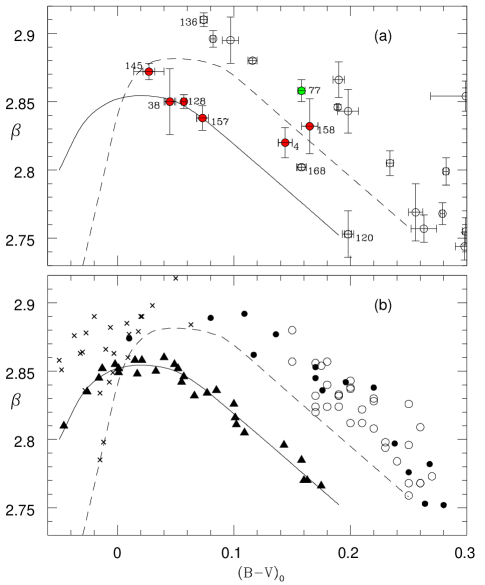

7.3. Selection using the Strömgren Plot.
The Balmer lines of BHB stars are narrower than those of higher-gravity main sequence stars of the same effective temperature and this property has been used to identify BHB stars (Searle & Rodgers, 1966; Pier, 1983). The Strömgren index can be used as a surrogate for the commonly used D0.2 width as shown in the Strömgren plot (Fig. 9b) in which the nearby BHB stars (filled circles) with +0.03+0.18 have a different location from the non-BHB stars. The data for the non-BHB stars in Fig 9(b) were taken from Crawford et al. (1972) (crosses), Gray & Garrison (1989) (open triangles) and Stetson (1991) (inverted filled triangles) while those for the nearby BHB stars were taken from Kinman et al. (2000). Fig. 9(a) shows the same plot for the brighter of our program stars for which could be measured accurately enough with a 0.9-m telescope. We use the same symbols as in Fig. 7. Four of this sample (nos. 38, 120, 128 & 157) lie on the line that defines the BHB stars — supporting this classification for them. Five (nos. 4, 77, 145, 158 and 168) lie well above the BHB line. This casts doubt on their classification as BHB stars and we discuss this further in Sec. 8.2. Star 136, whose classification as a BHB star depends upon a questionable magnitude, lies well above the BHB line (in (Fig. 9(b)) showing that its H is too broad for it to be a BHB star.
7.4. Selection using the Plot.
Brown et al. (2008) used the window –0.20 0.10 and –0.10 0.10 in making their initial selection of stars for the Century Survey. Fig. 10(a) shows the position of the local BHB stars (Kinman et al. 2000) in this diagram. These stars are concentrated in an area (outlined by the dotted rectangle) that is significantly smaller than the window (outlined by the dashed rectangle). Fig. 10(b) shows the same diagram for a sample of 24 BHB stars from the survey that have 80∘ l 100∘ and –35∘ b –55∘; these stars are also contained by the dotted rectangle (–0.10 0.15 and –0.05 0.09). This confirms that this smaller window is adequate for selecting BHB stars. Fig. 10(c) shows the position of our survey BHB candidates in this diagram. Two stars, 41 and 162 have colors that lie outside the window and consequently are hotter than the other BHB candidates.
7.5. The Selection of BHB Stars from the Candidates.
We make our final selection from the fifty four BHB candidates that are given in Table 5 where a weight is given to each star for each selection method according to the probability of its being a BHB star. For selection using and , stars in the defining box were given weight +4; those whose error bars intersected the defining box were given weight +2. Others were given weights 0 and –3 according to their distance from the defining box. For selection using Strömgren , stars on the defining line were given weight +3; others were given weight –3. For stars classified by the CHSS survey, those classified as BHB stars were given weight +4, the unclassified were given weight 0 and those with specific non-BHB classifications were given weight –4. We also included the 26 stars in the field that the survey classifies as having a high (H) or medium (M) probability of being a BHB star. Weight 0 was given for this classification.
The weights from each selection method were added to give a total weight (W) for each star. The fourteen stars with W +6 are classified BHB3 and are likely BHB stars. The seven stars with are classified BHB2 and are possible BHB stars. The remaining thirty three stars with W +2 are classified BHB1 and are unlikely to be BHB stars. The mean properties of the stars in the three classes are given in Table 6.

| Class aa BHB Class as defined in Sec. 7.5 | N bb Number of stars in class. | cc Mean for stars in class. | Range dd Range in for stars in class. | ee Mean for stars in class. | Range ff Range in for stars in class. | gg Mean [m/H] for stars in class. | Range hh Range in [m/H] for stars in class. | RVlsrii Mean radial velocity corrected to LSR for stars in class. | Range jj Range in radial velocity corrected to LSR for stars in class. |
|---|---|---|---|---|---|---|---|---|---|
| in | in | in [m/H] | km s-1 | in | |||||
| BHB3 | 14 | 13.91 | 2.69 | +0.057 | 0.198 | –1.41 | 3.00 | –10829 | 327 |
| BHB2 | 07 | 13.60 | 3.06 | +0.099 | 0.141 | –1.27 | 2.60 | –9344 | 260 |
| BHB1 | 33 | 13.43 | 4.42 | +0.148 | 0.761 | –1.13 | 2.70 | –5316 | 352 |
| Z rangeaaRange in Z. | Z bbMean value of Z. | n ccNumber of BHB stars in Field. | Area | ddMean Galactocentric Velocity with error. | eeDispersion in Galactocentric Velocity with error. |
|---|---|---|---|---|---|
| kpc | kpc | Deg2 | km s-1 | km s-1 | |
| 4 | 2.68 | 36 | 281 | +34.915.9 | 94.211.1 |
| 4 | 5.78 | 25 | 281 | +12.127.0 | 132.118.7 |
8. Discussion.
We conclude that the 14 stars that we classifed as BHB3 (Sec. 7.5) have a high probability of being BHB stars and that the 33 stars classified as BHB1 are unlikely to be BHB stars. BHB2 is an intermediate class whose nature needs clarification. The mean properties of these classes are given in Table 6; the stars in class BHB3 (the BHB stars) are fainter, bluer, more metal-poor and have a more negative radial velocity () than those in class BHB1 (the non-BHB stars). The ranges in these parameters are also smaller for the BHB stars. The Shapiro-Wilk test (Shapiro & Wilk, 1965) shows that the distribution of the BHB3 stars shows no departure from normality as we would expect for a kinematically homogeneous group, The distribution of those in BHB1, however, shows a very significant departure from normality. Evidently, the BHB1 class (non-BHB stars) contain both disk and halo stars (c.f. Fig 8. in Brown et al. (2008)).
The data in color-color plots are affected both by errors in the correction for interstellar extinction and also systematic errors in the photometric systems. It is not easy to evaluate such errors and so it is important to compare our results with those from other surveys that depend on other selection methods.
8.1. Comparison with and surveys.
The survey has 10 stars that are in the survey area. They classify 3 of them as BHB stars in agreement with our classification as BHB3. They either do not classify the remaining 7 or classify them as a type other than BHB; we call all these 7 class BHB 1. The survey covers an area of 119 deg2 in the sky between 80∘ l 100∘ and between –55∘ b –35∘. In this field they classify 24 stars as type BHB and 6 as BHB/A. The corresponding surface densities are 0.200.04 and 0.050.02 stars deg-2 respectively for the BHB and BHB/A types. In the field, the density of the class BHB3 stars is 0.190.05 stars deg-2 while that of type BHB2 is 0.090.04 stars deg-2. Although the survey extends to slightly fainter magnitudes (Fig. 11b), the BHB stars and our BHB3 stars have a similar magnitude range. There is therefore good agreement overall between the and our present survey.
The survey has 26 stars that are classified H or H: and 3 as M that are in the survey area. Only 5 of these (4 class H and 1 class M) are in our class BHB3 and so are likely to be BHB stars while 17 (15 as H and H: and 2 as M) are in class BHB1 and so are unlikely to be BHB stars. To get a larger sample of the survey in this part of the sky, we took those in the R.A. range 23:00 to 23:40 and Declination range +02∘ to +20∘. Forty stars in this region are classified as either H or H: and have a mean galactic longitude (l) of 89∘ and mean galactic latitude (b) of –47∘; they are contained in an area of 66.2 deg2. This corresponds to 0.600.10 stars deg-2 or three times the surface density of the BHB stars found by the and our survey. Some this excess may be caused by the survey having a slightly deeper limiting magnitude but it is mainly caused by the inclusion of non-BHB stars. The sample (Fig. 11(c)) contains many stars that are significantly brighter than those in the other two surveys. We conclude that only about a third to one half of the stars that classify as having a high probability of being BHB stars are actually BHB stars. This result is consistent with that of Ortiz et al. (2010) who made a spectroscopic survey of 43 stars. They found only 13 stars (30% of their sample) could be reliably identified as BHB stars, 25% could be identified as some other type and for 40% the type was uncertain. Many of the stars in their sample had 0.0 or 10,000∘ and the classification of such stars is difficult (Behr 2003).
In the Appendix C, we take larger samples of the and BHB stars and examine the probabilities that they are BHB stars given by Smith et al. (2010). Many of the stars that classify as having a high probability of being BHB stars are not in the Smith et al. catalog and are likely to be too blue for the classification to be correct.
8.2. The Ambiguous class in the present sample.
The ambiguous class (BHB2) contains stars of two types. The first type (stars 60, 92 and 162) are relatively faint ( 14) stars for which the observations have too low a weight to assign them to class BHB3. Stars 60 and 92 have large negative and are likely to be halo stars, while star 162 has a low and a location on the that differs from that of other BHB stars (Fig. 10(c)). The second type (stars 4, 120, 145, and 158 in BHB2 and 77 in BHB1) are those where the classification based on Strömgren differs from that based on and/or . These latter are brighter ( 13.2) and, except for star 145, have lowish and 0.14.
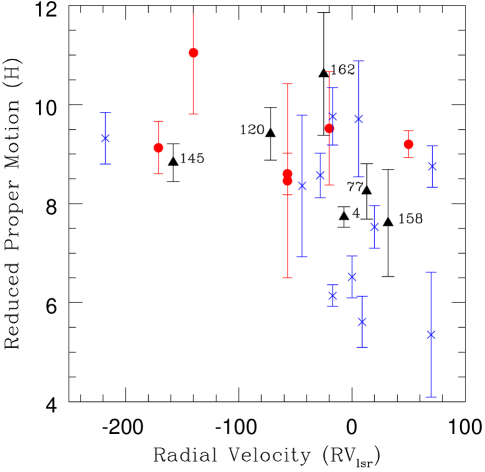
The reduced proper motion is defined (following Stetson 1981) by:
| (3) |
where is the extinction-corrected magnitude, and is the total proper motion in arcsec per year. Fig. 12 is a plot of H against the radial velocity of the 23 stars for which significant proper motions are available from the UCAC3 catalog (Zacharias 2010). The BHB stars (red filled circles) have a wide range of radial velocity but a restricted range of reduced proper motion (H). A few of the non-BHB stars (blue crosses) are also found in the same location as the BHB stars but most have a broad range in H and a smaller than the BHB stars. The ambiguous BHB2 class (black triangles) show an intermediate location and so their kinematics are as ambiguous as their other properties. We judge that among these stars, 60, 92, 120 and 145 are the most likely and 4, 77, 158 and 162 are the least likely to be BHB stars. Stars 60, 90, 120 and 145 have a mean of –118 km s-1 and so their addition to our BHB3 sample of BHB stars would only change the mean velocity to –11124 km s-1. The surface density of these 4 stars is 0.060.03 deg-2 which is similar to the surface density of 0.050.02 deg-2 for the BHB/A types of the CHSS survey.
We conclude that both the and our present survey are of similar quality. The selection criteria in both ensure that the stars which they classify as BHB stars have few interlopers. Both surveys, however, identify significant numbers of stars (25% as many as in the BHB class) that have perhaps a 50% chance of being BHB stars. The sum of the BHB and BHB/A classes will therefore be more complete but 10% of its content will be misidentified.
8.3. Disk or Inner Halo BHB stars?
8.3.1 Radial Velocities.
Radial velocity alone can be used to discriminate the population type at galactic longitudes 90∘ and 270∘, and we consider the BHB stars in several fields with these galactic longitudes. The first field contains the 26 BHB stars in the with 80∘ l 100∘ and +55∘ b +35∘. The second field contains the 24 BHB stars in the with 80∘ l 100∘ and b . The third field is the field that contains 14 BHB stars. Taking into account overlapping, there are 61 BHB stars in these fields; their mean galactocentric radial velocities and their dispersions and other properties are given in Table 7.
If a significant fraction of the BHB stars belong to the disk, we expect that BHB stars with Z 4 kpc will have more positive galactocentric radial velocities and smaller radial velocity dispersions than those with Z 4 kpc. If such an effect is present in the sample in Table 7, it is at the limit of significance. Disk BHB stars should not have a normal radial velocity disitribution. Application of the Shapiro-Wilks test to the 36 BHB stars in the Z 4 kpc and the 17 BHB stars with Z 2.5 kpc in our sample give W = 0.951 and 0.923 respectively; neither sample shows a significant departure from a normal distribution.
The evidence from the radial velocities therefore suggests that any disk component of the BHB stars must be quite small; this agrees with the previous analysis of the proper motions of BHB stars by Kinman et al. (2009). For stars with Z 4 kpc, there is some evidence that the BHB stars show slightly prograde rotation (c.f. Carollo et al. 2007444 For a criticism of this paper, however, see Schönrich et al. (2010).). but for Z4, there is no evidence for rotation; this agrees with the analysis of the motions of 1700 subdwarfs in the contiguous Stripe 82 field (Smith et al. 2009).
8.3.2 Space Densities.
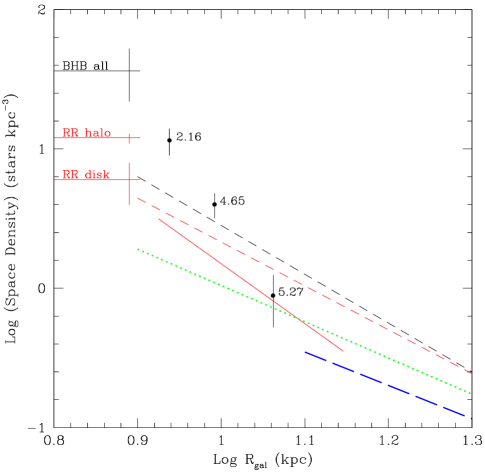
The space densities of halo stars are generally represented in terms of a power-law of the galactocentric distance (Rgal) and a flattening which may either be constant or a function of Rgal such as that introduced by Preston et al. (1991). Recent estimates of the power-law exponent and the flattening (c/a) vary quite widely (see Table 2 in Miceli et al. (2008)). The older studies tended to find steeper exponents such as the –3.2 and –3.5 for RR Lyrae stars and BHB stars respectively by Preston et al. (1991), the –3.5 found for BHB stars with Z 5 kpc by Kinman et al. (1994) and the –3.53 for RR Lyrae stars by Wetterer and McGraw (1996). More recently Miceli et al. used their RR Lyrae survey to model a spherical halo with exponents of –2.260.07 for Oosterhoff Type I RR Lyrae stars and –2.880.11 for those of Oosterhoff type II. They also found a model with variable flattening for both Oosterhoff types with an exponent of –3.150.07. A similar exponent (–3.1) was found by Vivas and Zinn (2006) from their RR Lyrae survey using a model with variable flattening that excludes regions that have pronounced overdensities. We consider the and surveys (which refer only to type RR Lyrae stars) to be the most reliable now available. The space densities have been recomputed for an RR Lyrae MV of +0.55 (as used by Vivas & Zinn) and are shown by red dashed lines in Fig. 13. The space densities are shown by a full red line in this figure. Both surveys predict a space density of 5 RR stars kpc-3 at the solar Rgal of 8.0 kpc. This is appreciably less than the observed local density for both disk and halo type RR Lyraes (142 stars kpc-3) which itself is likely to be a lower limit. About a third of these local stars are the disk RR Lyrae stars that are more metal-rich than the halo RR Lyraes and which have different kinematics, but there are still about twice as many local type RR Lyrae stars as would be predicted by the and surveys 555We noted in Sec. 4.2 that the surface densities of the RR Lyrae stars that we find in the field roughly agree with those found in the survey if we take into account that only the higher amplitude variables are found in the and surveys..
We calculate space densities () in stars kpc-3 for the BHB stars near galactic longitude 90∘ (Table 7) for three volume elements bounded by distances of 0.0, 4.0, 6.5 and 8.5 kpc in which the survey is thought to be complete. These are shown in a plot of Rgal in Fig. 13 where the mean height above the plane (Z) of each volume element is shown next to the corresponding space density. Also plotted are the space densities of the local BHB and RR Lyrae stars (Kinman et al. 2009). Fig. 13 may be compared with a similar plot (Fig. 15 in Kinman et al. 1994) where both BHB stars and RR Lyraes have comparable space densities that (for Z 5 kpc) could be represented by a spherical halo with a power law exponent of –3.5 (shown by the black dashed line in Fig. 13). De Propris et al. (2010) found exponents of –2.6 and –2.4 for spherical halo fits to the Northern and Southern fields of their BHB survey (shown in Fig. 13 by green dotted lines and long blue dashed lines for their Northern and Southern fields respectively). Their Northern field lies on the celestial equator with an R.A. between 09h 30m and 14h 30m and their Southern field covers the South Galactic Pole. The outermost point (Z = 5.27 kpc) for our sample of BHB stars near galactic longitude 90∘ is in good agreement with an extrapolation of the power-law which they fit to the space densities of their Northern field. Our two innermost points for Z = 2.16 and 4.65, however, are much larger than the predictions of these models and show that increases towards the galactic plane more steeply than they predict from analyses of stars in the outer halo; this is also shown by Kinman et al. (1994) in their Fig. 15.
We know, however, both from the kinematics of local BHB stars, from our present analysis of the radial velocities of BHB stars with galactic longitudes near 90∘, and from the proper motion analysis of stars at the North Galactic Pole (Kinman et al. 2009) that this excess of BHB stars near the plane has a disk-like spatial distribution but is largely composed of stars that have zero or low galactic rotation. We conclude that the BHB stars are revealing a spatially flattened, non-rotating “inner halo” as described by Kinman et al. (2009) and Morrison et al. (2009).
9. Conclusion.
The distribution of heliocentric radial velocites of the early-type stars in the field of Rodgers et al. (1993a) (l = 270∘, b = –45∘) does not show any evidence for the anomalous disk of faint turn-off stars found by Gilmore et al. (2002) in the same galactic location. There is a peak in these velocities, however, that corresponds to the slightly prograde galactocentric radial velocity of –30 km s-1. These stars are listed and discussed in Appendix A; it is unlikely that more than a third of these stars could be BHB stars. There is little evidence for a corresponding peak in the radial velocities in the field. The mean galactocentric radial velocity of the BHB stars near galactic longitude (l) = 90∘ that have Z 4 kpc (Table 7) may be slightly prograde but the Shapiro-Wilk test shows that this group has a normal distribution and so is likely to consist of a homogeneous group of halo stars rather than a mix of disk and halo stars. The BHB stars in Table 7 with Z 4 kpc show no rotation.
New photometry and supplementary data for the early-type stars in the field are given in Table 1 of this paper. Plots of , ( , and Strömgren are used to indicate the probability that they are BHB stars. Amongst those with the appropriate 0.20, 14 have a high probability of being BHB stars and 33 are unlikely to be BHB stars. The classification of 8 is ambiguous but further study shows that only 4 of these are likely to be BHB stars. There are 10 stars in the Century survey that are in the field; 3 are classified as BHB stars in both our and the surveys. We classify the other 7 stars as unlikely to be BHB stars and they are either given non-BHB types or are unclassified in the survey. The surface densities (stars deg-2) in both our survey of the field and that of an adjoining field show good agreement in completeness between the two surveys. This is not true of the survey where about three quarters of the 26 stars which Beers et al. (2007b) classify as likely to be BHB stars are classified by us as non-BHB stars. Smith et al (2010) have used colors to assign probabilities for stars in the release to be BHB stars. There is fair agreement betwen our classifications and these probabilities for the 5 stars in our survey that are faint enough to be included in their catalog. A comparison of the Smith et al. probabilities with a sample from the survey indicates, however, that the use of the colors alone can only isolate a sample that is about 80% pure.
Among the early-type stars in the field, we identify three type RR Lyrae variables with mean magnitudes brighter than 15 (the approximate limit of the BHB survey). New photometric and spectroscopic data are given for these stars. A fourth type ab RR Lyrae has been found in the field by Kinemuchi (2006). Its magnitude is 15. A fifth type ab field RR Lyrae of lower amplitude was found in the field by the survey but was not found by the because of confusion with brighter stars. We estimate from the survey that there should be 7 type RR Lyraes in the field or about half of the number of BHB stars.
References
- Abazajian et al. (2009) Abazajian, K. et al., 2009, ApJS, 182, 543
- Allard et al. (1994) Allard, F., Wesemael, F., Fontaine, G., Bergeron, P., Lamontagne, R. 1994, AJ, 107, 1565
- Beers (1990) Beers, T.C. 1990, AJ, 99, 323
- Beers et al. (1988) Beers, T., Preston. G., Shectman, S., 1988 ApJS, 67, 461
- Beers et al. (1996) Beers, T., Wilhelm, R., Doinidis S., Mattson, C. 1996, ApJS, 103, 433
- Beers et al. (2000) Beers, T., Chiba, M., Yoshii, Y., Platais, I. et al. 2000, AJ, 119, 2866
- Beers et al. (2007a) Beers, T., Flynn, C., Rossi, S. et al. ApJS, 168, 128
- Beers et al. (2007b) Beers, T., Almeida, T., Rossi, S., Wilhelm, R., Marstellar, B. 2007, ApJS, 168, 277
- Behr (2003) Behr, B.B. 2003, ApJS, 149, 101
- Belokurov et al. (2007) Belokurov, V,, Evans, N., Bell, E., Irwin, M., Hewitt, P. et al. 2007, ApJL, 657, L89
- Bell et al. (2010) Bell, E., Xue, X., Rix, H.-W., Ruhland, C. Hogg, D. 2010, AJ, 140, 1850
- Brown et al. (2004) Brown, W.R., Geller, M.J., Kenyon, S.J., et al. 2004, AJ, 127, 1555
- Brown et al. (2008) Brown, W.R., Beers, T.C, Wilhelm, R., Allende Prieto, C., Geller, M.J., Kenyon, S.J., Kurtz, M.J. 2008, AJ, 135, 564
- Brown et al. (2010) Brown, W.R., Geller, M.J., Kenyon, S.J., Diaferio, A. 2010 AJ, 139, 59
- Carollo et al. (2007) Carollo, D., Beers, T., Lee, Y., Chiba, M. et al. 2007, Nature, 450, 1020
- Carollo et al. (2010) Carollo, D., Beers, T., Chiba, M., Norris, J. et al. 2010, ApJ, 712, 692
- Clementini et al. (2003) Clementini, G., Gratton, R., Bragaglia, A., Carretta, E. et al. 2003, AJ, 125, 1309
- Clewley et al. (2008) Clewley. L., Warren, S.J., Hewett, P.C. et al., 2002, MNRAS, 337, 87
- Crawford et al. (1972) Crawford, D., Barnes, J., Gibson, J., Golson, J. et al. 1972, A&AS, 5, 109
- De Propris et al. (2010) De Propris, R., Harrison, C., Mares, P. 2010, ApJ., 719, 1582
- Dalessandro et al. (2010) Dalessandro, E., Salaris, M., Ferraro, F., Cassisi, S. et al., 2010, MNRAS, 410, 694
- Deason et al. (2010) Deason, A., Belokurov, V., Evans, N. 2010, MNRAS tmp 1761D (astro-ph 1008.3067)
- Eggen (1968) Eggen, O.J., 1968, ApJS, 16, 97
- Eggen & Greenstein (1965) Eggen, O.J., Greenstein, J.L., 1965, ApJ, 141, 83
- For & Sneden (2010) For, B-Q., Sneden, C. 2010, AJ, 140, 1694
- Gettel et al. (2006) Gettel, S., Geske, M., McKay, T., 2006, AJ, 131, 621
- Gilmore et al. (2002) Gilmore, G., Wyse, R., Norris, J.E. 2002, ApJL, 574, L39
- Goranskij (1986) Goranskij, 1986, Perem. Zvezdy. Byull., 22, 353
- Gray & Garrison (1989) Gray, R., Garrison, R. 1989, ApJS, 70, 623
- Horne & Baliunas (1986) Horne, J., Baliunas, S. 1986, ApJ, 302, 757
- Kinemuchi et al. (2005) Kinemuchi, K., Smith, H., Woźniak, P., McKay, T., 2006, AJ, 132, 1202
- Kinman & Carretta, (1992) Kinman, T.D., Carretta, E. 1992 PASP, 104.111
- Kinman et al., (1994) Kinman, T.D., Suntzeff, N.B., Kraft, R.P., 1994, AJ, 108, 1722
- Kinman et al., (1996) Kinman, T.D., Pier, J.R., Suntzeff, N.B. et al. 1996, AJ, 111, 1164
- Kinman et al., (2000) Kinman, T.D., Castelli, F., Cacciari, C., et al. 2000, A&A, 364, 102
- (36) Kinman, T.D., Cacciari, C., Braggaglia, A., Buzzoni, A., Spagna, A. 2007a, MNRAS, 375, 1381
- (37) Kinman, T.D., Salim, S., Clewey, L., 2007b, ApJL, 662, L111
- Kinman et al., (2009) Kinman, T.D., Morrison, H.L., Brown, W.R. 2009, AJ, 137, 3198
- Kinman & Brown, (2010) Kinman, T.D., Brown, W.R. 2010, AJ, 139, 2014
- Knude, (1997) Knude, J. 1997, A&A. 327, 90
- Kondo et al., (1982) Kondo, M., Watanabe, E., Yutani, M., Noguchi, T. 1982, PASJ, 34, 541
- Landolt, (1992) Landolt, A. 1992, AJ, 104, 340
- Lasker et al., (1990) Lasker, B., Sturch, C., McClean, B., Russell, J., Jenkner, H., Shara, M, 1990, AJ, 99, 2019
- Lasker et al., (2008) Lasker, B., Lattanzi, M., McClean, B. et al., 2008, AJ, 136, 735
- Liu, (1991) Liu, T. 1992, PASP, 103, 205
- Miceli et al., (2008) Miceli. A., Rest, A., Stibbs, C., Hawley, S. et al. 2008, ApJ., 678, 865 (LONEOS Survey)
- Minchev et al., (2009) Minchev, I., Quillen, A., Williams, M. Freeman, K., et al. 2009, MNRAS, 396, 56
- Möhler, (2004) Möhler, S. 2004 in IAU Symposium, Vol. 224, The A-Star Puzzle, ed. J. Zverko, J. Ziznovsky, S.J.Adelman, W.W.Weiss, 395-402
- Monet et al., (2003) Monet, D., Levine, S., Casian, B. et al. 2003, AJ, 125, 984 (USNO-B 1.0 catalog)
- Morrison et al., (2009) Morrison, H., Helmi, A., Sun, J., Liu, P. et al. 2009, ApJ, 694, 130
- Morrissey et al., (2007) Morrissey, P., Conrow, T., Barlow, T., Small, T. 2007, ApJS, 173, 682
- Navarro et al., (2004) Navarro, J., Helmi, A., Freeman, K. 2004, ApJL, 601, L43
- Norris et al., (1999) Norris, J., Ryan, S., Beers, T. 1999, ApJS, 123, 639
- Ortiz, et al., (2010) Ortiz, R., Wilhelm, R., Costa, R., Rossi, S. et al., AJ, 139, 1031
- Pier, (1983) Pier, J.R. 1983, ApJS, 53, 507
- Pojmański, (2002) Pojmański, G. 2002, Acta Astr., 52, 397
- Preston, (1959) Preston, G.W. 1959, ApJ, 130, 507
- Preston et al., (1991) Preston, G.W., Shectman, S.A., Beers, T.C., 1991, ApJ, 375, 121
- Preston et al., (1994) Preston, G.W., Beers, T.C., Shectman, S.A. 1994, AJ, 108, 538
- Reid & Brunthaler, (2004) Reid, M., Brunthaler, A. 2004 ApJ, 616, 872
- Rodgers, (1971) Rodgers, A. 1971, ApJ, 165, 581
- (62) Rodgers, A., Roberts, W., Walker, I., 1993a, AJ , 106, 591
- (63) Rodgers, A., Roberts, W., 1993b, AJ , 106, 1839
- (64) Rodgers, A., Roberts, W., 1993c, AJ , 106, 2294
- Sandage, (1990) Sandage, A.R., 1990, ApJ, 350, 603
- Sandage, (2004) Sandage, A.R., 2004, AJ, 128, 858
- Schönrich et al., (2010) Schönrich, R., Asplund, M., Casagrande, L. 2010, astro-ph 1012.0842
- Searle & Rodgers, (1966) Searle, L., Rodgers, A. 1966, ApJ, 143, 809
- Shapiro & Wilk, (1965) Shapiro, S., Wilk, M. 1965, Biometrika, 52, 591
- Schlegel et al., (1998) Schlegel, D., Finkbeiner, D. & Davis, M., 1998, ApJ, 500, 525
- Smith, et al., (2009) Smith, M., Evans, N., Belokurov, V., Hewitt, P. 2009, MNRAS, 399, 1223
- Smith, et al., (2010) Smith, K., Bailer-Jones, C., Klement, R., Xue, X., 2010, A&A, 522, 88
- Stetson, (1981) Stetson, P., 1981, AJ, 86, 1337
- Stetson, (1991) Stetson, P., 1991, AJ, 102, 589
- Suntzeff et al., (1994) Suntzeff, N., Kraft, R., Kinman, T., 1994, ApJS, 93, 27
- Tody & Davis, (1992) Tody, D., Davis, L. 1992, ASP Conf. Ser. 25, Astronomical Data Analysis Software & Systems I, ed. D. Worrall, C. Biemesderfer, & J. Barnes (San Francisco: ASP), 484
- Watkins et al., (2009) Watkins, L., Evans, N., Belokurov, V., Smith, M., Hewitt, P. 2009, MNRAS, 398. 1757
- Wegner, (1983) Wegner, G. 1983, AJ, 88, 109
- Wegner et al., (1990) Wegner, G., Africano, J., Goodrich, B., 1990, AJ, 99, 1907
- Wetterer, et al., (1996) Wetterer, C., McGraw, J., Hess, T. Grashuis, R. 1996, AJ, 112, 742
- Wils et al., (2006) Wils, P., Lloyd, C., Bernhard, K. 2006, MNRAS, 368, 1757
- Woźniak et al., (2004) Woźniak, P., Vestrand, W., Akerlof, C., Balsano, R. et al., 2004, AJ, 127, 2436 ()
- Vivas & Zinn, (2006) Vivas, A.K., Zinn, R. 2006, AJ, 132, 714 (QUEST Survey)
- Xue et al., (2008) Xue, X., Rix, H.-W., Zhao, G., Re Fiorentin, P. et al., 2008, ApJ, 684, 1143
- Zacharias et al., (2010) Zacharias N., Finch, C., Girard, T. Hambly, N., Wycoff, G. et al. 2010, AJ, 139, 2184 (UCAC3 Catalog)
Appendix A The Southern Field of Rodgers et al. (1993a).
Fig. 14 shows the distribution of galactocentric radial velocities (Vgal) for the early type stars in the field (above) and field (below). Vgal was calculated from the heliocentric radial velocity Vhel following Xue et al. (2008)666In this paper we adopt a solar galactocentric distance of 8.0 kpc (Reid & Brunthaler 2004) but an LSR circular velocity velocity of 220 km s-1 rather than their somewhat higher value of 23615 km s-1 to maintain compatibility with other recent work.:
| (A1) |
The field has the same galactic coordinates (l,b) = (270,–45) as the field of Gilmore et al. (2002) but does not show evidence for an anomalous disk in its radial velocity distribution. The field does, however, show a peak around +125 km s-1 in its velocity distribution. This shows up as a peak around –30 km s-1 in its galactocentric radial velocity distribution. A similar peak may be present at +30 km s-1 in the field but it is certainly much less pronounced than the peak in the field.

There are 24 stars in the field in the velocity range that covers this peak (–05Vgal–50 km s-1). They are listed in Table 8 with their proper motions and positions taken from the catalog (Zacharias et al. 2010). This table gives the reduced proper motion (H) (defined by equation (3) in Sec. 8.2) for each star. We know from our study of the BHB stars in the field that BHB stars have an H that is roughly in the range 8.5 to 11.5. There are 8 to 10 stars in this range (depending on whether one also takes the Ca ii K- line equivalent width into account). This is an upper limit to the number of BHB stars in this velocity range because non-BHB stars can also have H in this range. We conclude that the peak at –30 km s-1 in Vgal must primarily be caused by non-BHB stars.
| No. aaNumber from Rodgers et al. (1993) | ID bbID from Rodgers et al. (1993) | RA | Dec | RVlsr ccRadial Velocity corrected to LSR from Rodgers et al. (1993a). | RVgal ddGalactocentric Radial Velocity. | eeProper Motion in R.A. from UCAC3 (Zacharias et al. 2010) | ffProper Motion in Dec. from UCAC3 (Zacharias et al. 2010) | H ggReduced Proper Motion (Equation (3) in Sec 8.2). | ST hhSpectral Type from Rodgers et al. (1993a). | ii magnitude from Rodgers et al. (1993a). | W0(K) jjCa ii K-line Eq. Width corrected for an interstellar component according to Rodgers et al. (1993a). | W(H) kkH Eq. Width from Rodgers et al. (1993a). |
|---|---|---|---|---|---|---|---|---|---|---|---|---|
| (2000J) | (2000J) | km s-1 | km s-1 | (mas) | (mas) | (mag.) | Å | Å | ||||
| 001 | P83l–10 | 03:08:48.54 | –67:51:28 | +113 | –29 | +18.41.8 | –34.0 1.8 | 12.3 | A2 | 14.5 | 1.4 | 11.4 |
| 011 | P83l–16 | 03:15:09.98 | –66:07:50 | +115 | –27 | +04.22.8 | –09.1 2.8 | 09.9 | A1 | 15.2 | 0.2 | 22.4 |
| 027 | P83l–18 | 03:21:19.12 | –66:18.06 | +109 | –35 | +07.72.8 | +04.4 2.5 | 08.6 | A4 | 14.2 | 3.3 | 13.6 |
| 029 | P83s–44 | 03:22:34.13 | –63:39:46 | +102 | –40 | +01.81.7 | –43.4 1.7 | 11.4 | F3 | 13.3 | 5.6 | 6.6 |
| 030 | P83l–19 | 03:22:37.99 | –66:21:33 | +123 | –21 | +06.52.8 | +01.5 3.4 | 08.4 | A0 | 15.0 | 1.4 | 25.0 |
| 050 | P117l–10 | 03:26:30.21 | –60:18:49 | +120 | –19 | +12.013.2 | –18.9 2.0 | 10.5 | A0 | 14.3 | 0.0 | 17.9 |
| 053 | P117l–22 | 03:26:57.10 | –58:04:26 | +107 | –30 | +33.42.4 | +23.2 2.5 | 13.0 | A0 | 15.1 | 2.3 | 15.3 |
| 072 | P83l–54 | 03:31:38.22 | –64:07:37 | +134 | –11 | +05.92.5 | –06.0 2.5 | 09.4 | A0 | 15.1 | 0.7 | 15.0 |
| 077 | P117l–12 | 03:33:28.30 | –59:40:29 | +097 | –44 | +03.32.3 | +02.1 2.2 | 06.3 | A4 | 14.6 | 3.2 | 11.8 |
| 080 | P117l–30 | 03:34:34.82 | –57:49:17 | +098 | –41 | +07.51.8 | –01.1 1.7 | 09.2 | A0 | 15.0 | 0.0 | 16.2 |
| 081 | P83l–77 | 03:34:21.13 | –62:05:56 | +117 | –27 | –00.12.3 | –02.9 1.8 | 7 | A2 | 15.0 | 2.4 | 17.5 |
| 091 | P83l–76 | 03:39:22.53 | –63:28:58 | +109 | –37 | +08.92.0 | –07.4 2.1 | 10.4 | A1 | 15.2 | 1.0 | 21.3 |
| 093 | P83l–73 | 03:42:02.58 | –63:18:57 | +111 | –36 | +03.82.0 | +04.6 1.6 | 07.9 | A0 | 14.3 | 0.3 | 16.9 |
| 099 | P117l–35 | 03:44:57.82 | –56:41:52 | +123 | –19 | +06.22.5 | –03.0 6.6 | 8 | A0 | 14.7 | 0.7 | 15.4 |
| 106 | P117s–20 | 03:45:56.92 | –61:19:11 | +104 | –42 | +23.21.2 | +08.8 1.8 | 08.8 | A0 | 11.9 | 0.0 | 16.5 |
| 111 | P83l–70 | 03:47:10.41 | –63:17:27 | +125 | –23 | –05.41.4 | +00.6 1.4 | 06.8 | A1 | 13.4 | 0.0 | 9.4 |
| 129 | P117l–44 | 03:52:18.28 | –59:25:24 | +112 | –35 | +12.05.8 | –19.7 5.8 | 10.3 | A1 | 13.7 | 0.4 | 13.4 |
| 145 | P83l–29 | 03:58:00.27 | –66:27:09 | +104 | –49 | +02.24.4 | +00.8 2.5 | 8 | A0 | 15.3 | 0.0 | 15.5 |
| 147 | P83s–23 | 03:58:12.55 | –66:29:41 | +103 | –50 | +20.71.2 | +03.8 1.0 | 08.4 | A4 | 11.9 | 2.1 | 16.9 |
| 159 | P83l–37 | 04:00:43.48 | –64:15:34 | +134 | –19 | +00.32.2 | +01.1 2.4 | 7 | A0 | 14.8 | 0.6 | 16.0 |
| 167 | P117l–66 | 04:04:19.67 | –59:47:24 | +130 | –21 | +08.01.2 | –00.7 1.5 | 06.6 | A0 | 12.2 | 0.0 | 11.9 |
| 180 | P83l–38 | 04:05:42.79 | –64:26:47 | +142 | –12 | +04.81.8 | –02.9 1.8 | 07.3 | A2 | 13.9 | 0.0 | 17.2 |
| 182 | P83l–31 | 04:07:05.52 | –65:34:30 | +126 | –29 | +06.52.5 | –00.6 2.6 | 08.9 | A1 | 15.3 | 0.3 | 15.3 |
| 184 | P83l–36 | 04:07:26.79 | –64:44:57 | +109 | –46 | –01.62.4 | +01.6 7.0 | 8 | A1 | 15.0 | 0.3 | 16.3 |
Appendix B Additional Data for Stars in the Field.
B.1. Improved positions for the fainter stars in the Field.
The positions given in Rogers et al. (1993a) are generally good to a few arcsec and therefore adequate for identification. A number of the fainter stars, however, had poorer positions and the coordinates of them (taken form the USNO-B 1.0 catalog (Monet et al. 2003)) are given in Table 9.
| No. | ID | RA (2000J) | Dec (2000J) |
|---|---|---|---|
| 18 | Pn23l1–11 | 23:11:23.8 | +09:58:46 |
| 25 | Pn23s1–13 | 23:12:21.6 | +10:47:03 |
| 60 | Pn24l–42 | 23:18:13.1 | +08:38:08 |
| 63 | Pn23l2–2 | 23:18:34.5 | +13:51:26 |
| 72 | Pn23l2–4 | 23:20:07.8 | +12:37:47 |
| 75 | Pn24l–13 | 23:20:47.0 | +05:11:43 |
| 83 | Pn24l–16 | 23:21:47.7 | +07:50:56 |
| 87 | Pn23l2–35 | 23:22:20.8 | +12:06:59 |
| 89 | Pn23l1–28 | 23:22:25.8 | +11:47:56 |
| 92 | Pn23l1–29 | 23:22:34.1 | +12:05:08 |
| 104 | Pn23l2–58 | 23:24:38.2 | +07:51:02 |
| 121 | Pn23l2–27 | 23:26:25.2 | +12:46:19 |
| 122 | Pn23l2–55 | 23:26:37.9 | +08:35:26 |
| 123 | Pn24l–24 | 23:26:37.7 | +08:36:10 |
| 124 | Pn24l–21 | 23:26:44.6 | +06:17:42 |
| 138 | Pn24l–5 | 23:28:47.9 | +05:14:55 |
B.2. The Survey.
Beers et al. (2007b) list a number of BHB candidates in the area of sky of the survey that are not listed by Rodgers et al. (1993a). They are mostly either too faint or too red to have been included in the survey; they are listed in Table 10.
| ID aaID from Beers et al. (1988) | bbDereddened magnitude from from Beers et al. (2007b) | ccDereddened magnitude from from Beers et al. (2007b) | RA (2000J) | Dec (2000J) | ProbabilityddProbability that candidate is BHB star (Beers et al. (2007b) (H = High; M = Medium; L = Low) |
|---|---|---|---|---|---|
| BPS | (mag.) | (mag.) | |||
| CS 30338–100 | 13.96 | 0.637 | 23:13:51.5 | +09:27:25 | L |
| CS 30338–104 | 15.09 | 0.050 | 23:14:14.5 | +11:10:33 | H |
| CS 30338–097 | 13.78 | 0.464 | 23:15:54.0 | +07:43:14 | L: |
| CS 30338–098 | 12.13 | 0.490 | 23:17:05.0 | +07:41:15 | L |
| CS 30338–091 | 15.54 | –0.020 | 23:17:11.4 | +09:55:49 | H |
| CS 30338–081 | 13.75 | 0.501 | 23:18:01.9 | +08:40:17 | L |
| CS 30338–053 | 14.19 | 0.365 | 23:21:21.4 | +07:20:35 | M |
| CS 30338–059 | 13.84 | 0.564 | 23:23:02.7 | +10:19:28 | L |
| CS 30338–061 | 14.02 | 0.779 | 23:23:14.9 | +11:54:30 | L |
| CS 30338–047 | 12.81 | 0.416 | 23:25:21.8 | +10:41:15 | L |
| CS 30338–028 | 14.62 | 0.674 | 23:25:29.3 | +08:59:50 | L |
| CS 30338–033 | 14.80 | 0.551 | 23:25:57.6 | +09:45:54 | L |
| CS 30338–015 | 15.73 | 0.103 | 23:28:12.3 | +10:59:47 | H |
| CS 30338–005 | 12.45 | 0.717 | 23:31:02.7 | +08:34:51 | L |
| CS 29522–103 | 13.54 | 0.487 | 23:32:02.1 | +10:52:13 | L |
| CS 31088–091 | 14.56 | –0.052 | 23:33:58.1 | +04:03:58 | H |
| CS 30333–112 | 14.76 | 0.399 | 23:34:34.4 | +09:08:25 | M |
| CS 30338–100 | 13.96 | 0.637 | 23:28:47.9 | +05:14:55 | L |
B.3. Miscellaneous Data for Stars in the field from Rodgers et al. (1993b).
The spectrophotometry and radial velocities of the stars with spectral types earlier than F0 given in Table 1 of Rodgers et al. (1993b) are available electronically but may not be easily accessible to all readers. We have therefore reproduced these data for the field in Table 11. The table also includes metallicities [m/H] for these stars that have been recomputed assuming that the interstellar component of the Ca ii K-line has an equivalent width of 0.3 Å.
| No. | Object | W0(K) aa Equivalent width of Ca ii K line with 0.6 Å correction for interstellar component from Rogers et al. (1993b) Table 1. | W(H) bb Equivalent width of H line from Rogers et al. (1993b) Table 1. | RVLSR cc Radial velocity corrected to LSR from Rogers et al. (1993b) Table 1 or our adopted values (boldface). | [m/H] ddApproximate metallicity derived from plot of W(K)0 and as described in Sec. 6.1; interstellar correction 0.6 Å. | [m/H] eeApproximate metallicity derived from plot of W(K)0 and as described in Sec. 6.1; interstellar correction 0.3 Å. | |
|---|---|---|---|---|---|---|---|
| Å | Å | km s-1 | |||||
| 002 | Pn23l2–18 | 2.8 | 18.5 | +007 | 0.176 | –1.0 | –0.8 |
| 003 | Pn23s1–15 | 0.0 | 15.0 | –211 | –0.026 | –3.0 | –2.0 |
| 004 | Pn24l–37 | 1.7 | 17.2 | +020 | 0.131 | –1.4 | –1.2 |
| 007 | Pn24l–46 | 3.1 | 16.5 | –074 | 0.245 | –1.3 | –1.1 |
| 010 | Pn24l–47 | 1.1 | 18.3 | +020 | 0.140 | –1.9 | –1.6 |
| 015 | Pn24l–32 | 2.3 | 16.4 | –204 | 0.04: | +0.0 | 0.0 |
| 017 | Pn23s1–2 | 2.6 | 11.6 | 000 | 0.171 | –1.0 | –0.8 |
| 020 | Pn24l–35 | 2.6 | 15.7 | –005 | 0.203 | –1.3 | –1.1 |
| 024 | Pn24l–34 | 5.6 | 15.2 | –026 | 0.192 | 0.0 | 0.0 |
| 027 | Pn24l–48 | 1.6 | 18.3 | +078 | 0.164 | –1.6 | –1.5 |
| 030 | Pn24l–50 | 0.00 | 15,6 | –220 | –0.049 | –3.0 | –2.0 |
| 034 | Pn23l2–9 | 4.4 | 19.6 | +003 | 0.237 | –0.5 | –0.3 |
| 037 | Pn24l–49 | 3.1 | 12.9 | +021 | 0.245 | –1.3 | –1.1 |
| 038 | Pn24l–51 | 0.0 | 16.2 | –164 | 0.039 | –3.0 | –2.2 |
| 041 | Pn23l2–14 | 0.0 | 19.8 | –270 | 0.023 | –3.0 | –2.2 |
| 048 | Pn24l–45 | 0.9 | 21.5 | –114 | 0.020 | –1.2 | –0.8 |
| 050 | Pn24l–31 | 1.8 | 19.1 | –089 | 0.155 | –1.5 | –1.3 |
| 052 | Pn23l2–63 | 3.9 | 14.5 | –154 | 0.246 | –0.9 | –0.7 |
| 053 | Pn24l–30 | 1.3 | 18.1 | –021 | 0.135 | –1.7 | –1.4 |
| 059 | Pn24l–43 | 5.6 | 15.8 | –032 | 0.219 | 0.0 | 0.0 |
| 060 | Pn24l–42 | 0.0 | 20.8 | –208 | 0.057 | –3.0 | –2.6 |
| 063 | Pn23l2–2 | 3.0 | 20.5 | –038 | 0.184 | –1.0 | –0.7 |
| 065 | Pn24l–52 | 3.6 | 21.2 | +043 | 0.200 | –0.6 | –0.4 |
| 072 | Pn23l2–4 | 3.6 | 19.8 | +009 | 0.280 | –1.2 | –1.3 |
| 077 | Pn24l–15 | 2.3 | 20.8 | +001 | 0.160 | –1.2 | –0.9 |
| 079 | Pn24l–14 | 0.0 | 13.6 | +014 | –0.049 | –3.0 | –2.0 |
| 081 | Pn24s–15 | 0.5 | 17.7 | +035 | 0.082 | –2.2 | –1.8 |
| 083 | Pn24l–16 | 1.2 | 25.6 | –106 | 0.090 | –1.5 | –1.2 |
| 085 | Pn23l2–37 | 2.9 | 22.9 | –027 | 0.102 | +0.0 | +0.0 |
| 087 | Pn23l2–35 | 0.0 | 19.6 | –273 | +0.5:: | ||
| 090 | Pn23l2–36 | 0.1 | 15.5 | –020 | –0.062 | –3.0 | –1.5 |
| 092 | Pn23l1–29 | 1.0 | 20.1 | –220 | 0.037 | –1.3 | –1.0 |
| 094 | Pn23l2–33 | 2.2 | 8.2 | –065 | 0.4: | ||
| 095 | Pn23s2–20 | 4.6 | 18.3 | +002 | 0.191 | +0.0 | +0.0 |
| 099 | Pn23l2–22 | 1.6 | 13.6 | –213 | 0.105 | –1.3 | –1.0 |
| 100 | Pn23s2–28 | 4.0 | 15.1 | –012 | 0.189 | –0.3 | +0.0 |
| 103 | Pn23s2–17 | 2.9 | 12.7 | 000 | 0.234 | –1.4 | –1.2 |
| 104 | Pn23l2–58 | 0.1 | 17.2 | –265 | 0.114 | –3.0 | –2.7 |
| 106 | Pn24l–10 | 3.2 | 17.3 | +078 | 0.131 | –0.3 | +0.0 |
| 110 | Pn23l2–28 | 0.1 | 19.7 | –054 | 0.047 | –3.0 | –2.2 |
| 111 | Pn24l–17 | 4.9 | 13.1 | –016 | 0.213 | +0.0 | +0.0 |
| 112 | Pn24s–17 | 4.7 | 13.1 | –019 | 0.256 | –0.4 | –0.2 |
| 113 | Pn24l–2 | 3.0 | 15.7 | –093 | 0.213 | –1.1 | –0.9 |
| 115 | Pn24l–55 | 0.3 | 17.8 | –132 | 0.042 | –2.4 | –1.8 |
| 116 | Pn24s–3 | 2.2 | 17.0 | –009 | 0.193 | –1.5 | –1.3 |
| 120 | Pn24l–56 | 1.8 | 13.4 | –064 | 0.198 | –1.7 | –1.6 |
| 121 | Pn23l2–27 | 1.4 | 22.4 | –019 | 0.124 | –1.6 | –1.4 |
| 127 | Pn24l–19 | 3.8 | 17.0 | –091 | 0.250 | –1.0 | –0.8 |
| 128 | Pn23l2–30 | 0.4 | 16.5 | +058 | 0.057 | –2.2 | –1.8 |
| 133 | Pn23l2–26 | 1.1 | 17.8 | –001 | 0.176 | –2.0 | –1.8 |
| 134 | Pn24l–8 | 3.0 | 15.2 | –126 | 0.148 | –0.6 | –0.4 |
| 136 | Pn24s–8 | 0.6 | 18.2 | +031 | 0.074 | –2.0 | –1.6 |
| 138 | Pn23s1–19 | 1.4 | 17.3 | –009 | 0.101 | –1.4 | –1.2 |
| 140 | Pn23l2–53 | 2.8 | 16.1 | –042 | 0.265 | –1.5 | –1.3 |
| 141 | Pn24l–22 | 1.9 | 13.8 | –117 | 0.207 | –1.7 | –1.5 |
| 143 | Pn23l2–39 | 1.3 | 15.5 | +017 | 0.116 | –1.5 | –1.4 |
| 145 | Pn24l–4 | 1.4 | 16.9 | –150 | 0.027 | –0.5 | –0.2 |
| 146 | Pn24l–27 | 2.4 | 19.5 | –049 | 0.058 | +0.0 | +0.0 |
| 147 | Pn23l2–25 | 1.4 | 21.8 | –092 | 0.131 | –1.6 | –1.4 |
| 148 | Pn24l–26 | 3.7 | 20.2 | –046 | 0.089 | 0.0 | 0.0 |
| 151 | Pn24l–6 | 1.3 | 17.8 | +047 | –0.017 | 0.0 | 0.0 |
| 156 | Pn23l–40 | 1.8 | 15.5 | –098 | 0.299 | –2.0 | –1.9 |
| 157 | Pn23l1–39 | 1.4 | 16.2 | –049 | 0.075 | –1.2 | –1.0 |
| 158 | Pn24l–28 | 4.1 | 19.0 | +042 | 0.165 | 0.0 | +0.0 |
| 161 | Pn24s–23 | 2.5 | 18.1 | –036 | 0.234 | –1.5 | –1.3 |
| 162 | Pn24l–29 | 0.0 | 17.4 | –017 | 0.062 | –3.0 | –2.3 |
| 163 | Pn23l2–43 | 2.3 | 17.0 | +010 | 0.227 | –1.5 | –1.4 |
| 165 | Pn24s–55 | 1.3 | 13.4 | –159 | 0.246 | –2.3 | –2.0 |
| 168 | Pn24s–60 | 2.8 | 18.5 | +028 | 0.158 | –0.8 | –0.6 |
| 169 | Pn23l2–45 | 0.2 | 13.9 | –012 | 0.047 | –3.0 | –2.0 |
Appendix C Comparisons between Surveys for BHB Stars.

C.1. BHB Stars selected in the Survey.
The survey (Beers et al. 2007b) used 2MASS magnitudes to derive magnitudes and colors for stars taken from the objective prism survey of Beers et al. (1988, 1996). The stars for which they derived –0.20 +0.20 were given a high (H) probability of being BHB stars. Those with +0.20 +0.40 were given a medium (M) probability and redder stars were assigned a low (L) probability. The survey overlaps 50% of the area of the survey. We measured and for 23 of the stars in this area. Fig. 15(a) and 15(b) show plots of our and against the corresponding values. The error of 0.14 mag that give for their magnitudes seems realistic for stars with 14.0 but may be an underestimate for fainter stars. The error of 0.08 mag that quote for their is in good agreement with the error of 0.09 mag that we estimate from the scatter in Fig. 15(b). Even so, we find that 20% to 25% of the stars for which give +0.20 are actually redder than = 0.20 and so are unlikely to be BHB stars.
The survey has 45 stars in the region of overlap with the survey. give 26 of these stars a high probability (H) and 3 a medium probability (M) of being BHB stars. Fig 10(d) shows the plot for the 26 stars that consider having a high (H) probability of being BHB stars. Four of these (41, 56, 122 and 162) lie outside the defining window while the color errors of star 87 are too large for it to be selected using 2MASS colors. The remaining 17 stars (those in the sky covered by the survey but not given in Table 1) are given in Table 10 in Appendix B; they are mostly stars that are either too faint or too red to have been discovered by Rodgers et al. (1993a).
C.2. BHB Stars selected in the Survey.
The Century Halo Star Survey () (Brown et al. 2008) used colors to make a preliminary selection of BHB candidates and then made a further selection using data derived from slit spectra taken with the FAST spectrograph of the Whipple 1.5-m telescope. (2.3Å resolution, 3450—5450 Å). This additional use of spectra not only makes their classification much more secure than that of the survey but also provides metallicities and radial velocities. The survey overlaps 30% of the field and has 12 stars in this area. Ten of these are listed in the survey and given in Table 1. Three of these (CHSS 3068, CHSS 3071 & CHSS 3075 corresponding to stars 99, 110 and 157 in the ) were also classified by them as BHB stars. The other seven were classified otherwise. Of the two stars in the field that were not found by Rodgers et al. (1993a), CHSS 3069 is not a BHB star and CHSS 3078 is classed as a BHB star but is too faint ( 15.5) to be in the survey.
C.3. BHB Stars selected by Smith et al. (2010) from DR7 of the .
DR7 intersects the field with Stripes 76 and 79 but only five of our BHB candidates are faint enough to be included in this catalog. We classify stars 99 and 110 as BHB3 (likely to be BHB stars) and Smith et al. give these relatively high probabilities of 0.756 and 0.831 of being BHB stars. We classify 63, 148 and 163 as BHB1 (unlikely to be BHB stars); these are given lower probabilities of 0.704, 0.261 and 0.123 respectively. Star 63 (for which Smith et al. give a probability of 0.704 that it is a BHB star) is CHSS 3064 and is unclassified in the survey.

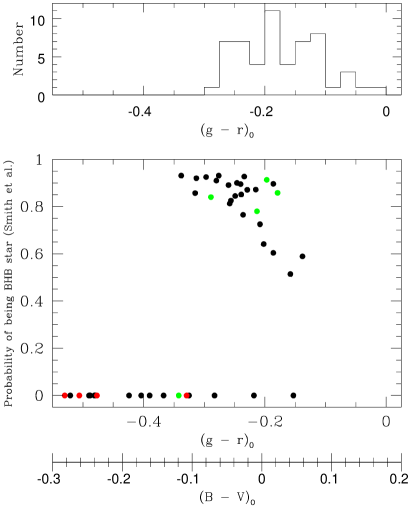
We compare the and Smith et al. surveys with a sample of stars with 2MASS 15.0. This sample contained 99 stars for which both classes and Smith et al. probabilities (P) were available. Histograms showing the distribution of Smith et al. probabilities among the classes are shown in Fig 16. For the BHB class, 39 stars have P 0.8 and 9 have P 0.8. For the BHB/A class, 15 stars have P 0.8 and 6 have P 0.8. For the A class, 7 stars have P 0.8 and 23 have P 0.8. By taking the “cut” at P = 0.80, we maximize the agreement for both class BHB and class A; in this case we find 80% agreement between the two catalog. If we lower the “cut” to a lower P to increase the agreement with the BHB class we would include more stars that classify as A class (A-type stars).
We make a similar comparison with the B2M catalog for a sample of stars with 2MASS 15.0. In Fig. 17 the probability (P) from Smith et al. is shown for these stars as a function of the SDSS color with those classed H (black), H: (red) and M (green). Of these 46 stars, 21 have P 0.80 and 18 have been given P = 0.0 since they are in the DR7 catalog but not in the Smith et al. catalog. Fig. 17 also shows the color distribution of a small random sample of the stars in the Smith et al. catalog that have P 0.8; they cover the range –0.30 0.00 (equivalent to –0.1 +0.20). The catalog BHB stars have a quite different color distribution and are all bluer than = –0.14 (or = +0.05). This confirms our earlier conclusion that many of the stars in the catalog with an H classification may not be BHB stars.
Appendix D The Correction for the Interstellar Ca ii K line.

The equivalent width W0(K) of the Ca ii K line given by Rodgers et al (1993b) used a constant correction of 0.6 Å for the interstellar component. Beers (1990) has given the following expression for the strength of the interstellar K line:
| (D1) |
where = 0.192 Å, is the height in parsecs above the plane, is a scale height (1081 pc) and is the galactic latitude. According to this expression, the maximum equivalent width of the interstellar K line at galactic latitude 45∘ is 0.27 Å. There are six stars in Table 1 of Beers (1990) that are in the galactic longitude range 75∘ to 105∘ and the galactic latitude range –30∘ to –60∘; they have a mean of 0.230.06Å and a mean of 3965 pc.
We might also expect some correlation between and the reddening E. Fig. 18 is a plot between these quantities for stars whose height above the galactic plane is greater than 1 kpc. The W(K) are taken from Table 1 of Beers (1990) and the E from Schlegel et al. (1998). The stars in Table 11 have E in the range 0.04 to 0.14 with a mean value of 0.068. The correlation between and E is too weak to make it worth computing individually for each E. On the other hand, a mean value of of 0.3 Å is clearly in better agreement with the reddening than the 0.6 Å used by Rogers et al. (1993b). We therefore also computed the metallicities for the program stars using a constant of 0.3 Å and these are given in the last column of Table 11 in Appendix B.
| No. | ID | E | Notes | |||||||||
|---|---|---|---|---|---|---|---|---|---|---|---|---|
| (1) | (2) | (3) | (4) | (5) | (6) | (7) | (8) | (9) | (10) | (11) | (12) | (13) |
| 1 | Pn23l2–7 | 12.900.02 | 0.4370.010 | … | … | 0.09 | 16.53 | 11.92 | 11.74 | 13.08 | 0.06 | |
| 2 | Pn23l2–18 | 12.270.03 | 0.2380.009 | 1.9340.011 | 2.8430.016 | 0.04 | 15.09 | 11.74 | 11.67 | 12.45 | 0.03 | |
| 3 | Pn23s1–15 | 13.280.02 | 0.0110.015 | 1.6600.019 | … | 0.04 | … | 13.25 | 13.28 | … | … | |
| 4 | Pn24l–37 | 13.220.02 | 0.1940.006 | 2.1830.060 | 2.8200.011 | 0.05 | 16.08 | 12.81 | 12.75 | 13.55 | 0.07 | |
| 5 | Pn23s1–10 | 11.82a | 0.35: | … | … | 0.07 | 15.20 | 11.10 | 10.91 | 12.16 | 0.03 | |
| 6 | Pn24s–32 | 10.63a | 0.41: | … | … | 0.04 | … | 9.81 | 9.58 | 10.98 | 0.01 | |
| 7 | Pn24l–46 | 14.550.01 | 0.3480.025 | … | … | 0.09 | 17.74 | 13.75 | 13.51 | 14.74 | 0.14 | |
| 8 | Pn23l2–17 | 13.230.01 | 0.4020.017 | 1.9300.011 | … | 0.05 | 16.63 | 12.44 | 12.25 | 13.12 | 0.04 | |
| 9 | Pn24l–38 | 13.44a | 0.32: | … | … | 0.05 | 17.08 | 12.77 | 12.61 | 13.53 | 0.07 | |
| 10 | Pn24l–47 | 13.070.01 | 0.1950.012 | 1.9100.026 | … | 0.05 | 15.62 | 12.70 | 12.62 | 13.22 | 0.06 | |
| 11 | Pn23s2–2 | 12.15a | 0.46: | … | … | 0.08 | 15.88 | 11.21 | 10.98 | 12.41 | 0.04 | |
| 12 | Pn23l2–19 | 13.580.01 | 0.3340.045 | 1.7300.039 | … | 0.05 | 16.68 | 13.18 | 12.97 | 14.02 | 0.17 | 1 |
| 13 | Pn24l–36 | 13.44 | 0.434 | … | … | 0.06 | 16.29 | 12.38 | 12.10 | 13.61 | 0.06 | |
| 14 | Pn23l2–16 | 13.89a | 0.51: | … | … | 0.04 | 17.39 | 12.92 | 12.62 | 13.94 | 0.07 | |
| 15 | Pn24l–32 | 15.120.03 | 0.1180.068 | 2.2550.008 | … | 0.08 | 17.70 | 14.76 | 14.75 | 9.00 | 9.00 | |
| 16 | Pn23l2–1 | 14.020.02 | 0.4760.032 | 1.8700.106 | … | 0.07 | 17.58 | 12.76 | 12.52 | 14.02 | 0.31 | 2 |
| 17 | Pn23s1–2 | 12.520.01 | 0.2410.006 | 1.9650.014 | … | 0.06 | 15.51 | 12.01 | 11.91 | 12.80 | 0.04 | |
| 18 | Pn23l1–11 | 15.57 | –0.230 | … | … | 0.05 | … | 15.54 | 15.22 | 15.33 | 0.20 | 3 |
| 19 | Pn23l2–6 | 13.840.03 | 0.4470.021 | … | … | 0.07 | 17.44 | 12.82 | 12.57 | 14.02 | 0.08 | |
| 20 | Pn24l–35 | 13.910.02 | 0.2570.016 | 1.9720.030 | … | 0.07 | … | 13.31 | 13.17 | 14.14 | 0.11 | |
| 21 | Pn23s1–3 | 12.66a | 0.46: | … | … | 0.07 | 16.64 | 11.67 | 11.44 | 12.86 | 0.03 | |
| 22 | Pn23l2–8 | 14.24a | 0.33: | … | … | 0.06 | 17.69 | 13.55 | 13.37 | 14.64 | 0.12 | |
| 23 | Pn23s1–14 | 13.22a | 0.52: | … | … | 0.04 | … | 12.18 | 11.90 | 13.14 | 0.05 | |
| 24 | Pn24l–34 | 14.310.01 | 0.2690.034 | 1.8110.040 | … | 0.08 | 17.35 | 13.72 | 13.56 | 14.48 | 0.11 | |
| 25 | Pn23s1–13 | 13.10a | –0.260 | … | … | 0.04 | … | 13.82 | 14.08 | 13.77 | 0.08 | 4 |
| 26 | Pn24l–33 | 14.380.04 | 0.3530.065 | … | … | 0.08 | 17.57 | 13.42 | 13.16 | 14.52 | 0.14 | |
| 27 | Pn24l–48 | 12.770.01 | 0.2120.012 | 1.9380.070 | … | 0.05 | 15.55 | 12.31 | 12.17 | 13.12 | 0.04 | |
| 28 | Pn24s–33 | 12.420.01 | 0.4200.003 | 1.9780.004 | … | 0.11 | 16.34 | 11.51 | 11.31 | 12.61 | 0.03 | |
| 29 | Pn23l2–5 | 13.02a | 0.56: | … | … | 0.05 | 15.91 | 11.91 | 11.60 | 13.22 | 0.04 | |
| 30 | Pn24l–50 | 14.700.02 | 0.0070.022 | 1.8210.116 | … | 0.06 | 16.61 | 14.54 | 14.48 | 14.80 | 0.15 | |
| 31 | Pn24s–31 | 12.690.02 | 0.4230.011 | 1.7520.042 | … | 0.06 | 16.47 | 11.81 | 11.58 | 12.76 | 0.06 | |
| 32 | Pn23l2–20 | 14.10a | 0.66: | … | … | 0.04 | … | 12.98 | 12.55 | 13.97 | 0.09 | |
| 33 | Pn23s1–4 | 11.110.04 | 0.3480.003 | 1.9120.020 | 2.7550.010 | 0.05 | 14.70 | 10.40 | 10.24 | 11.43 | 0.02 | |
| 34 | Pn23l2–9 | 13.380.02 | 0.3130.015 | 2.0400.014 | … | 0.08 | 16.88 | 12.74 | 12.58 | 13.58 | 0.06 | |
| 35 | Pn24s–30 | 11.950.01 | 0.4080.002 | … | … | 0.07 | … | 11.13 | 10.93 | 12.12 | 0.02 | |
| 36 | Pn24s–37 | 11.920.01 | 0.3980.006 | … | … | 0.08 | … | 11.15 | 10.95 | 11.50 | 0.04 | |
| 37 | Pn24l–49 | 11.540.01 | 0.2980.006 | … | … | 0.05 | 14.65 | 11.17 | 11.03 | 11.96 | 0.14 | 5 |
| 38 | Pn24l–51 | 12.930.01 | 0.1030.004 | 2.1470.036 | 2.8500.024 | 0.06 | 15.44 | 12.60 | 12.53 | 12.90 | 0.04 | |
| 39 | Pn24l–41 | 12.33a | 0.43: | … | … | 0.10 | 15.85 | 11.41 | 11.20 | 12.55 | 0.04 | |
| 40 | Pn23s2–9 | 11.760.01 | 0.3300.006 | 1.9730.003 | … | 0.05 | 15.35 | 11.09 | 10.98 | 12.09 | 0.02 | |
| 41 | Pn23l2–14 | 14.440.01 | 0.0720.015 | 2.0700.059 | … | 0.05 | 16.68 | 14.15 | 14.09 | 14.73 | 0.13 | |
| 42 | Pn24s–35 | 12.180.01 | 0.4180.006 | … | … | 0.09 | 15.97 | 11.35 | 11.15 | 12.48 | 0.03 | |
| 43 | Pn24s–29 | 11.23a | 0.28: | … | 2.8160.010 | 0.07 | … | 10.50 | 10.40 | 11.60 | 0.02 | |
| 44 | Pn23l2–69 | 13.52a | 0.41: | … | … | 0.06 | 16.78 | 12.65 | 12.43 | 13.52 | 0.05 | |
| 45 | Pn24s–40 | 11.28a | 0.36: | … | 2.7610.010 | 0.08 | 14.63 | 10.53 | 10.34 | 11.43 | 0.04 | |
| 46 | Pn23s2–10 | 10.59a | 0.32: | … | 2.7420.005 | 0.05 | 14.12 | 9.90 | 9.74 | 10.96 | 0.02 | |
| 47 | Pn23s2–48 | 12.42a | 0.52: | … | … | 0.05 | 15.98 | 11.32 | 11.06 | 12.68 | 0.12 | 6 |
| 48 | Pn24l–45 | 14.630.01 | 0.0850.004 | 2.1540.078 | … | 0.06 | … | 14.37 | 14.40 | … | … | |
| 49 | Pn23s2–11 | 10.410.01 | 0.3160.002 | 1.8580.007 | 2.7680.008 | 0.04 | … | 9.74 | 9.59 | 10.77 | 0.02 | |
| 50 | Pn24l–31 | 13.050.03 | 0.2250.021 | 1.8780.030 | … | 0.07 | 15.49 | 12.54 | 12.37 | 13.35 | 0.07 | |
| 51 | Pn23l2–13 | 13.14a | 0.54: | … | … | 0.05 | 16.23 | 12.04 | 11.75 | 13.27 | 0.06 | |
| 52 | Pn23l2–63 | 14.190.04 | 0.2880.030 | 1.7050.040 | … | 0.04 | 16.89 | 13.53 | 13.35 | 14.60 | 0.13 | |
| 53 | Pn24l–30 | 13.82a | 0.1890.009 | 2.0130.050 | … | 0.07 | 16.70 | 13.37 | 13.29 | 14.14 | 0.09 | |
| 54 | Pn23l2–10 | 13.36a | 0.53: | … | … | 0.05 | 16.78 | 12.41 | 12.08 | 13.58 | 0.07 | |
| 55 | Pn23l2–11 | 14.95b | 0.6:: | … | … | 0.04 | 18.58 | 13.94 | 13.56 | 15.36 | 0.16 | |
| 56 | Pn24l–44 | 13.75 | –0.175 | … | … | 0.09 | … | 14.14 | 14.36 | 13.34 | 0.07 | 7 |
| 57 | Pn23s2–13 | 12.70a | 0.44: | … | … | 0.04 | 16.27 | 11.78 | 11.56 | 12.87 | 0.03 | |
| 58 | Pn24s–26 | 14.16a | 0.45: | … | … | 0.14 | … | 13.33 | 13.05 | 14.33 | 0.11 | |
| 59 | Pn24l–43 | 14.550.01 | 0.2880.009 | 1.9550.040 | … | 0.07 | 17.89 | 13.95 | 13.71 | 15.03 | 0.17 | |
| 60 | Pn24l–42 | 14.840.03 | 0.1270.34 | 2.2400.051 | … | 0.07 | 17.67 | 14.32 | 14.09 | 15.31 | 0.20 |
Note. — Only a portion of this table is shown here to demonstrate its form and content. The full table is available in the published paper.