A combined low-radio frequency/X-ray study of galaxy groups
I. Giant Metrewave Radio Telescope observations
at 235 MHz and 610 MHz
Abstract
We present new Giant Metrewave Radio Telescope observations at 235 MHz and 610 MHz of 18 X-ray bright galaxy groups. These observations are part of an extended project, presented here and in future papers, which combines low-frequency radio and X-ray data to investigate the interaction between central active galactic nuclei (AGN) and the intra-group medium (IGM). The radio images show a very diverse population of group-central radio sources, varying widely in size, power, morphology and spectral index. Comparison of the radio images with Chandra and XMM-Newton X-ray images shows that groups with significant substructure in the X-ray band and marginal radio emission at 1 GHz host low-frequency radio structures that correlate with substructures in IGM. Radio-filled X-ray cavities, the most evident form of AGN/IGM interaction in our sample, are found in half of the systems, and are typically associated with small, low- or mid-power double radio sources. Two systems, NGC5044 and NGC4636, possess multiple cavities, which are isotropically distributed around the group center, possibly due to group weather. In other systems the radio/X-ray correlations are less evident. However, the AGN/IGM interaction can manifest itself through the effects of the high-pressure medium on the morphology, spectral properties and evolution of the radio-emitting plasma. In particular, the IGM can confine fading radio lobes in old/dying radio galaxies and prevent them from dissipating quickly. Evidence for radio emission produced by former outbursts that coexist with current activity is found in six groups of the sample.
Subject headings:
galaxies: active – galaxies: clusters: general – galaxies: clusters: individual (UGC 408, NGC 315, NGC 383, NGC 507, NGC 741, HCG 15, NGC 1407, NGC 1587, MKW 2, NGC 3411, NGC 4636, HCG 62, NGC 5044, NGC 5813, NGC 5846, AWM 4, NGC 6269, NGC 7626, NGC 7619) – intergalactic medium – X-rays: galaxies: clusters – radio continuum: galaxies| Group name | RAJ2000 | DECJ2000 | a | log | Scale | |
|---|---|---|---|---|---|---|
| (h m s) | (∘,′, ′′) | (mJy) | (W Hz-1) | (kpc/′′) | ||
| UGC 408 | 00 39 18.6 | +03 19 52 | 0.0147 | 1710 b | 23.92 | 0.300 |
| NGC 315 | 00 57 48.9 | +30 21 09 | 0.0165 | 2010 | 24.09 | 0.336 |
| NGC 383 | 01 07 25.0 | +21 24 45 | 0.0170 | 4862 b | 24.50 | 0.346 |
| NGC 507 | 01 23 40.0 | +33 15 20 | 0.0165 | 99 | 22.78 | 0.336 |
| NGC 741 | 01 56 21.0 | +05 37 44 | 0.0185 | 1066 b,c | 23.92 | 0.376 |
| HCG 15 | 02 07 37.5 | +02 10 50 | 0.0228 | 25 | 22.47 | 0.460 |
| NGC 1407 | 03 40 11.9 | 18 34 39 | 0.0059 | 86 | 21.82 | 0.122 |
| NGC 1587 | 04 30 39.9 | +00 39 43 | 0.0123 | 132 | 22.65 | 0.252 |
| MKW 2 | 10 30 10.7 | 03 09 48 | 0.0368 | 385 | 24.11 | 0.731 |
| NGC 3411 | 10 50 26.1 | 12 50 42 | 0.0153 | 38 | 22.30 | 0.312 |
| NGC 4636 | 12 42 50.4 | +02 41 24 | 0.0031 | 82 c | 21.24 | 0.064 |
| HCG 62 | 12 53 05.8 | 09 12 16 | 0.0137 | 5 | 21.32 | 0.280 |
| NGC 5044 | 13 15 24.0 | 16 23 06 | 0.0090 | 36 | 21.81 | 0.185 |
| NGC 5813 | 15 01 11.2 | +01 42 07 | 0.0066 | 15 | 21.15 | 0.135 |
| NGC 5846 | 15 06 29.3 | +01 36 20 | 0.0057 | 21 | 21.18 | 0.118 |
| AWM 4 | 16 04 57.0 | +23 55 14 | 0.0318 | 608 | 24.15 | 0.624 |
| NGC 6269 | 16 58 02.4 | +27 51 42 | 0.0348 | 51 | 23.15 | 0.693 |
| NGC 7626 (NGC 7619) e | 23 20 42.3 | +08 13 02 | 0.0114 | 780 | 23.36 | 0.233 |
Note. — Measured from the NVSS images, unless stated otherwise. Condon, Cotton & Broderick (2002). Background radio source not included. The flux of the unrelated source has been measured on the FIRST image ( mJy for the source in NGC 741; mJy for the source in NGC 4636). Mahdavi et al. (2000). The group is centered on NGC 7619 (RA=23h20m14.5s, DEC=+08∘12′23′′, z=0.0125).
1. Introduction
Our view and understanding of cool cores in clusters and groups of galaxies have changed significantly with the launch of the X-ray observatories Chandra and XMM-Newton. As predicted by the cooling flow model (Fabian, Nulsen & Canizares 1984; Fabian 1994), radiative cooling of the X-ray emitting hot gas indeed occurs in the central regions of clusters, but the amount of cool gas is much less than expected (Peterson & Fabian 2006 for a review), requiring a source of heat to balance the radiative losses. Based on the detection of X-ray structures (such as cavities, ripples, filaments and shocks) associated with the central radio galaxy in many cool-core systems (e.g., Fabian et al. 2005, 2006; Mazzotta et al. 2004; Forman et al. 2005; McNamara et al. 2005; Gitti et al. 2007; Blanton et al. 2009), radio-loud activity of the central active galactic nucleus (AGN) is presently the leading candidate for such a source of heat (see, for instance, the review by McNamara & Nulsen 2007).
The combination of X-ray and radio data is vital to understand how AGN feedback operates. However, radio observations at frequencies of GHz and higher often fail to detect the radio-emitting plasma presumed to fill the X-ray cavities and produce many of the observed X-ray structures. Some clusters show both radio-filled and “ghost” cavities (for instance, Perseus; Fabian et al. 2006), suggesting that the central galaxy has undergone repeated radio outbursts, with the ghost cavities resulting from buoyantly rising lobes inflated during past outburst episodes. In this picture, radio emission filling ghost cavities would be aged and hence characterized by very steep spectrum, making its detection very challenging at GHz frequencies. Observations at frequencies GHz indeed confirm the presence of relativistic plasma in the ghost cavities of a number of rich clusters (e.g., Fabian et al. 2002, Clarke et al. 2005 & 2009). These cases emphasize the importance of multi-frequency radio observations, encompassing the low-frequency domain, to trace the history of AGN outbursts and the related energy input into cluster and group cores.
To date, most studies have focused on AGN feedback in massive clusters (e.g., the analysis of cluster samples by Bîrzan et al. 2004, 2008; Dunn & Fabian 2004, 2006; Rafferty et al. 2006; Diehl et al. 2008; Mittal et al. 2009), but the majority of galaxies in the Universe reside in smaller units, such as poor clusters and groups (Eke et al. 2004). As in clusters, X-ray bright groups are often dominated by giant elliptical or cD galaxies which host AGNs. As the group gravitational potential is shallower, the impact of AGN outbursts can be severe, with relatively small energy injections causing dramatic effects on the energetics and spatial distribution of the intra-group medium possibly even ejecting gas from the group (Giodini et al. 2010, Lanz et al. 2010). Groups are therefore a key environment to assess the influence of AGN heating on the thermal history of galaxies and their surrounding gaseous media.
With the aim of extending the investigation of the hot gas/AGN interplay to the group environment and low-frequency radio regime, we undertook a study of a sample of 18 groups that combines new low-frequency Giant Metrewave Radio Telescope (GMRT) observations and X-ray data from Chandra and XMM-Newton observations. Our project will be presented here and in future papers (O’Sullivan et al. 2011, Giacintucci et al. and O’Sullivan et al. in preparation). In this paper, we present the GMRT observations at 235 MHz and 610 MHz for our sample, showing the new radio images and providing basic radio properties of the central radio sources. We also compare the radio images with simple X-ray intensity images to demonstrate correlations, when found, with the intra-group medium (IGM) substructures, which previous studies have shown to be associated with heating and gas motions (X-ray cavities, filaments, ripples, fronts). In future papers, we will analyze these correlations in more detail, examine the spectral properties, pressure and ages of the radio sources, and consider their impact on the groups in which they reside, and in particular on the properties of the IGM.
The present paper is organized as follows: in Section 2 we present the sample of galaxy groups; the GMRT observations and data reduction are described in Section 3; Section 4 summarizes the X-ray (Chandra and XMM-Newton) data reduction; the radio images and the radio/X-ray comparison are presented in Section 5; the discussion and summary are given in Sections 6 and 7, respectively. Throughout the paper we assume H0 = 70 km sec-1 Mpc-1, = 0.3, and = 0.7. The radio spectral index is defined according to , where is the flux density at the frequency .
| Group name | Observation | Frequency | Bandwidth | Integration | Beam, PA a | rms |
|---|---|---|---|---|---|---|
| date | (MHz) | (MHz) | time (min) | (, ∘) | (mJy beam-1) | |
| UGC 408 | Aug 2007 | 610 | 32 | 110 | 6.45.2, 56 | 0.10 |
| Aug 2008 | 235 | 8 | 120 | 15.412.5, 26 | 0.40 | |
| NGC 315 | Feb 2008 | 610 b | 32 | 380 | 5.25.0, 61 | 0.10 |
| Aug 2008 | 235b | 8 | 280 | 15.015.0, 0 | 0.70 | |
| NGC 383 | Feb 2008 | 610 | 32 | 180 | 4.73.9, 53 | 0.12 |
| Aug 2009 | 235 | 8 | 160 | 15.011.9,74 | 1.00 | |
| NGC 507 | Jul 2006 | 610 | 32 | 220 | 7.35.7, 62 | 0.05 |
| Aug 2008 | 235 | 8 | 120 | 17.714.5, 62 | 1.00 | |
| NGC 741 | Aug 2006 | 610 | 32 c | 140 | 7.94.6, 52 | 0.05 |
| Aug 2007 | 235 | 8 | 140 | 12.712.3, 64 | 0.30 | |
| HCG 15 | Aug 2006 | 610 | 32 c | 240 | 8.04.7, 63 | 0.04 |
| Aug 2008 | 235 | 8 | 270 | 14.211.5, 61 | 0.33 | |
| NGC 1407 | Jul 2006 | 610 | 32 d | 200 | 5.64.3, 41 | 0.10 |
| Aug 2008 | 235 | 8 | 130 | 15.412.5, 15 | 0.50 | |
| NGC 1587 | Aug 2006 | 610 | 32 c | 200 | 5.74.7, 67 | 0.05 |
| Aug 2008 | 235 | 8 | 120 | 17.211.0, 46 | 1.00 | |
| MKW 2 e | Aug 2003 | 610 | 16 | 100 | 5.14.6, 42 | 0.13 |
| Jul 2005 | 235 | 8 | 100 | 12.19.7, 65 | 0.65 | |
| NGC 3411 | Aug 2006 | 610 | 32 | 80 | 6.95.3, 19 | 0.09 |
| Feb 2008 | 235 | 8 | 160 | 14.013.0, 0 | 0.40 | |
| NGC 4636 f | Aug 2006 | 610 | 32 | 120 | 5.84.3, 48 | 0.05 |
| Feb 2008 | 235 | 8 | 100 | 12.011.5, 14 | 0.20 | |
| HCG 62 g | Feb 2008 | 610 | 32 c | 100 | 6.9 5.4, 39 | 0.05 |
| Feb 2008 | 235 | 8 | 100 | 14.112.3, 47 | 0.17 | |
| NGC 5044 h | Feb 2008 | 610 | 16 i | 130 | 16.811.7, 4 | 0.05 |
| Feb 2008 | 235 | 8 i | 140 | 13.711.5, 10 | 0.25 | |
| NGC 5813 j | Aug 2008 | 235 | 8 | 100 | 16.515.1, 74 | 0.30 |
| NGC 5846 | Aug 2006 | 610 | 32 c | 140 | 14.86.1, 56 | 0.04 |
| AWM 4 k | Aug 2006 | 610 | 32 | 160 | 5.04.0, 43 | 0.05 |
| Jun 2006 | 327 | 32 | 100 | 9.07.8, 53 | 0.40 | |
| Jul 2006 | 235 | 16 | 120 | 12.710.4, 75 | 0.80 | |
| NGC 6269 | Feb 2008 | 610 | 16 i | 260 | 5.34.1, 69 | 0.07 |
| Feb 2008 | 235 | 8 i | 260 | 14.112.0, 80 | 0.60 | |
| NGC 7626 | Aug 2007 | 610 | 32 | 100 | 6.24.9, 31 | 0.05 |
| Aug 2008 | 235 | 8 | 120 | 14.212.0, 57 | 0.80 |
Note. — FWHM. Observed with two pointings (see text for details). The observations were performed using a total bandwidth of 32 MHz (USB+LSB), but only the USB () and LSB () data set was used for the analysis. Some results based on these observations have been presented in Giacintucci et al. (2007). Some results based on the 610 MHz observations have been presented in Baldi et al. (2009a). The observations of this object have been presented in Gitti et al. (2010). The observations of this object have been presented in David et al. (2009, 2011). Observed in dual 235/610 MHz mode. Some results based on these observations have been presented in Randall et al. (2011). The observations of this object have been presented in Giacintucci et al. (2008) and O’Sullivan et al. (2010a, 2010b).
| Group name | Instrument | Observation ID | Exposure time |
|---|---|---|---|
| (ksec) | |||
| UGC 408 | Chandra ACIS-S | 4053 | 29 |
| NGC 315 | XMM-Newton | 0305290201 | 52 |
| NGC 383 | XMM-Newton | 0305290101 | 24 |
| NGC 507 | Chandra ACIS-I | 2882 | 44 |
| NGC 741 | Chandra ACIS-S | 2223 | 31 |
| XMM-Newton | 0153030701 | 9 | |
| HCG 15 | XMM-Newton | 0052140301 | 35 |
| NGC 1407 | Chandra ACIS-S | 791 | 49 |
| NGC 1587 | Chandra ACIS-I | 2217 | 20 |
| MKW 2 | XMM-Newton | 0404840201 | 48 |
| NGC 3411 | Chandra ACIS-S | 3243 | 30 |
| NGC 4636 | Chandra ACIS-I | 4415 | 75 |
| HCG 62 | Chandra ACIS-S | 921 | 49 |
| NGC 5044 | Chandra ACIS-S | 9399 | 84 |
| NGC 5813 | Chandra ACIS-S | 9517 | 100 |
| NGC 5846 | Chandra ACIS-I | 7923 | 91 |
| NGC 6269 | Chandra ACIS-I | 4972 | 40 |
| NGC 7626 | Chandra ACIS-I | 2074 | 27 |
| Source | |||
|---|---|---|---|
| (mJy) | (mJy) | (0.10) | |
| UGC 408 | 5260 | 3184 | 0.53 |
| NGC 315 | 15411 | 2500 a | |
| NGC 383 | 17815 | 8206 | 0.81 |
| NGC 507 | 1100 | 372 | 1.14 |
| NGC 741 | 5734 c | 2192 c | 1.01 |
| HCG 15 | 50 d | ||
| NGC 1407 | 1490 | 150 | 2.41 e |
| NGC 1587 | 655 | 222 d | f |
| MKW 2 | 1951 | 675 | 1.11 |
| NGC 3411 | 555 | 140 | 1.44 |
| NGC 4636 | 248 c | 139 c | 0.61 |
| HCG 62 | 42 | 14 | 1.15 |
| NGC 5044 | 229 | 38 | 1.88 e |
| NGC 5813 | 81 | ||
| NGC 5846 | 36 | ||
| AWM 4 | 2750 | 1450 | 0.67 |
| NGC 6269 | 230 | 115 | 0.73 |
| NGC 7626 | 3444 c | 1597 c | 0.81 |
Note. — The flux density measured on the 610 MHz is underestimated. Using the WSRT 609 MHz flux by Mack et al. (1998), Jy, the source has in the 235-609 MHz range. Background radio source subtracted. Measured on the low-resolution image. This value has to be considered an overestimate of the real spectral index of the source because part of the extended emission visible at 235 MHz is not detected at the sensitivity level of the 610 MHz image. The 235 MHz observation detects only the central point source.
| Source | log | LLS a | Radio | log | X-ray cavities b | Class c |
|---|---|---|---|---|---|---|
| (W Hz-1) | (kpc) | morphology | (erg s-1) | |||
| UGC 408 | 24.41 | 80 | double + diffuse cocoon | 41.40 d | 1 | |
| NGC 315 | 24.98 | 1160 | giant double with distorted tails | 41.57 | 2 | |
| NGC 383 | 25.06 | 900 | giant double with distorted tails | 42.72 | 2 | |
| NGC 507 | 23.83 | 70 | asymmetric double | 42.95 | 1 (filled) e | 1 |
| NGC 741 | 24.65 | 210 | complex | 42.14 | 1 (ghost) f | 1, 2 |
| HCG 15 | 150 g | point source + diffuse emission | 41.72 | 3 | ||
| NGC 1407 | 23.06 | 80 | double + diffuse emission | 41.23 | 1 (filled) h | 1, 3 |
| NGC 1587 | 23.35 | 22 g | point source + diffuse emission | 40.92 | 3 | |
| MKW 2 | 24.79 | 670 | lobe-dominated double | 42.32 | 2 | |
| NGC 3411 | 23.47 | 80 | point source + diffuse emission | 42.45 i | 3 | |
| NGC 4636 | 21.72 | 10 | asymmetric double | 41.88 | multiple (filled and ghost) j | 1 |
| HCG 62 | 22.25 | 33 | asymmetric double | 42.69 | 2 (filled) k | 1 |
| NGC 5044 | 22.62 | 63 | complex | 42.81 | multiple (filled and ghost) l | 1 |
| NGC 5813 | 21.90 | 22 | double-double | 42.00 m | multiple (filled and ghost) n | 1 |
| NGC 5846 | 12 o | point source + extension | 41.71 | 2 (filled) p + 1 (ghost)q | 1 | |
| AWM 4 | 24.80 | 160 | WAT | 43.64 r | 1 (filled) s | 1,2 |
| NGC 6269 | 23.81 | 36 | double | 43.20 | 2 (filled) t | 1 |
| NGC 7626 | 24.00 | 185 | double with distorted tails | 42.05 | 2 |
Note. — Largest linear size (LLS), measured on the 235 MHz image unless indicated otherwise. Number and type of X-ray cavities as reported in the literature. As defined in Sect. 6.4. Diehl & Statler (2007). A possible cavity has been identified by Dong, Rasmussen & Mulchaey (2010) at the base of the west lobe. Jetha et al. (2008). Measured on the low-resolution image at 610 MHz. A possible small cavity has been identified by Dong, Rasmussen & Mulchaey (2010) at only 0.3 kpc from the center. Mahdavi et al. (2000). Baldi et al. (2009a). Gitti et al. (2010). David et al. (2009). Popesso et al. (2004). Randall et al. (2011). Measured on the low-resolution image. Dong, Rasmussen & Mulchaey (2010). Machacek et al. (2011). Ebeling et al. (1998). O’Sullivan et al. (2010a). Baldi et al. (2009b); the radio lobes are coincident with depressions in the X-ray brigthness, but the Chandra data are not deep enough to confirm that these are X-ray cavities.
2. The sample of galaxy groups
Using our own and archival Chandra and XMM-Newton observations, in combination with literature and archival radio images, we have selected 18 nearby (), elliptical-dominated groups as targets for our joint GMRT/X-ray study. The groups were chosen to possess structures, either in the X-ray brightness and temperature distribution or radio morphology, which strongly indicate ongoing or past AGN activity and thus interaction between the radio source and surrounding IGM. We emphasize that this is not a statistical sample – our selection of systems, in which the short-lived disturbed features possibly associated with AGN feedback are still apparent, prevents this – but is instead designed to provide as thorough a picture as possible of the variety of forms of AGN/IGM interaction taking place in groups. The source list is presented in Table 1, where, unless stated otherwise, the 1.4 GHz flux density is measured from the NRAO VLA Sky Survey (NVSS; Condon et al. 1998) images.
The sample includes a number of well-known radio sources, such as 3C 31 (NGC 383) and B2 0055+30 (NGC 315), for which pointed, multi-frequency and multi-resolution radio observations are available in the literature, usually at frequencies 1 GHz. All groups in Table 1 have X-ray data of good quality and show temperatures in the 1-3 keV range, as expected for poor clusters and groups of galaxies. The velocity dispersions of the groups are in the range 100-600 km s-1.
3. GMRT radio observations and data reduction
The groups listed in Table 1 were observed with the GMRT at 235 MHz and 610 MHz. The observation details are summarized in Table 2, which reports source name, observing date, frequency, total frequency bandwidth, integration time on source, beam (synthesized full-width half-maximum, FWHM) of the full array, and rms level (1) at full resolution. The poor cluster MKW 2 was observed by Giacintucci et al. (2007) as part of a project devoted to the study of cD radio galaxies in rich and poor clusters. The radio data for AWM 4 have been presented and analyzed in Giacintucci et al. (2008) and O’Sullivan et al. (2010a, 2010b). The GMRT images of NGC 5044, HCG 62 and NGC 5813 have been presented in David et al. (2009, 2011), Gitti et al. (2010) and Randall et al. (2011), respectively. Some results based on the 610 MHz observations of NGC 4636 have been presented in Baldi et al. (2009a).
The data at 610 MHz were recorded using both the upper and lower side bands (USB and LSB), providing a total observing bandwidth of 32 MHz. A single band of 8 MHz width was used for the observations at 235 MHz. NGC 5044 and NGC 6269 were observed using the GMRT in dual 235/610 MHz mode, with a 16 MHz-band at 610 MHz and a 8 MHz-band at 235 MHz. The data at all frequencies were collected using the default spectral-line mode, with 128 channels for each band, resulting in a spectral resolution of 125 kHz/channel at 610 MHz and 62.5 kHz/channel at 235 MHz. The data reduction and analysis was carried out using the NRAO Astronomical Image Processing System (AIPS) package. After an initial editing of the data using SPFLG in AIPS to identify and remove bad channels and data affected by radio frequency interference (RFI), the data were calibrated. The flux density scale was set using amplitude calibrators, observed at the beginning and end of each observing run, and the scale of Baars et al. (1977). The bandpass calibration was obtained using the flux density calibrators. A central channel free of RFI was used to normalize the bandpass for each antenna. Residual RFI affecting the data at 235 MHz was removed using the task FLGIT in AIPS and subsequent accurate editing of the filtered data.
After bandpass calibration, the central 84 channels were averaged to 6 channels of 2 MHz each at 610 MHz, and 0.9 MHz at 235 MHz, to reduce the size of the data set, and at the same time to minimize the bandwidth smearing effects within the primary beam of the GMRT antenna. After further careful editing in the averaged data sets, a number of phase-only self–calibration cycles and imaging were carried out for each data set. The large field of view of the GMRT required the implementation of multi-field imaging in each step of the data reduction, using 25 facets covering a field of at 235 MHz and at 610 MHz. The USB and LSB were calibrated separately. The final data sets were further averaged from 6 channels to 1 single channel111The bandwidth smearing, relevant only at the outskirts of the wide field, does not significantly affect the region occupied by the central radio source., and then combined together to produce the final images for each group. Given the large angular sizes of NGC 315, NGC 383, and MKW 2, the USB and LSB images were produced using the 6 channel data sets, and the final images were obtained by combination of the USB and LSB in the plane of the image using the task LTESS in AIPS. The final images of all groups were corrected for the primary beam pattern of the GMRT antennas.
The full resolution of the GMRT is at 610 MHz and at 235 MHz. The u-v range of our observations (0.05–20 k and 0.1–50 k at 235 and 610 MHz, respectively) ensures the detection of structures with angular size 44′ (235 MHz) and 17′ (610 MHz). Beyond the full resolution images, produced with uniform weighting and no tapering, for each source we obtained images with different resolutions, tapering the u-v data by means of the parameters robust and uvtaper in the task IMAGR. The rms noise level (1) achieved in the final full resolution images is in the range 35-130 Jy at 610 MHz, and 0.2-1 mJy at 235 MHz (Table 2). The noise in the full resolution and lower resolution images is comparable in most cases. The spread in the noise level depends mostly on the total time on source, residual RFI still affecting the data, usable bandwidth (in a number of cases only one of the two bands provided good data; see notes in Table 2), and presence of bright sources in the field limiting the achievable dynamic range.
The average residual amplitude errors are 5% at 610 MHz and 8% at 235 MHz (e.g., Chandra et al. 2004). Therefore we can conservatively assume that the absolute flux density calibration is within 5 and 8 at 610 MHz and 235 MHz, respectively.
4. X-ray data reduction
The X-ray observations, their analysis and more detailed interpretation will be described in a future paper (O’Sullivan et al. in preparation). We therefore provide here only a short general description of the procedure used to create the images. Since our goal is to compare the radio and X-ray structures, we choose smoothing scales, color scales, energy band, and whether or not to perform point-source subtraction, on the basis of the sensitivity of the resulting image.
Table 3 lists the general properties of the observations used to produce the X-ray images shown in Section 5. Chandra data were reduced following methods similar to those described in O’Sullivan et al. (2010a) and the Chandra analysis threads222http://asc.harvard.edu/ciao/threads/index.html. A summary of the Chandra mission and instrumentation can be found in Weisskopf et al. (2002). The level 1 events files were reprocessed, bad pixels and events with ASCA grades 1, 5 and 7 were removed, and the cosmic ray afterglow correction was applied. Very faint mode background filtering was applied as appropriate. The data were corrected by the appropriate gain map, the standard time-dependent gain and charge-transfer inefficiency (CTI) corrections were made, and a background light curve was produced. Periods when the background deviated from the mean by more than 3 were excluded. Point sources were identified using the ciao task wavdetect from the 0.3-7.0 keV images and monoenergetic exposure maps with energies chosen to match the mean photon energy of the data (typically 1 keV) were produced. Detection thresholds were set to produce 1 false source on either the ACIS-I array, or S3 CCD, depending on which was in use. Soft band (0.3-2.0 keV) images were extracted, point sources were generally excluded (excepting any point source thought to be related to the AGN) and the resulting holes filled using the dmfilth task. The images were finally corrected using the monoenergetic exposure maps.
In one case, UGC 408, the available Chandra observation (ObsID 4053) suffers from severe background flaring, such that the exclusion of periods of high background resulted in a poor quality image containing few counts. We therefore chose to extract the image from the full dataset, including the flare periods.
XMM-Newton data were reduced following methods similar to those described in O’Sullivan et al. (2007). A detailed summary of the XMM-Newton mission and instrumentation can be found in Jansen et al. (2001, and references therein). The raw data from the EPIC instruments were processed with the XMM Science Analysis System (SAS) tasks epchain and emchain. Bad pixels and columns were identified and removed and the events lists filtered to include only those events with FLAG = 0 and patterns 0-12 (for the MOS cameras) or 0-4 (for the PN). Periods when the background count rate deviated from the mean by more than 3 were excluded. Soft band (0.3-2.0 keV) images and monoenergetic exposure maps (with energies chosen as for Chandra data) were extracted. Images of the particle component of the background, determined from the “telescope closed” datasets of Marty et al. (2003), were extracted and scaled to match the count rate in areas of the detector outside the telescope field of view. Point sources were identified using the edetect_chain script and, where desirable, excluded from further analysis using circular regions of radius 25′′. Where out-of-time (OOT) events produced a significant readout trail in the EPIC-pn camera, an OOT events list was created using epchain, and appropriately scaled images were used to statistically subtract the trail. Where smoothed images were required, the soft band images were adaptively smoothed using the asmooth task, with signal-to-noise ratios of 10-20, and the resulting smoothing scales applied to particle-subtracted, OOT-subtracted images. Finally, unsmoothed images were corrected using the monoenergetic exposure maps.
5. The GMRT radio images and radio/X-ray comparison
In this section we present the new GMRT images at 235 MHz and 610 MHz for all groups listed in Table 1, with the exception of AWM4, published in Giacintucci et al. (2008). The radio images are overlaid on the red-band optical images from the second Palomar Observatory Sky Survey (POSS-2) and on the X-ray images from Chandra or XMM-Newton observations. We also mention the conversion factor from angular to linear scale (Table 1) in the caption of each figure.
In Table 4, we provide the 235 MHz and 610 MHz total flux densities, and spectral index between these two frequencies for each radio source. The flux densities were measured on primary-beam corrected images with similar resolution at both frequencies. Given the high signal-to-noise ratio in all our images, the error associated with the flux density measurement is dominated by the uncertainty in the residual amplitude calibration errors (5% at 610 MHz and 8% at 235 MHz; Sect. 3).
Table 5 summarizes the most relevant observational properties of the groups in the radio and X-ray bands, i.e., radio power at 235 MHz, radio largest linear size (LLS), radio morphology, group X-ray luminosity (), presence and type of X-ray cavities as reported in the literature333the search and identification of possible X-ray cavities not reported in the literature are deferred to a future paper (O’Sullivan et al. in preparation)., and class as defined in Sect. 6.4. Unless indicated otherwise in the caption of the table, the LLS was measured on the 235 MHz image, and the X-ray luminosity of the corresponding group is from Mulchaey et al. (2003).
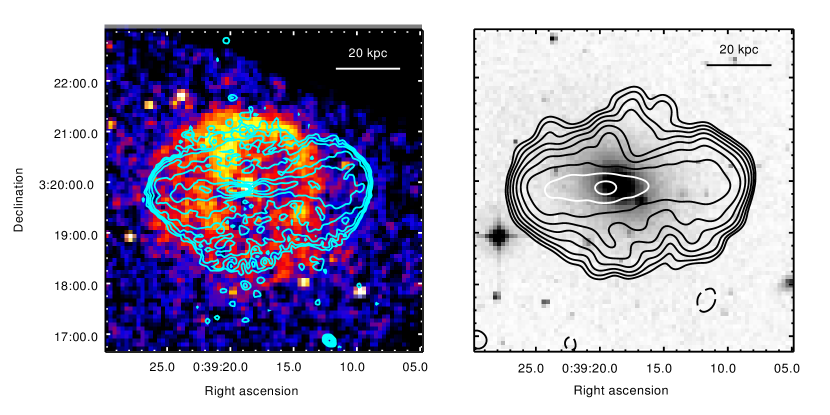
5.1. UGC 408
UGC 408 (also known as NGC 193) is a central dominant early-type galaxy, classified as a lenticular in Third Reference Catalogue of Bright Galaxies (RC3; de Vaucouleurs et al. 1991) of a poor group of galaxies, HDCE 25. It hosts the Fanaroff-Riley type I (FR I; Fanaroff & Riley 1974) radio source 4C +03.01.
The GMRT 610 MHz full resolution contours are shown in Fig. 1 (left), overlaid on the smoothed Chandra image. In the right panel we show the 235 MHz image at the resolution of , overlaid on the optical image. The radio source has two bright and straight jets with a total extent of 80 kpc (side to side). The eastern jet appears significantly brighter than the western one. This asymmetry is also observed at 1.4 GHz with the Very Large Array (VLA), and on the parsec scale with the Very Long Baseline Array (VLBA) at 1.7 GHz (Xu et al. 2000), where 4C +03.01 exhibits a core-jet morphology aligned with the large scale structure. The two jets are embedded in a low-surface brightness “cocoon” that extends perpendicular to the jet axis, out to a projected distance of 30 kpc from the center, as measured on the 235 MHz image. The sharp edges at the end of the two jets suggest that they are impinging on the external medium.
The Chandra image in Fig. 1 (left) shows a kpc-radius bright ring around the central X-ray nucleus. This feature may be the outer shell of a large single X-ray cavity projected at the group center, although it may also be the result of the superposition of two cavities along the line of sight. The radio jets extend beyond the possible central cavity and show little, if any, correlation with the substructures detected in the X-ray image. On the contrary, a correlation is observed between the outer border of the cocoon and the bright X-ray rim of the candidate cavity in the northern region. Although less evident, a similar correlation is also present in the southern and eastern part. This suggests that the cavity may be filled by the radio plasma in the diffuse cocoon with the X-ray bright rim representing an edge-brightened shell of gas.
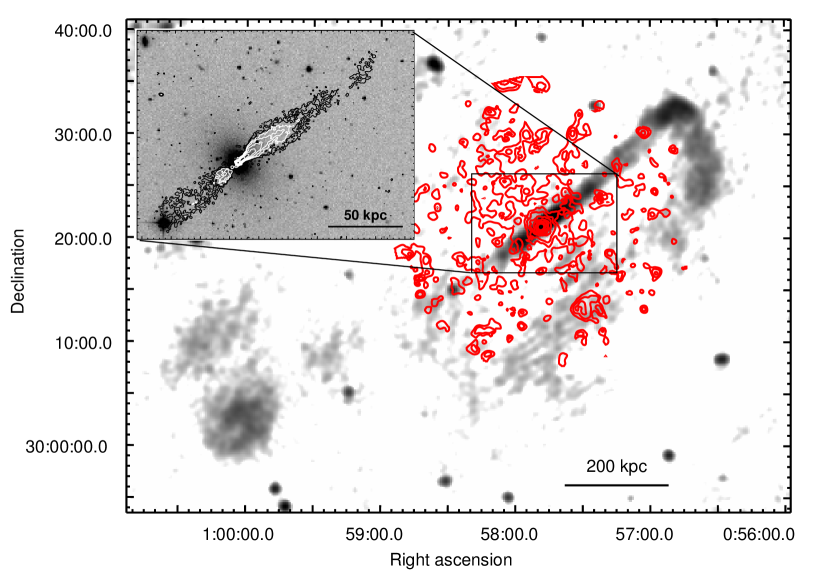
5.2. NGC 315
NGC 315 is a giant elliptical at the core of the poor group WBL 22 in the Group Evolution Multiwavelength Study (GEMS) sample (Forbes et al. 2006), which is part of the Pisces-Perseus supercluster. This galaxy is the optical counterpart of the well-known giant FR I radio galaxy B2 0055+30, which has been studied at many frequencies and angular resolutions (e.g., Bridle 1976, 1979; Willis et al. 1981; Venturi et al. 1993; Mack et al. 1997, 1998; Xu et al. 2000; Laing et al. 2006; Worrall et al. 2007).
Given the large angular size of B2 0055+30, the GMRT observations were carried out in mosaic mode to obtain uniform sensitivity, covering the region of interest with two fields centered on RA=00h57m30.0s, DEC= and RA=00h59m00.0s, DEC=. Each field was calibrated separately and the final images were produced with the same restoring beam, primary-beam corrected and then combined in the plane of the image.
Fig. 2 shows the large-scale radio emission of NGC 315 as deteced in our low-resolution (FWHM=40′′) mosaic at 235 MHz (gray-scale image). The inset presents the full resolution contours at 610 MHz, overlaid on the optical image, showing the radio core and the inner jets. As observed in similar resolution images (e.g., Mack et al. 1997), at 235 MHz the north-west jet propagates straight and continuous to a bright hot-spot at a distance of 360 kpc () from the galaxy nucleus. The south-east jet is much fainter and appears intermittently. The two lobes are also very asymmetric, with the north-west one brighter, narrower, and more prominently distorted. The lobe is heavily curved in a “back-flow” direction and forms a low-brightness tail extending parallel to the jet. The total linear size of the source is 1.2 Mpc (side to side), however it reaches the exceptionally large extent of 2 Mpc, if we also include the length of the radio tails beyond the two sharp bends.
The radio properties are summarized in Table 4. A total flux of 2.5 Jy was obtained at 610 MHz from an image (not shown here) produced with a similar resolution as the 235 MHz image in Fig. 2. Since the south-east lobe is not detected at 610 MHz, our 610 MHz flux density is underestimated. By comparison, Mack et al. (1997) report a flux of 5.3 Jy at 609 MHz with the Westerbork Synthesis Radio Telescope (WSRT).
The X-ray emission of NGC 315 was analyzed at high resolution by Worrall, Birkinshaw & Hardcastle (2003) and Worrall et al. (2007) using Chandra data, which revealed a prominent X-ray jet coincident with the first of the brighter radio jet. A smoothed XMM-Newton image is shown as red contours in Fig. 2. Extended X-ray emission around the galaxy is detected to a radius of from the core (see also Croston et al. 2008). No correlation is found between the X-ray and radio emission on such a large scale.
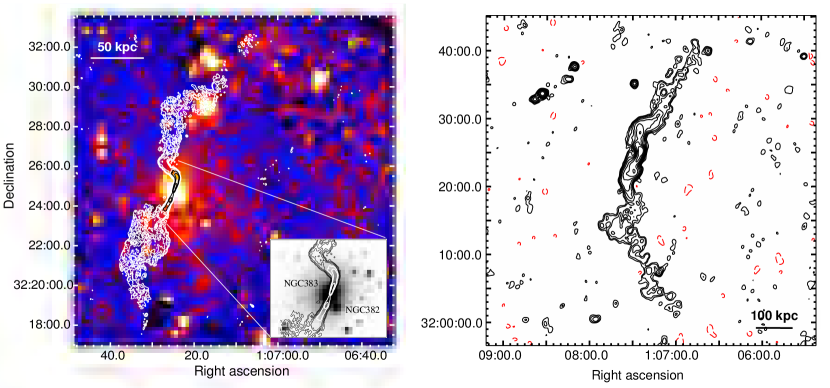
5.3. NGC 383
NGC 383 is the dominant D galaxy, a part of the Arp 133 system, at the core of the poor group WBL 25, also known as IV Zw 38. It is also a part of the Pisces-Perseus supercluster (an optical analysis can be found in Miles et al. 2004). This galaxy has long been known to host the famous, twin-jet FR I source 3C 31, which belongs to the same class of giant radio galaxies as NGC 315 (Sect. 5.2). 3C 31 has been studied in detail both on large and small scales by many authors (e.g., Burch 1977; Blandford & Icke 1978; Fomalont et al. 1980; Strom et al. 1983; Andernach et al. 1992; Laing & Bridle 2002; Laing et al. 2008, and references therein).
Fig. 3 presents our new GMRT image at 610 MHz (left), overlaid on the XMM–Newton image. The inset shows the 610 MHz contours on the optical image of NGC 383 and its companion galaxy NGC 382, located at 35′′ ( 12 kpc) south-west of the nucleus. The two bright jets undergo multiple bends (wiggles) before flowing into elongated, distorted tails. In the right panel of Fig. 3, we show the low-resolution image at 235 MHz. Here the radio tails extend further out and 3C 31 reaches a size of 900 kpc, i.e., the largest scale imaged so far for this source. Its maximum extent in the images in the literature is 620 kpc, as measured at 408 MHz (80′′ resolution; Burch 1977), 610 MHz (42′′ resolution; Strom et al. 1983), and 1.4 GHz (40′′ resolution; Laing et al. 2008). Interestingly, the wiggles observed in the jets appear to be still occurring even at large distance from the nucleus.
The total flux densities given in Table 4 were measured from images with 40′′-resolution both at 235 MHz (Fig. 3) and 610 MHz (image not shown here).
The XMM-Newton image in Fig. 3 (left) shows the X-ray emission from the hot intra-group gas on a scale of 4′ ( 80 kpc) from the central galaxy. The radio jets seem to lose collimation and merge into the tails at the boundary of the detected X-ray halo. The tails extend well beyond the X-ray emission and do not show any evident correlation with the X-ray surface brightness (see also Croston et al. 2008).
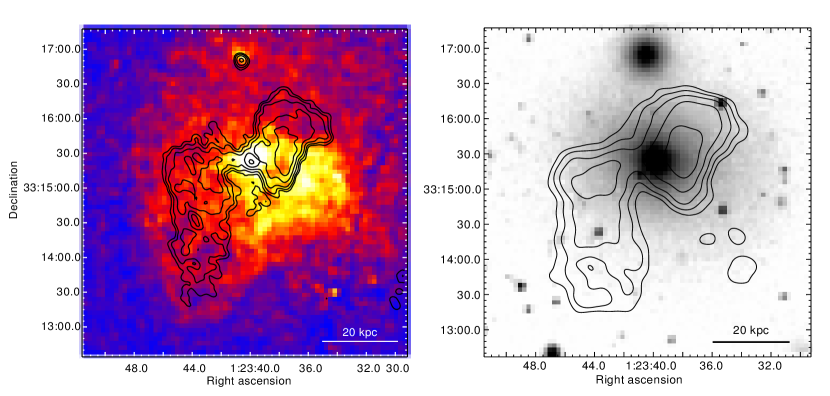
5.4. NGC 507
NGC 507 (Arp 229) is the dominant elliptical galaxy in the richest group of galaxies (Mulchaey et al. 2003; O’Sullivan et al. 2003; Jeltema et al. 2008) in the Pisces system of groups. It hosts the low-power and extended FR I radio source B2 0120+33 (Parma et al. 1986).
The GMRT full-resolution image at 610 MHz is presented in Fig. 4 (left) as contours on the Chandra image. In the right panel, we show the overlay of the 235 MHz contours on the optical image. The radio source is very distorted and asymmetric. The faint, unresolved central component in the 610 MHz image is coincident with the nucleus of the optical galaxy and hosts the radio core, clearly detected at 4.9 GHz (image from archival VLA observations – project AH766 – not shown here; see also Murgia et al. 2011). The core is undetected at 235 MHz. No kpc-scale jets are visible in our images. The eastern lobe is more extended, but fainter than the western one. A compression of the radio contours in the south-western region of the western lobe suggests a strong interaction with the external medium.
Similar to the radio images, the X-ray emission of NGC 507 appears strongly disturbed and asymmetric. The brightest X-ray emission is concentrated in a 40 kpc region south-west of the central peak. It surrounds, and partially overlaps, the brightest part of the western radio lobe. The other lobe appears associated with fainter X-ray emission. A sharp surface brightness edge is observed to the east of the core, just beyond the radio emission (Kraft et al. 2004). This discontinuity is also visible in the XMM-Newton observation of the group (Fabbiano, Kim & Brickhouse 2002) and might be created by the inflation/expansion of the radio lobe (Kraft et al. 2004). Tentative evidence for an X-ray cavity at 7 kpc south-east of the group center, i.e., at the base of the western lobe, has been reported by Dong, Rasmussen & Mulchaey (2010).
All the X-ray structures described above suggest that the core of NGC 507 has been seriously perturbed by the AGN activity in the central elliptical. At the same time, Murgia et al. (2011) suggested that NGC 507 is a dying radio galaxy, whose evolution might have been significantly affected by the external medium. The fading phase of a radio galaxy in a particularly dense environment, such as a group or cluster core, may be longer than that of a field radio source, due to the significantly higher pressure of the medium, which is able to confine the radio plasma and prevent its dissipation through adiabiatic expansion (e.g., Slee & Reynolds 1984; Roland et al. 1985; Murgia et al. 2011; see also Sect. 6.3).
5.5. NGC 741
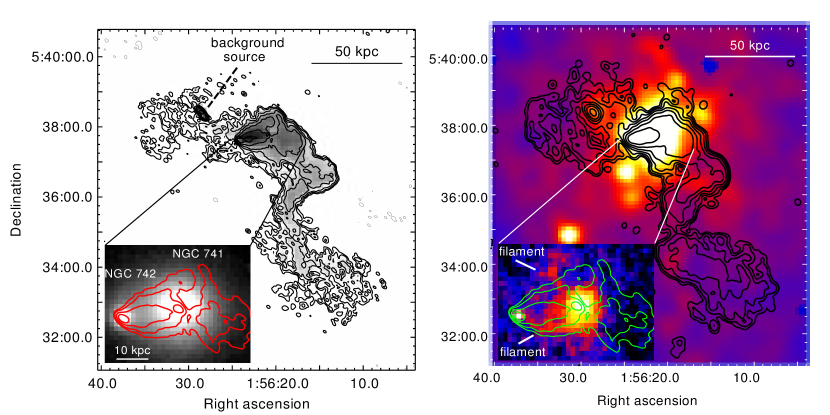
NGC 741 is the central and brightest elliptical galaxy of a rich fossil group of galaxies at a redshift of (Mulchaey & Zabludoff 1998; Miles et al. 2004; Forbes et al. 2006). The velocity dispersion of the group is km s-1 (Jetha et al. 2008), making it one of the richest groups in our sample. There are 30 catalogued members of the group, even though the magnitude difference between the brightest (NGC 741) and second brightest (NGC 742) galaxies is almost three magnitudes, separated by only (17 kpc) in the plane of the sky. However the velocity difference is km s-1, suggesting that NGC 742 has fallen at high velocity through the group core and is passing close to NGC 741. The two galaxies have long been known to be associated with the bright, extended radio source 4C 05.10 (Birkinshaw & Davies 1985).
Our GMRT full-resolution images at 610 MHz and 235 MHz are presented in Fig. 5. The radio emission at the group center exhibits a very complicated morphology. Two central bright peaks of emission appear spatially coincident with the two optical galaxies NGC 741 and NGC 742 (see inset in the left panel), and are apparently connected by a bridge of diffuse emission. In the south-west, a tail of emission extends kpc from NGC 741, with a striking twisted structure and surface brightness decreasing with distance from the galaxy. A region of faint emission is located kpc east of NGC 742, with a total extent of kpc. The discrete radio source embedded (in projection) within this emission is likely unrelated to the NGC 741 group, being associated instead with a possible background galaxy. No redshift information is available for this object.
It is likely that this peculiar radio structure is the blend of two different radio sources. Possible explanations have been discussed in the literature (e.g., Venkatesan et al. 1994; Birkinshaw & Davis 1985). In particular, it has been proposed that the observed emission is the superposition of a large head-tail, associated with NGC 742, onto a compact source hosted by NGC 741. Alternatively, it has been argued that NGC 742 might be simply projected by chance on the hot spot of a double radio galaxy associated with NGC 741 (Birkinshaw & Davis 1985). The detection of the eastern diffuse emission in our GMRT images further complicates the interpretation of the source. The origin of such a feature is unclear. If the south-west tail originates from NGC 742, then this structure might be emission associated with NGC 741 and bent toward the east by the interaction between the two galaxies. An interesting, alternative possibility is that the eastern emission is an aged radio lobe inflated by a former outburst of the dominant galaxy.
The NGC 741 system has been observed by both XMM-Newton and Chandra (Fig. 5). The XMM-Newton observation shows the large-scale X-ray structure of the group core (Fig. 5, right), while the Chandra image (inset) reveals the AGN in both NGC 741 and its neighbor NGC 742, as well as narrow filamentary (or possibly edge-on sheet or shell) structure linking the two. Interestingly, one of the X-ray filaments appears to run along the southern border of the diffuse radio bridge between the two galaxies. An X-ray elliptical cavity, with no radio emission at frequencies 1.4 GHz, has been detected by Jetha et al. (2008) at RA 01h 56m 15s and DEC05∘ 38′ and 00′′, with semi-major axes of and . This ghost cavity has been interpreted as the product of former AGN activity in the dominant elliptical. No low-frequency radio emission from this cavity is detected in our GMRT images. From the radio and X-ray data, it seems likely that both AGN outbursts and merger processes have shaped the structures seen in the group core.
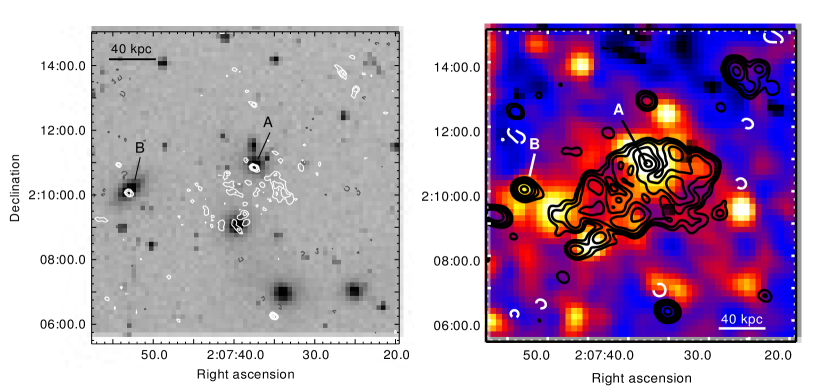
5.6. HCG 15
HCG 15 is a compact group of galaxies (also known as WBL66; Osmond et al. 2004, Forbes et al. 2006) of six galaxies with a mixed spiral and elliptical population. It is the only system in our sample that appears to be dominated by several bright galaxies, rather than one single giant elliptical at the center (Coziol, Brinks & Bravo-Alfaro 2004).
The GMRT 610 MHz full-resolution image is presented in Fig. 6 (left) as contours overlaid on the optical image. Two point sources (labelled A and B in the figure) are associated with the group galaxies HCG 15d and HCG 15a (Coziol, Brinks & Bravo-Alfaro 2004), respectively. In addition to these sources, low-brightness, extended emission is found in the region south of source A, as emphasized by the low-resolution 610 MHz image shown in the right panel (contours). The diffuse source appears clumpy and elongated in the northwest-southeast, with a total extent of 150 kpc. The GMRT observation at 235 MHz was affected by severe RFI. After considerable flagging and many cycles of phase self-calibration, the quality of the final images still appears compromised by residual RFI and phase errors. For this reason, we do not show the 235 MHz image. A deeper re-observation at 235 MHz (scheduled during GMRT Cycle 18) will provide a better image of the group emission at this frequency.
The XMM-Newton X-ray observation of HCG 15 reveals disturbed, diffuse emission between the group galaxies, particularly on the eastern side (Fig. 6, right; see also Finoguenov et al. 2007), suggesting that the system is not in a fully relaxed state. The brightest emission is centered on HCG 15d (A). The second brightest region is a clump of emission, with an extent of 40 kpc, between HCG 15a (B) and the rest of the group. The diffuse radio source appears associated with the intra-group medium rather than with the individual galaxies, and extends out to the X-ray clump on the eastern side of the group. This poses the question of its origin. The extended radio emission may be an old, detached radio lobe which buoyantly moved away from the host galaxy, possibly subject to the intra-group gas motion. An alternative scenario is suggested by the analogy with the case of Stephan’s Quintet, where a bridge of X-ray and radio emission crosses the center of the group, interpreted as material shock-heated by the collision of an interloper galaxy (O’Sullivan et al. 2009, and references therein). This raises the interesting possibility that the diffuse radio emission in HCG 15 might arise from a broad shock front caused by the passage of a galaxy through the group core. In this scenario, we might expect discordant galaxy velocities and a high galaxy velocity dispersion. The radial velocities of the six principal galaxies are spread over km s-1, and the dispersion is 400 km s-1 (Hickson, Kindl & Auman 1989; Mulchaey et al. 2003).
5.7. NGC 1407
NGC 1407 is the dominant elliptical galaxy in a dynamically evolved rich group (Eridanus A) dominated by dwarf galaxies (e.g., Miles et al. 2004; Trentham et al. 2006), and it is part of a larger system of groups called the Eridanus super-group (Brough et al. 2006).
In Fig. 7 (left), we present the 610 MHz full-resolution contours on the optical image. The radio source has an asymmetric twin-jet structure, with a total size of only 6 kpc. The eastern jet broadens at 2 kpc from the central radio peak, while, at a similar projected distance, the western jet undergoes a sharp bend toward the north. The 235 MHz image (white and black contours), at a resolution of , is shown in the right panel of Fig. 7, overlaid on the Chandra image. The black contour region approximately corresponds to the region covered by the 610 MHz contours. The emission at this frequency is one order of magnitude more extended than the emission detected at 610 MHz. A very diffuse and low-brightness structure of 80 kpc extent completely encloses the higher frequency emission. No indication of this diffuse component is found in low resolution images at 610 MHz, though the brightest peaks are marginally visible (at the 1 level) in the 1.4 GHz NVSS image. The flux measured at 235 MHz for this diffuse component is 1170 mJy, while the NVSS gives mJy, implying a very steep spectral index (). Our images suggest that two distinct radio outbursts co-exist in this system: the current AGN activity, which can be identified with the small-scale double radio source, and the diffuse component, generated by an earlier outburst. The hypothesis of a restarted radio galaxy is consistent with the ultra-steep spectrum of the source (Table 4), which is dominated by the low-frequency diffuse component.
The Chandra image in Fig. 7 (right) shows that the X-ray emission of the group is mostly extended along the east-west axis, and more extended to the south than the north. The 235 MHz diffuse component extends on a larger scale (80) than the X-ray halo ( 30kpc). However, the radio structure shows a similar north-south asymmetry, suggesting a common cause, probably motion of the group northward. Using Chandra data, Dong, Rasmussen & Mulchaey (2010) located a possible X-ray cavity at less than 0.5 kpc from the X-ray center of the group. The resolution of our 610 MHz image does not allow a direct comparison between the radio emission and the candidate cavity, which lies in the region covered by the highest radio contour in Fig. 7 (left).
5.8. NGC 1587
NGC 1587 is the brighter of the pair of elliptical galaxies NGC 1587/88, which is part of a poor group with an unusually low velocity dispersion 100 km s-1 (Mulchaey et al. 2003, Osmond & Ponman 2004).
The 610 MHz radio image of NGC 1587 is shown in Fig. 8 at full resolution (left) and slightly lower resolution (right), overlaid on the Chandra and POSS-2 images, respectively. The source has a compact, bright component, coincident with the galaxy optical peak. This component appears surrounded by amorphous, low-brightness emission that encompasses a 5 kpc radius region around the center. A fainter structure extends for 10 kpc north-west of the galaxy. No radio emission is detected from the companion galaxy NGC 1588. The radio morphology of NGC 1587 is reminiscent of core-halo radio sources, found in a number of clusters with cool cores, such as 3C 317 (Venturi, Dallacasa & Stefanachi 2004), 2A 0335+096 (Sarazin, Baum & O’Dea 1995), PKS 0745-191 (Baum & O’Dea 1991), RXJ 1720.1+2638 and MS 1455.0+2232 (Mazzotta & Giacintucci 2008). However, core-halos usually extend over a scale which is comparable to the core of the cluster (i.e., from several tens to few hundreds of kpc in radius), while the halo component in NGC 1587 appears fully contained within the optical envelope of the galaxy. Our GMRT observation at 235 MHz detected only the central point-source. For this reason, we do not show the 235 MHz image, and we only provide the total flux density in Table 4.
The Chandra image is shown in Fig. 8 (left). The group has very faint extended X-ray emission and low temperature (kT=0.4 keV; Helsdon et al. 2005). The radio emission appears associated with the X-ray brightest regions, with the exception of the faint radio feature extended toward the north-west. Helsdon et al. (2005) found an indication of a gas temperature peak in the central 1′ radius region of the group. The radio source seems to be totally contained within this radius, suggesting that the gas might have been heated by its activity.
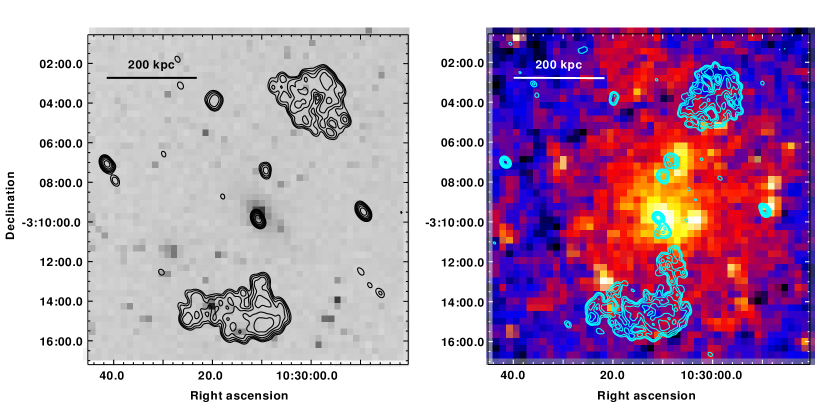
5.9. MKW 2
MKW 2 is a rich group (or poor cluster, also known as WBL 276), centered on the cD galaxy CGCG 009-062. It is part of a complex system, with a poor group about 2 Mpc from its center, projected on the sky to its north-east, and another equally rich system (MKW 2s) towards the west, in the foreground.
The GMRT 235 and 610 MHz observations re-analyzed here are from Giacintucci et al. (2007), who observed the central galaxy as part of a study of the radio emission associated with cD galaxies in rich and poor clusters. The cD in MKW 2 hosts a very large radio galaxy with a morphology similar to that of FR II sources, with jets, asymmetric in size and brightness, lobes and possibly hot spots (Burns et al. 1987; Giacintucci et al. 2007), though its radio power is typical of FR I radio galaxies (Table 1).
In Fig. 9 we show new images at 610 MHz (left) and 235 MHz (right) produced with a lower resolution with respect to the images in Giacintucci et al. (2007; see their Fig. 11). The radio contours are overlaid on the optical and XMM-Newton images. As in Giacintucci et al. (2007), only the central component, coincident with the galaxy, and the radio lobes are detected at 610 MHz. The southern jet is completely resolved out, while a possible knot of the northern jet is visible at 100 kpc from the center. The 235 MHz image shown here reveals more structure than the higher resolution image in Giacintucci et al. (2007), since the southern jet is now almost entirely detected, as well as part of the other jet beyond the knot.
The total flux measured from the new GMRT images in Fig. 9 is 1.95 Jy at 235 MHz and 674 mJy at 610 MHz (Table 4). These values are higher than the fluxes given in Giacintucci et al. (2007), 1.7 Jy and 245 mJy, respectively. While the difference at 235 MHz is 15% and might be due to the different angular resolution of the images, the disagreement between the 610 MHz fluxes is much larger. By comparison with the NVSS flux density (Table 1) and literature data, Giacintucci et al. (2007) inferred that their 610 MHz flux was most likely underestimated.
Fig. 9 (right) presents the X-ray image of MKW 2 from new XMM-Newton observations obtained during cycle 5. Previous ROSAT PSPC observations (e.g., Mulchaey et al 2003) suggested an interaction between the lobes and the intra-cluster medium. The new XMM-Newton data do not show a clear correlation, probably owing to the very low density of the gas in the group and the distance of the radio lobes from the cluster center. Note that the northern lobe falls partially on the EPIC-MOS chip gaps. The knots of the jets seem to be roughly coincident with some bright features in the X-ray image.
5.10. NGC 3411
The large elliptical galaxy NGC 3411 lies at the center of a relaxed group with several neighboring disk galaxies. The dominant galaxy is sometimes misidentified as NGC 3402. Previous high-resolution () VLA observations at 1.4 GHz, 4.9 GHz and 8.4 GHz detected a resolved nuclear source and marginally extended emission with no indication of any jets (O’Sullivan et al. 2007). The comparison with the 1.4 GHz NVSS image suggested the existence of larger scale, low-surface brightness emission which was not detected in those observations.
Our GMRT images are presented in Fig.10. On the left we show the 610 MHz emission at the full resolution, overlaid on the POSS-2. The right panel presents the 235 MHz contours at the resolution of , overlaid on the Chandra image. The low-frequency morphology of NGC 3411 is characterized by a diffuse component, mostly extended in the north-south direction, which covers a much larger scale (80 kpc) than the high frequency images in O’Sullivan et al. (2007). Such emission appears as an irregular halo surrounding the central compact component. No jets connecting the point source and the extended emission are visible in our images. This morphology resembles the core-halo radio sources typically found at the centers of relaxed cool-core clusters (e.g., Mazzotta & Giacintucci 2008 and references therein; see also Sect. 5.8), although the total extent of the source in NGC 3411 is smaller than the typical size of core-halos (from several tens to few hundreds of kpc in radius). The source has a steep spectral index () – one of the steepest among the sample (Table 4) – as usually found for core-halo sources.
The X-ray emission of the NGC 3411 group appears completely relaxed (Fig. 10, right). However, O’Sullivan et al. (2007) found a highly unusual temperature structure in the profiles and temperature maps from both Chandra and XMM-Newton data; the system has a hot core surrounded by a shell of cooler gas extending between 20 kpc and 40 kpc from the center. O’Sullivan et al. (2007) argued that NGC 3411 could be an example of a re-heated cool core, with a recent AGN outburst heating the central cool gas to the observed temperature.
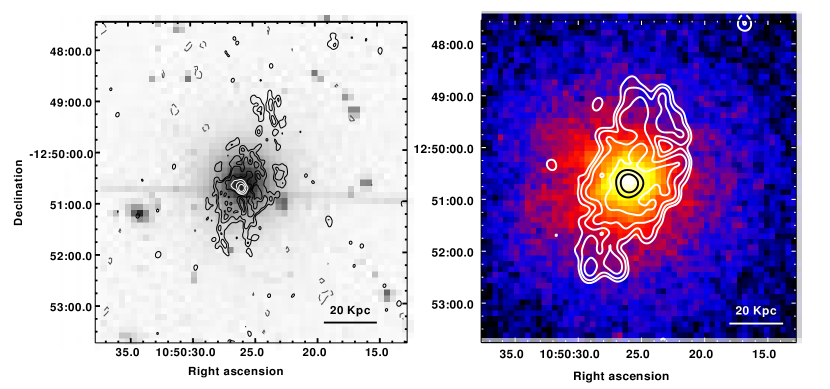
5.11. NGC 4636
NGC 4636 is the dominant elliptical of a nearby poor group on the periphery of the Virgo cluster. The kinematics of globular clusters reveal an extended dark matter halo for the dominant elliptical (Chakrabarty & Raychaudhury 2008), in agreement with mass estimates from Chandra and XMM-Newton observations (Johnson et al. 2009).
Our GMRT image at 610 MHz has been presented in Baldi et al. (2009b), who investigated the X-ray morphology and temperature structure of the group core using a long Chandra exposure. Here we report the 610 MHz image, overlaid on the POSS-2, in the left panel of Fig. 11, and present the new 235 MHz contours superimposed on the Chandra image in the right panel.
The radio source structure is visible in better detail in the high-resolution image at 610 MHz. The source has a small double morphology, with bright jets flowing into fainter radio lobes that extend to a radius of 2.5 kpc from the center. The overall radio structure is symmetric in brightness and size, and appears twisted in a peculiar, reversed S-shape. The double radio source to the east is a background radio galaxy. At lower frequency (Fig. 11, right) the source becomes asymmetric; both lobes are more extended than at 610 MHz, but the emission on the north-east side reaches a larger distance (7 kpc) from the center than the south-west ( 3.5 kpc).
The Chandra images (Fig. 11, right; Jones et al. 2002; Ohto et al. 2003; O’Sullivan, Vrtilek & Kempner 2005; Baldi et al. 2009a) reveal a very unusual morphology in the core of NGC 4636. The most prominent feature is a set of quasi-symmetric, spiral arm-like structures (only barely visible in Fig. 11; see Baldi et al. 2009a for more detailed images of these features), which are coincident with the border of two X-ray cavities (NE cavity and SE cavity in Fig. 11). This complex X-ray morphology is believed to be produced by AGN-driven shocks (Jones et al. 2002). The presence of 610 MHz radio emission extending towards the bubbles might indeed confirm such a scenario (Baldi et al. 2009a). Further confirmation comes from the 235 MHz image in Fig. 11, which shows the north-east cavity to be totally filled with low-frequency radio emitting plasma. On the opposite side, the south-west cavity remains undetected in the radio, except for a small overlap with the 235 MHz emission that points toward the center of the cavity. The combination of the radio and X-ray data indicates that NGC 4636 is a rather complex and intriguing multi-bubble system, with all the cavities, some radio-loud and other radio-quiet, located at roughly the same distance from the center.
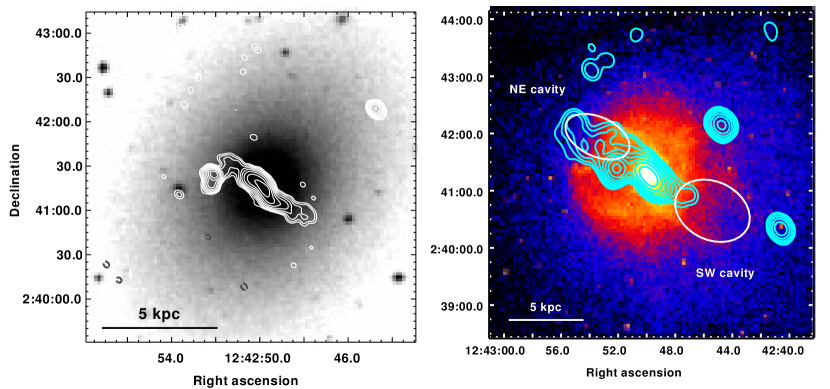
5.12. HCG 62
HCG 62 is one of the nearest Hickson compact galaxy groups (Hickson, Kindl & Auman 1989) and the brightest group of galaxies in the X-ray band (Ponman and Bertram 1993). It contains 60 galaxies within a radius of approximately 900 kpc (Mulchaey et al. 2003). The central galaxy hosts an extended, low-power radio source (Vrtilek et al. 2002).
Our GMRT images at 235 MHz and 610 MHz have been presented in Gitti et al. (2010). Here we report the images in Fig. 12, overlaid on the POSS-2 and smoothed Chandra images. The source has a double morphology at both frequencies. At 610 MHz the radio lobes extend out to a radius of 14 kpc from the center. At lower frequency, the emission reaches a larger distance (22 kpc) and appears bent toward the east.
HCG 62 represents one of the clearest cases of AGN interaction in our sample. The Chandra image in Fig. 12 shows the two prominent X-ray cavities detected to the north and south of the group core by Vrtilek et al. (2002). This was the first report of cavities in a group of galaxies. Previous radio observations at 1.4 GHz revealed only weak extended emission, partially overlapping the southern cavity, and failed to detect any radio emission from the northern cavity (Vrtilek et al. 2002). Gitti et al. (2010) used Chandra and XMM-Newton data in combination with the GMRT images shown in this paper to study the X-ray properties of the hot gas in HCG 62 and its interaction with the central radio galaxy. Both cavities were found to be associated with the low-frequency radio plasma detected by our GMRT observations. The radio lobes totally fill the cavities at both frequencies, and even extend beyond them at 235 MHz (Fig. 12, right). The presence of such faint radio emission outside the cavities, with no counterpart at 610 MHz, may suggest two distinct episodes of AGN outbursts in this group. Deeper multi-frequency GMRT observations, carried out during Cycle 17, will allow us to test this possibity.
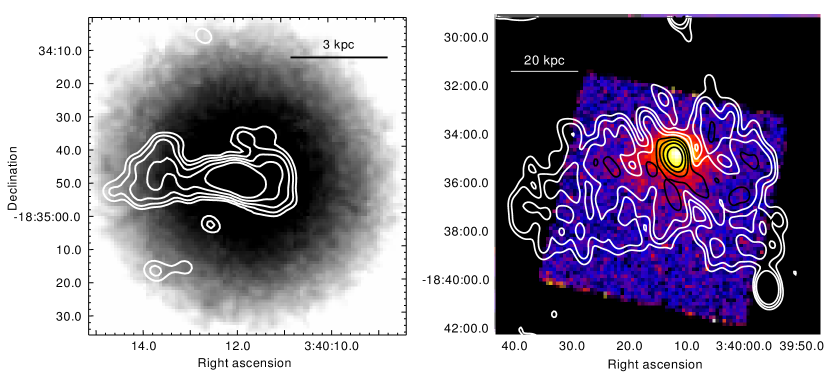
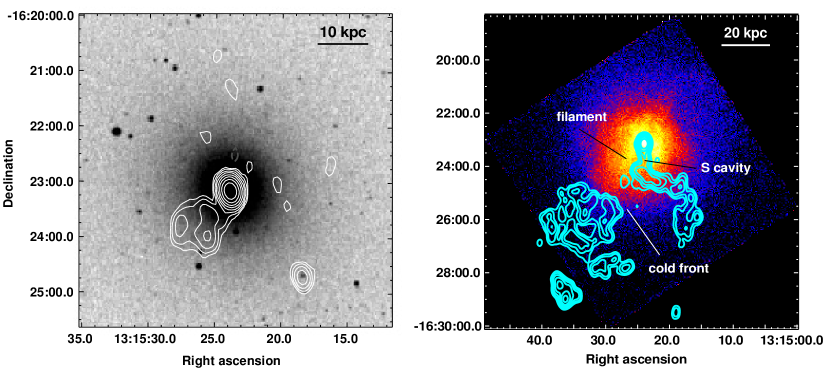
5.13. NGC 5044
NGC 5044 is the central member of a rich group, which is the brightest in X-ray luminosity in the GEMS compilation of nearby groups (Osmond & Ponman 2004, Miles et al. 2004, 2006). The radio data available in the literature prior to this work, and in the VLA archives, are limited to a few observations that detect only a flat-spectrum radio core (e.g., Sparks et al. 1984).
Our GMRT images at 235 MHz and 610 MHz have been presented in David et al. (2009). Here we report the images in Fig. 13 overlaid on the optical (left) and Chandra (right) images. Beyond the central core, extended emission is clearly revealed by our GMRT observations; a faint radio lobe, with a size of 12 kpc, is detected at 610 MHz. The radio emission at 235 MHz is much more extended than the emission at 610 MHz, with little overlap between the two frequencies. The 235 MHz image shows a bright radio jet, misaligned with respect to the 610 MHz lobe. The jet is not straight: a bend occurs toward the west at 9 kpc from the core; at a larger distance, the jet deviates again, curving by almost 90 degrees toward the south. The 235 MHz image also reveals a region of low-surface brightness emission, with a rather clumpy appearance, located at (28 kpc) south-east of the core and apparently detached from the radio jet. The lack of any detected emission at 610 MHz in the same region as the 235 MHz emission indicates that the emission must be very steep with a spectral index of .
The deep Chandra observation of NGC 5044 analyzed by David et al. (2009) revealed interesting X-ray substructures, clearly visible in both the raw and unsharp mask images (their figures 1 and 3 ), and most likely generated by the interaction of the group gas with the central radio galaxy. The axis of the 610 MHz lobe was found to be coincident with a filament of cool gas extending approximately 20 kpc to the south-east (see also Fig. 13, right). This was interpreted as gas being lifted from the group center by the buoyantly rising lobe, which is being inflated by an ongoing AGN outburst in NGC 5044. A number of small X-ray cavities were found around the group center (see also Gastaldello et al. 2009). No radio emission is detected from these cavities at the sensitivity level of our GMRT observations (Table 1), with the exception of the largest cavity, south of the center, which is totally filled by the the inner part of the 235 MHz jet (right panel of Fig. 13; see also Figs. 5 and 6 in David et al. 2009). Interestingly, the detached radio lobe, detected at 235 MHz, appears to be located just beyond a cold front at 30 kpc toward the south-east from NGC 5044 (David et al. 2009, 2011). Most likely, the 235 MHz emission was produced by past activity of the central AGN. It is unclear whether the jet and detached lobe come from the same outburst or possibly two separated outbursts. New, deeper GMRT observations at 235, 327 and 610 MHz (carried out during Cycle 17) will allow us to study with unprecedented detail the complex and unique low-frequency radio properties of NGC 5044.
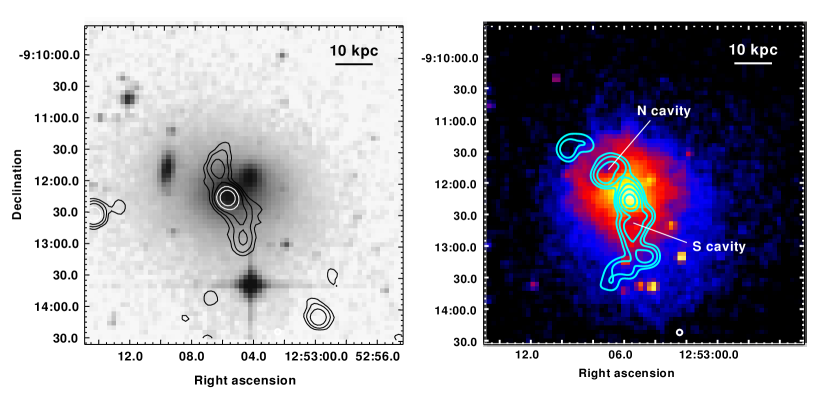
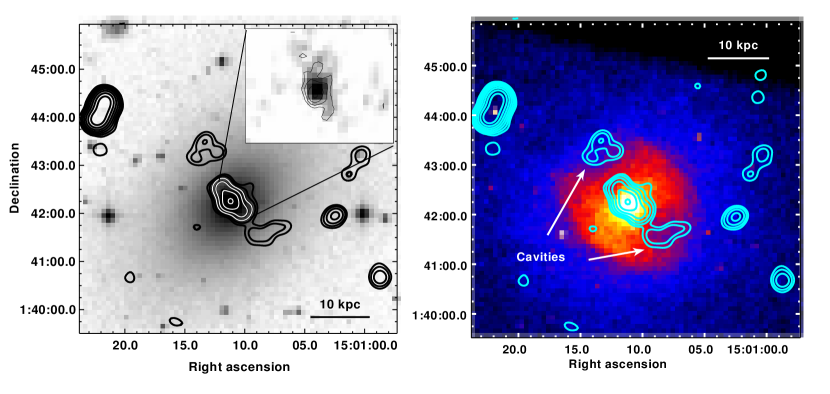
5.14. NGC 5813
The giant elliptical NGC 5813 dominates a group of early-type galaxies. The system is a subgroup of a larger complex that includes the more massive group NGC 5846 (Sec. 5.15), which lies at 1.4∘ from NGC 5813 in the plane of the sky (Mahdavi, Trentham & Tully 2005; Eigenthaler & Zeilinger 2010). With a total radio power of W Hz-1 at 1.4 GHz, the radio source associated with NGC 5813 is the least powerful in our sample (Table 1).
We observed NGC 5813 only at 235 MHz (Fig. 14). The galaxy hosts a central, triple component 9 kpc in extent. The 1.4 GHz image from the Faint Images of the Radio Sky at Twenty-Centimeters (FIRST) resolves this component into a point source and two faint extended structures (inset). At larger distances from the center, the 235 MHz image reveals a pair of lobes located along the same axis of the central component. The northern lobe appears detached, whereas the southern lobe is closer and apparently connected to the central region. The overall morphology of NGC 5813 may recall the double-double radio galaxies (e.g., Schoenmakers et al. 2000), consisting of a pair of double lobes having a common nuclear source, although the linear size of double-double sources is usually much larger than NGC 5813. Both outer lobes in NGC 5813 are undetected in the 1.4 GHz NVSS image, which shows only a point source coincident with the triple component detected at 235 MHz. This implies a very steep spectral index () for both lobes.
In the X-ray band, the NGC 5813 group possesses a system of multiple, aligned cavities at 1 kpc, 8 kpc and 20 kpc from the central source (Randall et al. 2011). The smoothed Chandra image is shown in Fig. 14 (right). Two small, symmetrical X-ray cavities with bright rims are located at only 1 from the centre (Randall et al. 2011). These inner cavities, not visible in Fig. 14 due to the smoothing, are associated with the extended radio emission visible in the FIRST image. Fig. 14 shows a second pair of larger cavities at 8 kpc from the centre, along the same axis as the inner bubbles. These appear as ghost cavities at 1.4 GHz, but are clearly filled by the radio lobes detected at 235 MHz. The Chandra data also reveal the existence of an additional third set of cavities at a radius of 20 kpc, nicely aligned with the other two pairs (Randall et al. 2011). The combination of the radio and X-ray properties of this system suggests multiple episodes of activity: the inner cavities might be associated with the most recent, central radio activity; the steep-spectrum 235 MHz radio bubbles may have been inflated by a former AGN outburst. Indeed, double-double radio galaxies are considered one of the most striking examples of recurrent activity, when a new pair of inner lobes are produced close to the nucleus before the previously generated, more distant lobes have completely faded (e.g., Subrahmanyan, Saripalli & Hunstead 1996; Lara et al. 1999; see also Saikia & Jamrozy 2009 for a recent review on recurrent activity in AGNs). Finally, the outermost cavities might be associated with even older radio activity, undetected at the sensitivity limit of the existing 235 MHz image. Deeper GMRT observations at 235, 327 and 610 MHz have been obtained during Cycle 18 to investigate in detail the recurrent activity in this system.
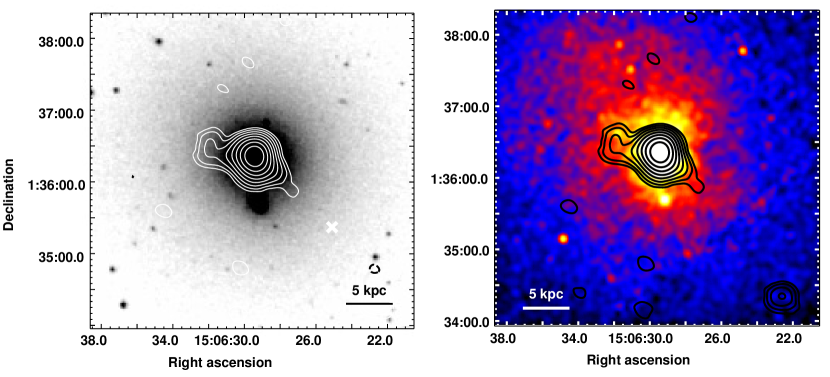
5.15. NGC 5846
NGC 5846 is the giant, dominant elliptical of a massive and rather isolated galaxy group, which has more than 250 possible member galaxies with spectroscopic confirmation for 80 of them (Mahdavi et al. 2005, Forbes et al. 2006). The galaxy has very low-power radio emission at 1.4 GHz, and, in fact, it is the second weakest source in Table 1.
We observed the radio galaxy with the GMRT only at 610 MHz. During the observation, several antennas suffered problems and were flagged during the data reduction. This led to a rather asymmetric beam (15; Table 2) in the images produced from the full array. In Fig. 15, we present the 610 MHz image convolved with a circular beam with FWHM=15′′. At this resolution, we detect an unresolved, bright component, and a small extension of 3 kpc toward the east. Hints of much fainter extended emission are visible on the opposite side, though it is only one contour level at significance.
In the X-ray band, the NGC 5846 group has been studied in detail by both Chandra (e.g., Trinchieri & Goudfrooij 2002) and XMM-Newton (e.g., Finoguenov et al. 2006) observations. On the large scale, the group has a very asymmetric X-ray halo, whose central part is shown in Fig. 15 (right). Chandra also revealed a complex X-ray morphology in the innermost region (radius kpc) of the group core. The main feature is a prominent, arc-like structure (Trinchieri & Goudfrooij 2002). Two small X-ray cavities have been identified at kpc from the group center by allen06 and confirmed by Dong, Rasmussen & Mulchaey (2010). The low resolution of our 610 MHz image does not allow a direct comparison between the radio emission and these X-ray cavities, which are all located in the region covered by the radio point source. Recently, Machacek et al. (2011) found an X-ray cavity kpc west of the central source. No radio emission is detected at 610 MHz in this cavity.
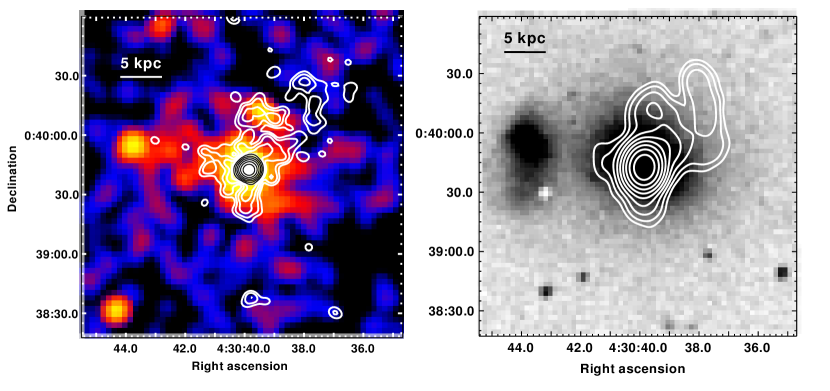
5.16. AWM 4
AWM 4 is a poor cluster of galaxies centered on the giant elliptical NGC 6051 which hosts the radio galaxy 4C+24.36. Our GMRT images at 235, 327 and 610 MHz have been presented and analyzed in Giacintucci et al. (2008). Here we report the 235 MHz and 610 MHz flux densities and corresponding spectral index in Table 4. Giacintucci et al. (2008) classified 4C+24.36 as a FR I/FR II transition wide-angle-tail (WAT), where both ram pressure, caused by the motion southward of the host galaxy, and buoyancy forces seem to have shaped the radio structure. The source possesses twin jets with prominent, symmetric wiggles, and large lobes extending 80 kpc from the radio core. Based on the jet to counterjet brightness ratio, the central 10 kpc region of the jets was found to be likely oriented close to the plane of the sky. Analysis of the gradual steepening of the spectral index along the jets and lobes provided an estimate of the radiative lifetime of 160 Myr, indicating that the source is likely very old.
The XMM-Newton observation of AWM 4 revealed a very relaxed system with no evidence of cooling in the cluster core and no X-ray cavities (O’Sullivan et al. 2005; Giacintucci et al. 2008; Gastaldello et al. 2008). A deep 75 ksec Chandra observation was recently presented by O’Sullivan et al. (2010a, 2010b). A small cool core (or galactic corona), with only 2 kpc radius, was discovered at the group center, coincident with the radio core. The cool core appears able to fuel the AGN for long periods, possibly explaining the long outburst timescale of the radio source (O’Sullivan et al. 2010a). With the exception of a small X-ray surface brightness decrement at the center of the east lobe, no clear large X-ray cavities were detected at the location of the lobes, suggesting that these are only partially filled by relativistic plasma (O’Sullivan et al. 2010a). Analysis of the abundance distribution in the cluster core revealed evidence of high-metallicity material correlated with the radio jets (O’Sullivan et al. 2010b). The jets may have entrained the gas enriched in the inner regions of the central galaxy and transported it out along their direction of propagation.
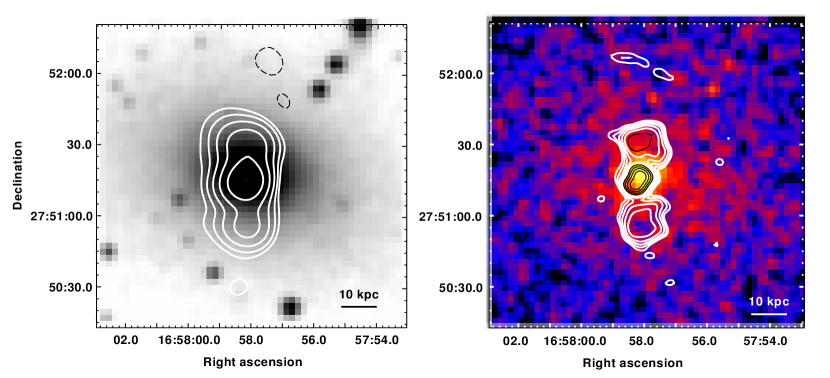
5.17. NGC 6269
The cD galaxy NGC 6269, at the center of the poor cluster of galaxies AWM 5, hosts a low-power (Table 1), small radio source (Burns, White & Hough 1981; Giacintucci et al. 2007).
Our GMRT images are shown in Fig. 16. On the left, the 235 MHz contours are overlaid on the optical image, while the right panel shows the X-ray emission of the cluster with the 610 MHz contours overlaid. The radio emission is totally contained within the optical envelope of the host galaxy. In the 5′′ resolution image at 610 MHz, the source is resolved in three components. Similar to the GMRT image at 1.28 GHz in Giacintucci et al. (2007), the axis of the central component is misaligned with respect to the north-south axis connecting the outer lobes.
The right panel of Fig. 16 shows the smoothed Chandra image of AWM 5. The recent Chandra analysis by Baldi et al. (2009b) shows the system to possess a small ( 8 kpc), dense cool core and two possible X-ray cavities at the locations of the radio lobes. However, these cavities are difficult to study in detail because they are rather small and have a low contrast with the surrounding emission.
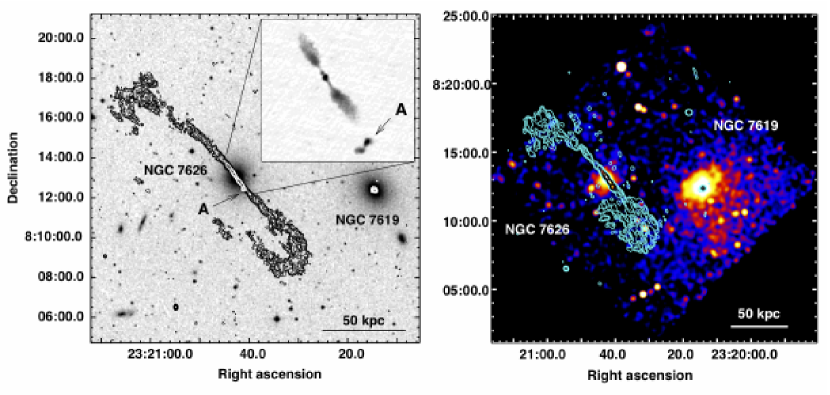
5.18. NGC 7626
NGC 7626 is one of the two brightest ellipticals in the Pegasus galaxy group. The dominant galaxy, NGC 7619, lies kpc from NGC 7626 in the plane of the sky. A radio point-source is associated with NGC 7619, while NGC 7626 hosts a very extended radio source with symmetric jets (Jenkins 1982; Birkinshaw & Davis 1985).
Our GMRT images of the NGC 7619/NGC 7626 system are shown in Fig. 17 as contours on the POSS-2 and Chandra images. The high sensitivity of our observations allows us to image the WAT radio galaxy NGC 7626 in its whole extent, including the low-surface brightness tails at the end of the jets. The total size of the source is 13′, corresponding to approximately 180 kpc. A background radio source (A in the left panel) is projected onto the southern jet. The inset shows the 1.4 GHz image at a resolution of , obtained from the VLA archive (project AF188), which resolves the source into a small double. The image also shows the bright core and inner jets of NGC 7626. An unresolved radio source is detected at the position of NGC 7619. The flux densities of NGC 7626 in Table 4 do not include the contribution of the background radio galaxy A, having a flux of 15012 mJy and 623 mJy at 235 and 610 MHz, respectively.
The Chandra image in Fig. 17 (right) shows the X-ray halo of NGC 7626 and the much larger and asymmetric X-ray emission associated with NGC 7619. This asymmetry might arise from gas stripped during the infall of NGC 7619 into the group (Trinchieri, Fabbiano & Kim 1997). The recent Chandra study by Randall et al. (2009) showed the presence of sharp X-ray brightness edges in each galaxies, which were interpreted as cold fronts generated by a major merger between the NGC 7626 and NGC 7619 subgroups. No substructures in the X-ray image appear to be associated with the extended radio emission from NGC 7626, but there is an apparent correlation between the southern lobe and the temperature map (Randall et al. 2009).
6. Discussion
In this paper, we presented new low-frequency GMRT images at 235 MHz and 610 MHz of 18 X-ray bright, nearby groups of galaxies. Furthermore, we carried out a qualitative comparison between the GMRT radio images and simple X-ray intensity images from Chandra and XMM-Newton data to investigate the presence of correlations between the radio structures and substructures in the IGM.
Table 5 summarizes the main radio and X-ray properties of the groups. The number and type of X-ray cavities are from the literature, while the source class is defined in Sect. 6.4. The table shows that our sample includes a large multiplicity of situations both in the radio and X-ray bands. The radio sources are extremely diverse in radio power, physical scale and morphology. Powers range from very low-power FR I sources ( W Hz-1) to FR I/FR II transition radio galaxies ( W Hz-1), and sizes range from galactic to group/cluster scales. The observed radio structures include classic, double-lobed radio galaxies, both giant and extended on much smaller scale, tailed sources, morphologies similar to the core-halo sources found in cool core clusters (e.g., Mazzotta & Giacintucci 2008 and references therein) and more complex and irregular, extended structures.
In the X-ray band, the systems also appear very inhomogeneous. The X-ray luminosities cover three orders of magnitude, i.e., from erg s-1 (NGC 1587) to erg s-1 for the poor cluster AWM 4. In half of groups, the X-ray images show evidence of AGN-driven disturbances, the most spectacular examples being cavities detected in the X-ray surface brigthness (e.g., HCG 62, NGC 4636, NGC 5813). Distorsions in the group X-ray emission, edges and fronts are also observed in a number of system; in some objects, these are probably caused by the central radio source (e.g., NGC 507), while in other sources interactions between the group and a nearby, larger system might play a role (e.g., NGC 1407, NGC 7626). The sample also includes examples of apparently relaxed groups, with no clear substructure in the X-ray surface brightness, but with a significant level of disturbance in the temperature and abundance distribution (e.g, NGC 3411).
The combined variety of radio and X-ray structures makes any classification of the systems in our sample difficult. The central radio galaxy clearly perturbs the surrounding intragroup medium in some groups, such as cavity systems. In other groups, the AGN/IGM interaction does not strongly manifest itself in the X-rays, but rather through the effects of the high-density thermal gas on the morphology and evolution of the radio-emitting plasma; the IGM can strongly distort the radio structures or confine the radio plasma and prevent its dissipation through adiabiatic expansion.
While a detailed study of the radio/X-ray correlations in our group sample will be presented in future papers (O’Sullivan et al. 2011, O’Sullivan et al. in preparation, Giacintucci et al. in preparation), in the following sections we will provide a qualitative discussion of the effects of the IGM on the radio sources and viceversa and derive some general conclusions on the interplay between the AGN and IGM for the groups in our sample.
6.1. Radio power and linear sizes
The linear size of FR I radio galaxies is known to increase with increasing radio power (Ledlow, Owen & Eilek 2002, hereinafter referred as L02). No significant differences are found between the size distribution, as a function of the power, for sources inside and outside the cores of rich clusters (L02).
Using the 235 MHz powers and linear sizes in Table 5, we can plot the radio largest linear size against for our sources (note that NGC 5846 was not observed at 235 MHz and, therefore, is not included in the analysis). The plot is shown in Fig. 18. The empty circle and empty square mark the location of the complex radio sources associated with NGC 5044 (Fig. 13) and HCG 15 (Fig. 6), respectively. Our sources cover a wide range of spatial scale, from LLS 10 kpc to over a Mpc (the largest extent being in NGC 315). Within this interval of sizes, the radio power spans four orders of magnitude, from W Hz-1 (NGC 4636) to W Hz-1 (NGC 383).
The size distribution of our groups seems in agreement with the FR I power/size relation in L02, even though an accurate comparison is not possible (different frequencies and unspecified cosmology used by L02). Although our sample is not a statistical sample, our result indicates that the correlation between power and size is independent of the environment of the galaxy, as was suggested by the results of L02 for radio sources inside and outside clusters and by Giacintucci et al. (2007) for poor and rich clusters. Our sources are located in similar environments, i.e., of optically identified galaxy groups, yet we find among them a variety of sizes and powers similar to that found for larger samples of FR I sources which include rich cluster and field radio galaxies.
6.2. Radio morphology
The radio emission in our groups is characterized by a large variety of structures (Table 5). In particular, the following morphologies were found:
-
1)
three very extended ( kpc) double sources, i.e., the well-known giant sources B2 0055+30 and 3C 31 in NGC 315 and NGC 383, respectively, and the lobe-dominated double at the centre of MKW 2. The 235 MHz observation of 3C 31 allowed us to trace its emission on a total angular scale of 43′ ( 900 kpc). This is the largest size reported so far for this source. All three giant radio galaxies show disturbed and bent tails/lobes;
-
2)
six double radio sources, with sizes between 6 kpc (NGC 1407 at 610 MHz) and 200 kpc (NGC 7626). With the exception of UGC 408, which shows two bright and straight jets surrounded by a diffuse cocoon, and NGC 6269, a relatively symmetrical double with a bright central component, all the other doubles exhibit disturbed morphologies. These manifest themselves in the form of twisted and warped jets (NGC 4636), strongly distorted and asymmetric lobes (NGC 507), and bent lobes or tails (HCG 62, NGC 7626, NGC 1407). The small ( kpc) asymmetric double, detected at 610 MHz in NGC 1407, is totally enclosed in a much larger (80 kpc) emission with a diffuse appearance that is detected only at 235 MHz. Such a peculiar radio structure might arise from restarted radio activity (the small double) co-existing with the fading emission from a former outburst (the diffuse component);
-
3)
a 160 kpc wide-angle-tail in the poor cluster AWM 4. The bent morphology of the source is likely caused by the combined effects of ram pressure, caused by the motion southward of the host galaxy, and buoyancy forces (Giacintucci et al. 2008);
-
4)
a bright nuclear source with a tiny (3 kpc) extension at 610 MHz in NGC 5846;
-
5)
amorphous emission around the nuclear component in the groups NGC 1587 and NGC 3411, similar to the core-halo sources in cool-core clusters (e.g., Mazzotta & Giacintucci 2008 and references therein), although on a much smaller scale;
-
6)
very complex emission in the galaxy system NGC 741/NGC 742, including a nuclear source in each galaxy, a bridge connecting these components, a spectacular twisted 150 kpc long tail, and a region of diffuse emission to the east of NGC 742. Such a peculiar morphology is likely caused by the superposition of two interacting radio galaxies. A possible interpretation is that the tail originates from NGC 742, while the eastern diffuse structure is emission from NGC 741, which is bent by the galaxy interaction;
-
7)
diffuse, low-surface brightness emission with no centrally-peaked component and extending for 150 kpc between the dominant galaxies of HCG 15. Two of them, HCG 15d (A) and HCG 15a (B), host a point source;
-
8)
a nuclear source and extended structure in NGC 5044. The extended emission has the form of a faint lobe at 610 MHz, which is not detected at 235 MHz. At 235 MHz, the radio image reveals instead a distorted jet, misaligned with respect to the axis of the 610 MHz lobe, and a detached region of low-surface brightness emission at 30 kpc from the nuclear component. Superposition of several radio structures from multiple radio outbursts occurring at different times might explain the morphological complexity of this system;
-
9)
a possible double-double radio source 20 kpc size hosted by the giant elliptical NGC 5813.
As for FR I radio galaxies in the dense central regions of galaxy clusters (e.g., Owen, White & Burns 1992; Owen, White & Ge 1993; Giacintucci et al. 2007 and references therein), distorted and asymmetric radio morphologies are common for group-central radio galaxies. The majority of our group sources show disturbances at some level. The surrounding, dense thermal gas likely plays the major role in shaping and deforming the extended components of radio sources, i.e., jets, lobes and tails, both in groups and clusters.
6.3. Radio spectral index and restarted activity
The environment in which radio galaxies reside may affect not only the radio morphology, but also the spectral properties of the radio emission. Radio galaxies in dense environments, such as cluster cores, tend to have steep radio spectra compared to objects in the field (e.g., Slee et al. 1983; Slee & Reynolds 1984; Roland et al. 1985; Slee et al. 2001; Bornancini et al. 2010). Cluster core radio sources have typical spectral indices up to extreme values of 2. Such steep radio spectra may be caused by the confinement of the relativistic plasma by the high pressure and dense external medium; the intergalactic medium prevents the radio source from expanding and the evolution of the radio plasma is controlled only by synchrotron and inverse Compton energy losses, resulting in a steepening of the radio spectrum. Furthermore, the confinement of the relativistic plasma in dying radio sources – objects where the nuclear activity has stopped and the radio lobes are fading – could sustain the radio emission longer than expected and prevent its fading through adiabiatic expansion (e.g., Murgia et al. 2011 and references therein).
The spectral indices of 15 radio sources in our sample, measured between 235 MHz and 610 MHz, are listed in Table 4. Only 6 of 15 sources have . All the remaining sources indeed have steep spectra, with between and for the largest majority (6 of 9), and ultra-steep values for NGC 5044 and NGC 1407. An upper limit of is listed for NGC 315, as the flux density measured on the GMRT image at 610 MHz ( Jy) is underestimated (see Sect. 5.2). Using the flux at 609 MHz measured by Mack et al. (1998) on the WSRT image ( Jy), the spectral index of NGC 315 becomes .
The result that 9/15 of the sources have a steep radio spectrum suggests that, as in clusters, group radio galaxies tend to have steep radio spectra compared to objects residing in less dense environments.
The ultra-steep spectra of NGC 5044 and NGC 1407 deserve further comment. Here, the steepness of the spectral index is determined by the extreme discrepancy in structure and size between the radio emission detected at the two frequencies, with the 235 MHz emission covering a much larger area (one order of magnitude more extended in the case of NGC 1407) than the structure visible at 610 MHz. This suggests the co-existence of at least two distinct radio outbursts in both systems. The presence of old, steep-spectrum emission, generated by former activity predominanting at 235 MHz, reflects the steep value of found for these two objects.
Similarly to NGC 5044 and NGC 1407, there is evidence for multiple outbursts in HCG 62 and NGC 5813, and possibly in NGC 741 and NGC 4636. The combination of the X-ray properties (e.g., multiple cavities or multiple pairs of cavities) and radio properties (e.g., steep-spectrum emission detected only at 235 MHz or more extended emission at this frequency than at 610 MHz) suggests that restarted activity has occurred also in these groups.
Finally, NGC 507 represents a special case, as it has been argued that the source is a dying radio galaxy whose curved radio spectrum is dominated by the fading lobes (Murgia et al. 2011). The high pressure of the external medium could have reduced or even stopped the expansion of the lobes and the resulting confinement of the radio plasma might prevent the quick dissipation of the lobes through adiabiatic expansion.
NGC 507 and the systems with restarted activity are all cases where the IGM has strongly influenced the evolution of the relativistic plasma. For instance, as in NGC 507, the old, extended radio emission detected at 235 MHz in NGC 5044 and NGC 1407, with no counterpart at 610 MHz, will be visible at the lower frequency because of the radio plasma confinement by the dense X-ray emitting gas.
6.4. Radio/X-ray comparison
The targets of our GMRT project were chosen to show structures in either the X-ray or radio which may indicate interactions between the central radio galaxy and the intra-group medium. In half of the cases, we did find‘ evidence for such interactions in the form of clear associations between the radio and X-ray structures (e.g, radio-filled X-ray cavities), but, in the remaining cases, the expected radio/X-ray correlations appear less obvious or are not clearly detected. In general, the groups which were selected to possess significant substructure in the X-ray band (mostly cavity systems) and with little radio emission at frequencies 1 GHz, show radio structures in our deep, low-frequency radio observations, which seem to correlate with the IGM substructures (NGC 5044, NGC 5813, HCG 62, NGC 4636). This may imply that the X-ray emission preserves a record of inflated cavities for a longer time than the high radio frequency emission, but not beyond the time when the radio emission fades at lower frequencies.
Although a detailed classification of our systems is not straightforward, we can group the sources into three broad classes (also reported in Table 5), which may help to elucidate the nature of the interaction occurring between the AGN and the IGM in these groups.
Class 1: Small radio sources with jet/lobe structures confined to the group core.
In these groups we observe the strongest evidence of AGN/IGM interactions. The most striking examples are the X-ray cavity systems, which make up 10/18 of our groups (Table 5). In 3 systems, cavities have a bi-polar distribution (HCG 62, NGC 5813, NGC 6269). In particular, HCG 62 and NGC 6269 possess a set of cavities, symmetric with respect to the group center, both of which coincide with the lobes of the central radio galaxy. NGC 5813 represents an exceptional case of multiple bi-polar cavities, with two pairs (inner and middle) of radio-filled cavities and a possible third set of ghost cavities, all nicely aligned along the same axis. In two systems (NGC 5044 and NGC 4636), cavities appear almost isotropically spread around the centre at roughly the same radius, although they must have been produced at different times. The fact that some of these cavities are filled by radio-emitting plasma, while others are radio-quiet even at low frequencies, might reflect the different ages of the cavities. Group weather, due to previous AGN outbursts or motion of the galaxy with respect to the center of the group potential, may be responsible for the isotropic distribution of the cavities (David et al. 2009, 2011).
In the radio band, all cavity systems, with the exception of the ghost cavity in NGC 741 and the small cavity in the east lobe of AWM 4, host a relatively small, low- or mid-power double radio source (Table 5). While this could be biased by the difficulty in detecting X-ray cavities at larger radii due to the lower surface brightness, it may also suggest that cavities preferentially occur when we have a less powerful source expanding into the relatively dense environment of a group core.
Class 2: Large radio sources with jet/lobe structures extending beyond the group core.
This category includes the groups with the powerful, extended radio sources NGC 315, NGC 383, MKW 2, and NGC 7626, whose radio lobes/tails escape from the group core and reach a large distance (between 90 and 600 kpc) from the center. No clear cavities are detected at the lobe/tail location in the current X-ray images of these systems and in some cases the radio source extends outside the X-ray field of view. However, we cannot exclude the possibility that cavities are present, but are undetected due to the low X-ray surface brightness in such a peripheral region of the group X-ray halo. Cavagnolo et al. (2010) categorize some of these systems as ”poorly confined” and suggest that their large sizes indicate faster moving jets which have entrained only small masses of gas from the group core.
Class 3: Amorphous/diffuse radio sources.
The groups NGC 1587 and NGC 3411 are characterised by nuclear radio emission from the central galaxy surrounded by an amorphous component, rather than distinct jets or lobes. Their sizes are rather small (20 kpc for NGC 1587 and 80 kpc for NGC 3411) and they have low to moderate radio powers (Table 5). These groups do not show X-ray cavities and the lack of radio jets and lobes seems to naturally explain their absence.
Groups may also host diffuse radio emission that is not clearly associated with individual group
galaxies, but rather with the intra-group medium. This is the case of
HCG 15, a system that does not appear to be completely relaxed,
and contains several bright ellipticals rather than a
single dominant galaxy. While such radio emission might be the remnant
of an old, detached radio lobe subject to the intra-group gas motion, it may
also be emission arising from a broad shock front generated by the passage
of a galaxy through the core of the group, as suggested by the comparison
with Stephan’s Quintet (O’Sullivan et al. 2009).
We note that some systems can be placed in more than one of the
classes described above. For instance AWM 4, NGC 7626 and
NGC 741 are objects between classes 1 and 2, having extended radio jets
or tails (LLS kpc) and some indication of cavities. Similarly,
NGC 1407 can be classified as class 1 or 3 depending on the radio
frequency: the group hosts a small double at 610 MHz (class 1), but, at
the same time, the detection of diffuse emission at 235 MHz places the source
in class 3. Overlaps of this sort are inevitable in any
classification scheme, but we consider them to be informative rather
than an indication that the scheme is over-simple.
The temperature structure of the groups will be addressed in a future paper, but in broad terms we find that systems in classes 1 and 2 typically have cool cores, while some of those in class 3 do not, at least at the spatial resolutions achievable with the available X–ray data. This is in agreement with the finding of Sun (2009) that group and cluster dominant galaxies with strong radio AGN are located in a cool core. The physical scale of the cool cores varies between groups, with some of our systems having small-scale cool cores or galactic coronae. We note that these occur in both classes 1 and 2, e.g., NGC 6269 (Baldi et al. 2009) and AWM 4 (O’Sullivan et al. 2010a).
6.5. Gas entropy excess in galaxy groups
Poor clusters and groups show a significant excess of gas entropy with respect to the expectations from gravitational interaction of gas with dark matter (Finoguenov et al. 2002, Ponman, Sanderson & Finoguenov 2003, and references therein). This is interpreted as evidence for non-gravitational processes affecting the properties of the IGM. The entropy enhancement could occur at high redshift, by heating the gas at or before the time of group formation (pre-heating). Alternatively, the entropy might be raised at low redshift by heating the gas in the core or by removal of the coolest gas.
AGN feedback is now widely regarded as the most likely mechanism for increasing entropy at low redshift. Numerous studies have shown that the energy stored in radio lobes and X-ray cavities is sufficient to balance radiative cooling across a wide range of mass scales (see McNamara & Nulsen 2007, and references therein). At group scales, the idea seems to find support in the tentative evidence that the IGM in radio-loud groups has on average a higher temperature than radio-quiet groups of the same luminosity (Croston, Hardcastle & Birkinshaw 2005). Studies of the two-dimensional entropy distribution of galaxy groups also suggest that episodic heating, rather than passive evolution after an early preheating phase, is required to reproduce observed IGM properties (Johnson, Ponman and Finoguenov 2009). On the other hand, Jetha et al. (2007) find that the entropy profiles of groups with a central bright radio source are not significantly different from those of radio-quiet groups. The Jetha et al. (2007) analysis focusses on the central regions of groups, whereas Croston et al. (2005) use temperatures derived from a larger fraction of the group halo, which may in part explain the difference. Furthermore, Croston et al. (2005) use radio data at 1.4 GHz, which are mostly sensitive to the current phase of activity of the AGN, but in fact the increased entropy in some groups may be driven by past AGN activity. In some AGN heating models, the entropy excess can indeed last for a considerable long time after the AGN activity has ceased (Roychowdhury, Ruszkowski & Nath 2005). Dwarakanath & Nath (2006) approached this issue by selecting from the sample in Croston et al. (2005) radio-quiet groups that most deviate from the extrapolation of the relation from rich clusters and that do not show signs of current AGN activity at 1.4 GHz that could explain such a deviation. In search of radio emission produced by possible past AGN activity, they observed these systems with the GMRT at lower frequency, but found no evidence of such radio emission.
Numerical simulations including AGN feedback find that strong feedback can raise the entropy of the IGM to a level comparable to what is observed (McCarthy et al. 2010; Muanwong et al. 2002). In these AGN heating models, most of the work of AGN feedback occurs at fairly high redshift, when the energy input from the AGN is sufficient to remove gas from low mass groups (less than a few times 1014 ) or, alternatively, to increase the entropy of the gas so much that this material will never be accreted by the system.
This raises the interesting question whether the examples of possible AGN feedback seen in our sample of local groups are in conflict with these models. The nature of our sample, which by selection includes gas rich systems where the signs of the AGN/IGM interaction can be seen in the X-ray images, makes it difficult to answer this question. If high-redshift heating has removed a considerable amount of gas from groups, these systems would be too faint for detailed observations in the X-ray band and, thus would not fall within our selection. The outbursts in most of our systems are not powerful enough to eject gas from the group. Two of the most powerful radio sources in the sample, NGC 315 and NGC 383, reside in groups which are gas poor. However, the mismatch between source size and area covered by the X-ray image prevents a clear understanding of how (and if) the radio source is affecting the intra-group medium in these two systems. In half of the sample we observe X-ray substructures likely induced by AGN activity, suggesting that AGN outbursts may be affecting the gas entropy right now. In particular, cavities buoyantly rising from the group center should temporarily alter the entropy profile of the gas by uplifting gas behind them, and shocks (as, for instance, in NGC 5813, Randall et al. 2011) will increase the entropy of the gas. The systems in the sample with evidence of AGN/IGM interaction are mostly gas-rich groups with low- and intermediate-power central radio galaxies. This suggests that the current AGN activity in these systems is weak compared to that proposed as the cause of gas expulsion at high redshifts, and perhaps that our sample is biased toward systems which had less AGN heating at high redshift and so retained most of their gas.
A more detailed analysis of the gas properties of our sample is deferred to a future paper and may provide valuable information on the way gas entropy in groups is altered by AGN activity in the local Universe. Because of the bias toward gas rich groups, our sample is probably not suitable to test the proposed AGN heating models at high redshift.
7. Summary
In this paper, we presented low-frequency GMRT observations of 18 nearby (), elliptical-dominated groups of galaxies. The targets were chosen to possess structures, either in the X-ray surface brightness and temperature maps or radio morphology from the literature and radio archives, which may indicate interaction between the radio source and the surrounding intra-group medium.
The GMRT observations were carried out at 235 MHz and 610 MHz, with a typical observing time of 2-3 hours on source and a sensitivity in the final images in the range 35-100 Jy at 610 MHz and 0.2-1 mJy at 235 MHz. Our main results are summarized below.
-
1.
The GMRT images show a very diverse population of radio sources associated with the central elliptical galaxy in the groups. Similarly to FR I radio sources in galaxy clusters, our sample includes classic double-lobed sources, both giant and extended on the galactic scale, wide-angle-tail and head-tail sources, amorphous sources with a nuclear component resembling the core-halos in cool-core clusters (although on a much smaller scale), and more complex and irregular morphologies. In the unrelaxed group HCG 15, we detected low-brightness, diffuse emission extended on the group scale and not clearly associated with any of the group galaxies.
-
2.
The radio powers span four orders of magnitude, from W Hz-1 (i.e., very low-power FR I radio galaxies) up to 1025 W Hz-1 (i.e., FR I/FR II transition radio galaxies). The linear sizes cover a wide range of spatial scales, from LLS10 kpc to 1 Mpc. The distribution of the linear size as a function of the radio power is in general agreement with the power/size correlation of FR I radio galaxies inside and outside the cores of rich clusters (L02). This may suggest that the correlation between power and size is not dependent on the environment in which the radio galaxies reside.
-
3.
The comparison of the GMRT images with the Chandra and XMM-Newton images of the group X-ray emission reveals associated radio/X-ray emission in approximately half of the groups, the most evident example being the radio-filled X-ray cavities. The remaining systems show little or no clear correlation in the radio and X-ray images. In general, those groups with strong substructure in the X-ray images and with weak radio emission at 1 GHz, show radio structures in our low-frequency GMRT images, which correlate with the IGM substructures (NGC 5044, NGC 5813, HCG 62, NGC 4636). This suggests that the X-ray emission preserves a record of inflated cavities for a longer time than the high radio frequency emission, but not beyond the time when the radio emission fades at lower frequencies.
Although possibly biased by the difficulty in detecting X-ray cavities in large radio sources with jets/lobes extending beyond the group core (NGC 315, NGC 383, MKW 2, NGC 7626), cavity systems are typically associated with small double radio sources with a low or medium radio power (e.g., HCG 62, NGC 6269). Multiple cavity systems, with both radio-filled and ghost cavities, are observed in NGC 5813, NGC 4636 and NGC 5044. Here, repetitive radio outbursts could have inflated sets of cavities at different epochs. All multiple pairs of cavities have a bipolar distribution and are aligned along the same axis in NGC 5813, while group weather (David et al. 2011) could have spread the cavities isotropically around the group center in NGC 4636 and NGC 5044.
The lack of jets and lobes in amorphous radio sources such as NGC 1587, NGC 3411 and HCG 15, provides a natural explanation for the absence of X-ray cavities in these type of systems.
-
4.
The AGN/IGM interaction does not only manifest itself via evident radio/X-ray correlations, but also through the consequences of the high pressure of the IGM on the radio plasma and its evolution. We found that, as for cluster FR I radio galaxies, both the radio structures and spectral properties of our group-central sources appear strongly affected by the surrounding, dense thermal gas. The majority of the radio sources show morphological disturbances at some level, likely caused by the interaction with the IGM, which has shaped and deformed the radio jets, lobes and tails. A steep radio spectrum () is observed in of our sources, suggesting that, as in clusters, radio galaxies in the group cores tend to have steep radio spectra compared to objects in less dense environment. Such steep spectra may be explained in terms of the confinement of the relativistic plasma by the IGM, which can reduce and even inhibit the expansion of of the radio source, leaving only synchrotron and inverse Compton energy losses to control the evolution of radio plasma, resulting in a steepening of the spectral index.
The radio and/or X-ray properties provide evidence of at least two distinct radio outburts in NGC 1407 and NGC 5044 and hint at recurrent radio activity in other four groups of the sample (HCG 62, NGC 5813, NGC 4636, NGC 741). In these cases, the co-existence of the emission from fresh activity and from former outbursts is (wholly or partially) responsible for the steepness of the measured radio spectra.
The radio plasma confinement by the IGM can also sustain the radio emission for long times and prevent the extended emission in old, dying radio galaxies (e.g., NGC 507), and those with multiple outbursts, from fading through adiabatic expansion. For instance, the confinement may allow the low-frequency detection of steep-spectrum radio emission associated with former activity in restarted radio galaxies such as NGC 1407, NGC 5044 and NGC 5813.
In future papers (O’Sullivan et al. 2011, O’Sullivan et al. and Giacintucci et al. in preparation), we will compare the radio and X-ray properties of the groups in more detail, derive the spectral properties (integrated spectra and spectral index images), physical parameters and ages of the radio sources, and investigate their interaction with the group environment.
References
- (1)
- (2) Allen, S. W., Dunn, R. J. H., Fabian, A. C., et al., 2006, MNRAS, 372, 21
- (3)
- (4) Andernach, H., Feretti, L., Giovannini, G., et al., 1992, A&AS, 93, 331
- (5)
- (6) Baars, J. W. M., Genzel, R., Pauliny-Toth, I. I. K., Witzel, A., 1977, A&A, 61, 99
- (7)
- (8) Baldi, A., Forman, W., Jones, C., et al., 2009a, ApJ, 707, 1034
- (9)
- (10) Baldi, A., Forman, W., Jones, C., et al., 2009b, ApJ, 694, 479
- (11)
- (12) Baum, S. A., & O’Dea, C. P., 1991, MNRAS, 250, 737
- (13)
- (14) Birkinshaw, M., & Davies, R. L., 1985, ApJ, 291, 32
- (15)
- (16) Bîrzan L., Rafferty D.A., McNamara B.R., Wise M.W., Nulsen P.E.J., 2004, ApJ, 607, 800
- (17)
- (18) Bîrzan, L., McNamara, B. R., Nulsen, P. E. J., et al., 2008, ApJ, 686, 859
- (19)
- (20) Blandford, R.D., & Icke, V., 1978, MNRAS, 185, 527
- (21)
- (22) Blanton, E. L., Randall, S. W., Douglass, E. M., et al. 2009, ApJ, 697, L95
- (23)
- (24) Bornancini, C. G., O’Mill A. L., Gurovich, S., Lambas, D. G., 2010, MNRAS, 406, 197
- (25)
- (26) Bridle, A., Davis, M., Meloy, D. et al., 1976, Nature, 262, 179
- (27)
- (28) Bridle, A., Davis, M., Fomalont, E., et al., 1979, ApJ, 228L, 9
- (29)
- (30) Brough, S., Forbes, D. A., Kilborn, V. A., Couch, W., & Colless, M., 2006, MNRAS, 369, 1351
- (31)
- (32) Burch, S., 1977, MNRAS, 181, 599B
- (33)
- (34) Burns, J. O., White, R. A., & Hough, D. H., 1981, AJ, 86, 1
- (35)
- (36) Burns, J. O., Hanisch, R. J., White, R. A., et al., 1987, AJ, 94, 587
- (37)
- (38) Cavagnolo, K. W., McNamara, B. R., Nulsen, P. E. J., et al., 2010, ApJ, 720, 1066
- (39)
- (40) Chakrabarty, D., & Raychaudhury, S., 2008, AJ, 135, 2350
- (41)
- (42) Chandra, P., Ray, A., & Bhatnagar, S., 2004, ApJ, 612, 974
- (43)
- (44) Clarke, T. E., Sarazin, C. L., Blanton, E. L., et al., 2005, ApJ, 625, 748
- (45)
- (46) Clarke, T. E., Blanton, E. L., Sarazin, C. L., et al., 2009, ApJ, 697, 1481
- (47)
- (48) Condon, J. J., Cotton, W. D., Greisen, E. W., et al., 1998, AJ, 115, 1693
- (49)
- (50) Condon, J. J., Cotton, W. D., & Broderick, J. J., 2002, AJ, 124, 675
- (51)
- (52) Coziol, R., Brinks, E., & Bravo–Alfaro, H., 2004, AJ, 128, 68
- (53)
- (54) Croston, J. H., Hardcastle, M. J., Birkinshaw, M., et al., 2008, MNRAS, 386, 1709
- (55)
- (56) Croston, J. H., Hardcastle, M. J., & Birkinshaw, M., 2005, MNRAS, 357, 279
- (57)
- (58) David, L. P., O’Sullivan E., Jones C., et al., 2011, ApJ, 728, 162
- (59)
- (60) David, L. P., Jones C., Forman W., et al., 2009, ApJ, 705, 624
- (61)
- (62) de Vaucouleurs, G., de Vaucouleurs, A., Corwin, H. G., Jr., et al., 1991, S&T, 82Q, 621
- (63)
- (64) Diehl, S. & Statler, T.S., 2007, ApJ, 668, 150
- (65)
- (66) Diehl, S., Li, H., Fryer, C. L., Rafferty D., 2008, ApJ, 687, 173
- (67)
- (68) Dong, R., Rasmussen, J., & Mulchaey, J. S., 2010, ApJ, 712, 883
- (69)
- (70) Dunn, R. J. H., & Fabian, A. C., 2004, MNRAS, 355, 862
- (71)
- (72) Dunn, R. J. H., & Fabian, A. C., 2006, MNRAS, 373, 959
- (73)
- (74) Dwarakanath, K. S., & Nath, B. B., 2006, ApJ, 653L, 9
- (75)
- (76) Ebeling, H., Edge, A.C., Bohringer, H., et al., 1998, MNRAS, 301, 881
- (77)
- (78) Eigenthaler, P., & Zeilinger, W. W., 2010, A&A, 511, 12
- (79)
- (80) Eke, V. R., Frenk, C. S., Baugh, C. M., et al., 2004, MNRAS, 355, 769
- (81)
- (82) Fabbiano, G., Kim, D.-W., Brickhouse, N., 2002, AAS, 201, 1404
- (83)
- (84) Fabian, A. C., Nulsen, P. E. J., & Canizares, C. R., 1984, Nature, 310, 733
- (85)
- (86) Fabian, A. C., 1994, ARA&A, 32, 277
- (87)
- (88) Fabian, A. C., Celotti, A., Blundell, K. M., et al., 2002, MNRAS, 331, 369
- (89)
- (90) Fabian, A. C., Sanders, J. S, Taylor, G. B., Allen S. W., 2005, MNRAS, 360, L20
- (91)
- (92) Fabian, A. C., Sanders, J. S, Taylor, G. B., et al., 2006, MNRAS, 366, 417
- (93)
- (94) Fanaroff, B. L., & Riley, J. M., 1974, MNRAS, 167, 31
- (95)
- (96) Finoguenov, A., Ponman, T. J., Osmond, J. P. F., Zimer, M., 2007, MNRAS, 374, 737
- (97)
- (98) Finoguenov, A., Davis, D. S., Zimer, M., Mulchaey, J. S., 2006, ApJ, 646, 143
- (99)
- (100) Finoguenov, A., Jones, C., Böhringer, H., Ponman, T. J., 2002, ApJ, 578, 74
- (101)
- (102) Fomalont, E.B., Bridle, A.H., Willis, A.G., Perley, R.A., 1980, ApJ. 237, 418F
- (103)
- (104) Forbes, D. A., Ponman, T., Pearce, F., et al., 2006, PASA, 23, 38
- (105)
- (106) Forman, W., Nulsen, P., Heinz, S., et al., 2005, ApJ, 635, 894
- (107)
- (108) Gastaldello, F., Buote, D. A., Brighenti, F., Mathews, W. G., 2008, ApJ, 673, 17
- (109)
- (110) Gastaldello, F., Buote, D. A., Temi, P., et al., 2009, ApJ, 693, 43
- (111)
- (112) Giacintucci, S., Venturi, T., Murgia, M., et al., 2007, A&A, 476, 99
- (113)
- (114) Giacintucci, S., Vrtilek, J. M., Murgia, M., et al., 2008, ApJ , 682, 186
- (115)
- (116) Giodini, S., Smolčić, V., Finoguenov, A., et al., 2010, ApJ, 714, 218
- (117)
- (118) Gitti, M., McNamara, B. R., Nulsen, P. E. J., Wise, M. W., 2007, ApJ, 660, 1118
- (119)
- (120) Gitti, M., Sullivan, E. J., Giacintucci, S., et al., 2010, ApJ, 714, 758
- (121)
- (122) Helsdon, S. F., Ponman, T. J., & Mulchaey, J. S., 2005, ApJ, 618, 679
- (123)
- (124) Hickson, P., Kindl, E., & Auman, J., 1989, ApJS, 70, 687
- (125)
- (126) Jansen, F., Lumb, D., Altieri, B. et al., 2001, A&A, 365, L1
- (127)
- (128) Jeltema, T. E., Binder, B., & Mulchaey, J. S. 2008, ApJ, 679, 1162
- (129)
- (130) Jenkins, C. R., 1982, MNRAS, 200, 705
- (131)
- (132) Jetha, N. N., Hardcastle, M. J., Babul, A., et al., 2008, MNRAS, 384, 1344
- (133)
- (134) Jetha, N. N., Ponman, T. J., Hardcastle, M. J., Croston, J. H., 2007, MNRAS, 376, 193
- (135)
- (136) Johnson, R., Chakrabarty, D., O’Sullivan, E., & Raychaudhury, S. 2009, ApJ, 706, 980
- (137)
- (138) Johnson, R., Ponman, T. J., Finoguenov, A., 2009, MNRAS, 395, 1287
- (139)
- (140) Jones, C., Forman, W., Vikhlinin, A., et al., 2002, ApJ, 567, 115
- (141)
- (142) Koranyi, D.M. & Geller, M.J., 2002, AJ, 123, 100
- (143)
- (144) Kraft, R. P., Forman, W. R., Churazov, E., et al., 2004, ApJ, 601, 221
- (145)
- (146) Laing, R. A., & Bridle, A. H., 2002, MNRAS, 336, 1161
- (147)
- (148) Laing, R. A., Canvin, J. R., Cotton, W. D., Bridle, A. H., 2006, MNRAS, 368, 48L
- (149)
- (150) Laing, R. A., Bridle, A. H., Parma, P., et al., 2008, MNRAS, 386, 657
- (151)
- (152) Lanz, L., Jones, C., Forman, W. R., et al., 2010, ApJ, 721, 1702
- (153)
- (154) Lara, L., Marquez, I., Cotton, W. D., et al., 1999, A&A, 348, 699
- (155)
- (156) Ledlow, M. J., Owen, F. N., & Eilek, J. A., 2002, NewAR, 46, 343 (L02)
- (157)
- (158) McCarthy, I. G., Schaye, J., Ponman, et al., 2010, MNRAS, 406, 822
- (159)
- (160) Machacek, M. E., Jerius D., Kraft, R., et al., 2011, ApJ, to be submitted
- (161)
- (162) Mack, K.-H., Klein, U., O’Dea, C.P., Willis, A.G., 1997, A&AS, 123, 423
- (163)
- (164) Mack, K.-H., Klein, U., O’Dea, C.P., et al., 1998, A&A, 329, 431
- (165)
- (166) Mahdavi, A., Bohringer, H., Geller, M.J. & Ramellla, M., 2000, ApJ, 534, 114
- (167)
- (168) Mahdavi, A., Trentham N., & Tully, R. B., 2005, AJ, 130, 1502
- (169)
- (170) Marty, P. B., Kneib, J.-P., Sadat, R., et al., 2003, SPIE, 4851, 208
- (171)
- (172) Mazzotta, P., Brunetti, G., Giacintucci, S., et al., 2004, JKAS, 37, 381
- (173)
- (174) Mazzotta P., & Giacintucci S., 2008, ApJ, 675L, 9
- (175)
- (176) McNamara, B. R., Nulsen, P. E. J., Wise, M. W., et al., 2005, Nature, 433, 45
- (177)
- (178) McNamara B.R. & Nulsen P.E.J., 2007, ARA&A, 45, 117
- (179)
- (180) Miles T. A., Raychaudhury, S., Forbes, D. A., et al., 2004, MNRAS, 355, 785
- (181)
- (182) Miles, T. A., Raychaudhury, S., & Russell, P. A. 2006, MNRAS, 373, 1461
- (183)
- (184) Mittal, R., Hudson, D. S., Reiprich, T. H., Clarke, T., 2009, A&A, 501, 835
- (185)
- (186) Muanwong, O., Thomas, P. A., Kay, S. T., Pearce, F. R., 2002, MNRAS, 336, 527
- (187)
- (188) Mulchaey J. S., Davis D.S., Mushotzky R.F., & Burstein D., 2003, ApJS, 145, 39
- (189)
- (190) Mulchaey, J. S., & Zabludoff, A. I. 1998, ApJ, 496, 73
- (191)
- (192) Murgia M., Parma P., Mack, K.-H., et al., 2011, A&A, 526, 148
- (193)
- (194) Ohto, A., Kawano, N., & Fukazawa, Y., 2003, PASJ, 55, 819
- (195)
- (196) Osmond, J. P. F., & Ponman, T. J. 2004, MNRAS, 350, 1511
- (197)
- (198) O’Sullivan, E., Giacintucci S., David L., et al., 2011, MNRAS, to be submitted
- (199)
- (200) O’Sullivan, E., Giacintucci S., David L., et al., 2010a, MNRAS, 407, 321
- (201)
- (202) O’Sullivan, E., Giacintucci S., David L., et al., 2010b, MNRAS, 411, 1833
- (203)
- (204) O’Sullivan, E., Giacintucci, S., Vrtilek, J. M., et al., 2009, ApJ, 701, 1560
- (205)
- (206) O’Sullivan E., Vrtilek J.M., Harris D.E., Ponman T.J., 2007, ApJ, 658, 299O
- (207)
- (208) O’Sullivan, E., Vrtilek, J. M., & Kempner, J. C., 2005, ApJ, 624L, 77
- (209)
- (210) O’Sullivan, E., Ponman, T. J., & Collins, R. S. 2003, MNRAS, 340, 1375
- (211)
- (212) Owen, F. N., White, R., A., & Burns, J. O., 1992, ApJS, 80, 501
- (213)
- (214) Owen, F. N., White, R., A., & Ge, J., 1993, ApJS, 87, 135
- (215)
- (216) Parma, P., De Ruiter, H.R., Fanti, C., Fanti, R., 1986, A&AS, 64, 135
- (217)
- (218) Peterson, J. R., & Fabian, A. C., 2006, PhR, 427, 1
- (219)
- (220) Ponman, T. J., Sanderson, A. J. R., Finoguenov, A., 2003, MNRAS, 343, 331
- (221)
- (222) Ponman T.J., & Bertram D., 1993, Nature, 363, 51
- (223)
- (224) Popesso, P., Bohringer, H., Brinkmann, J., et al., 2004, A&A 423, 449
- (225)
- (226) Rafferty, D. A., McNamara, B. R., Nulsen, P. E., Wise, M. W., 2006, ApJ, 652, 216
- (227)
- (228) Randall, S. W., Jones, C., Kraft, R., et al., 2009, ApJ, 696, 1431
- (229)
- (230) Randall S., Forman W. R., Giacintucci S., et al., 2011, ApJ, 726, 86
- (231)
- (232) Roychowdhury, S, Ruszkowski, M., Nath, B. B., 2005, ApJ, 634, 90
- (233)
- (234) Roland, J., Hanish, R. J., Veron, P., & Fomalont, E., 1985, A&A, 148, 323
- (235)
- (236) Saikia, D. J., & Jamrozy, M., 2009, BASI, 37, 63
- (237)
- (238) Sarazin, C. L., Baum, S. A., & O’Dea, C. P., 1995, ApJ, 451, 125
- (239)
- (240) Schoenmakers, A. P., de Bruyn, A. G., Röttgering, H. J. A., et al., 2000, MNRAS, 315, 371
- (241)
- (242) Slee, O. B., Siegman, C. B., & Wilson, I. R. G., 1983, AuJPh, 36, 101
- (243)
- (244) Slee, O. B., & Reynolds, J. E., 1984, PASA, Vol. 5 (4), 516
- (245)
- (246) Slee, O. B., Roy, A. L., Murgia M., et al., 2001, AJ, 122, 1172
- (247)
- (248) Sparks, W. B., Disney, M. J., Wall, J. V., Rodgers, A. W., 1984, MNRAS, 207, 445
- (249)
- (250) Strom, R.G., Fanti, R., Parma, P., Ekers, R.D., 1983, A&A, 122, 305
- (251)
- (252) Subrahmanyan, R., Saripalli, L., & Hunstead, R. W., 1996, MNRAS, 279, 257
- (253)
- (254) Sun, M., 2009, ApJ, 704, 1586
- (255)
- (256) Trentham N., Tully R.B, & Mahdavi A., 2006, MNRAS, 369, 1375
- (257)
- (258) Trinchieri, G., Fabbiano, G., & Kim, D.-W., 1997, A&A, 318, 361
- (259)
- (260) Trinchieri, G., & Goudfrooij, P., 2002, A&A, 386, 472
- (261)
- (262) Venkatesan, T. C. A., Batuski, D. J., Hanisch, R. J., Burns, J. O., 1994, ApJ, 436, 67
- (263)
- (264) Venturi, T., Giovannini, G., Feretti, L., et al., 1993, ApJ, 408, 81
- (265)
- (266) Venturi, T., Dallacasa, D., Stefanachi, F., 2004, A&A, 422, 515
- (267)
- (268) Vrtilek J.M, Grego L., David L. P., et al., 2002, American Phys. Soc. Meeting, B17.107
- (269)
- (270) Weisskopf, M.C., Brinkman, B., Canizares, et al., 2002, PASP, 114, 1
- (271)
- (272) Willis, A. G., Strom, R. G., Bridle, A. H., Fomalont, E. B., 1981, A&A, 95, 250
- (273)
- (274) Worrall, D. M., Birkinshaw, M., Hardcastle, M. J., 2003, MNRAS, 343, 73
- (275)
- (276) Worrall, D. M., Birkinshaw, M., Laing, R. A., et al., 2007, MNRAS, 380, 2
- (277)
- (278) Xu, C., Baum, S.A., O’Dea, et al., 2000, AJ, 120, 2950
- (279)