Further Sunyaev–Zel’dovich observations of two Planck ERCSC clusters with the Arcminute Microkelvin Imager††thanks: We request that any reference to this paper cites “AMI Consortium: Hurley-Walker et al. 2011”
Abstract
We present follow-up observations of two galaxy clusters detected blindly via the Sunyaev-Zel’dovich (SZ) effect and released in the Planck Early Release Compact Source Catalogue. We use the Arcminute Microkelvin Imager, a dual-array 14–18 GHz radio interferometer. After radio source subtraction, we find a SZ decrement of integrated flux density mJy toward PLCKESZ G121.11+57.01, and improve the position measurement of the cluster, finding the centre to be RA 12h 59m 36.4s, Dec +60∘04′ 468, to an accuracy of 20″. The region of PLCKESZ G115.71+17.52 contains strong extended emission, so we are unable to confirm the presence of this cluster via the SZ effect.
keywords:
cosmology: observations – radiation mechanisms: non-thermal – cosmic microwave background – galaxies: clusters – Sunyaev-Zel’dovich – galaxies: clusters: individual (PLCKESZ G115.71+17.52, PLCKESZ G121.11+57.01)1 Introduction
The Planck satellite is an instrument designed to measure the full Cosmic Microwave Background (CMB) sky to the highest sensitivity yet achieved. Part of its remit is a blind survey of galaxy clusters via their Sunyaev-Zel’dovich effects (SZ; Sunyaev & Zeldovich 1970); this occurs when CMB photons are inverse-Compton scattered by hot gas in galaxy clusters. The resulting shift in the blackbody spectrum of the CMB produces a decrement at radio frequencies below the null of 217 GHz and a positive signal above this frequency (see e.g. Birkinshaw (1999) and Carlstrom et al. (2002) for reviews).
The Arcminute Microkelvin Imager (AMI) is a dual-array radio interferometer operating at 14–18 GHz; part of its scientific programme is making observations of hundreds of known galaxy clusters to measure their gas masses and structures. Along with its high sensitivity, its resolution of allows the measurement of the extent and shape of galaxy clusters above a redshift of (below which they become resolved out).
In 2011, the Planck Early Release Compact Source Catalogue (ERCSC; Planck Collaboration 2011b) was made publicly available; it includes a sample of 189 galaxy clusters detected via their SZ effects at signal-to-noise (S/N) (Planck Collaboration, 2011a). AMI was used to follow up the two previously unconfirmed clusters lying in the northern sky: PLCKESZ G115.71+17.52 (S/N) and PLCKESZ G121.11+57.01 (S/N), AMI observing details of which can be found in Tab. 1.
| Name | RA | Dec | SA observing | SA map noise / | LA observing | LA 19-pt map | LA 61-pt map |
|---|---|---|---|---|---|---|---|
| (J2000) | (J2000) | time / hrs | Jy beam-1 | time / hrs | noise/ Jy beam-1 | noise/ Jy beam-1 | |
| PLCKESZ G115.71+17.52 | 22 26 24.9 | +78 18 15.8 | 50 | 78 | 77 | 55 | 200 |
| PLCKESZ G121.11+57.01 | 12 59 23.8 | +60 05 24.8 | 40 | 81 | 67 | 65 | 250 |
2 AMI SZ observations
AMI comprises two aperture synthesis arrays located at the Mullard Radio Astronomy Observatory, Lord’s Bridge, Cambridge, UK. The AMI Small Array (SA) consists of ten 3.7-m diameter equatorially-mounted dishes with a baseline range of –20 m, while the AMI Large Array (LA) has eight 12.8-m-diameter dishes with a baseline range of –100 m. Both arrays observe I+Q in the band 14–18 GHz, each with system temperatures of about 25 K.
The backends are analogue Fourier transform spectrometers, from which the complex signals in each of eight channels of 750-MHz bandwidth are synthesised, and the signals in the synthesised channels are correlated at the per cent level. In practice, the two lowest-frequency channels are generally not used due to a poor correlator response in this frequency range and interference from geostationary satellites. Further telescope details are given in AMI Consortium: Zwart et al. (2008).
The AMI data reduction was performed using our in-house reduction software reduce. This is used to apply path-compensator and path-delay corrections, to flag interference, shadowing and hardware errors, to apply phase and amplitude calibrations, make a correction for the changing intervening air mass and to Fourier transform the correlator data to synthesise the frequency channels, before outputting to disk in -fits format suitable for imaging in the Astronomical Image Processing System (aips; Astronomical Image Processing Software 2007). Flux calibration was performed using short observations of 3C48 and 3C286 near the beginning and end of each run, with assumed I+Q flux densities for these sources in the AMI channels consistent with Baars et al. (1977) (see Tab. 2). As Baars et al. measure I and AMI measures I+Q, these flux densities include corrections for the polarization of the sources. The phase calibrators, J0017+8135, J1302+5748 and J2133+8239, were chosen from the Jodrell Bank VLA Survey (JVAS; Patnaik et al. 1992) on the basis of proximity () and flux density ( Jy at 15 GHz). After phase calibration, the phase of AMI over one hour is generally stable to for channels 4–7, and to for channels 3 and 8. The overall consistency of the flux-density scale is estimated to be better than five per cent.
| Channel | /GHz | /Jy | /Jy | FWHMLA/′ |
|---|---|---|---|---|
| 3 | 13.9 | 3.74 | 1.89 | 6.08 |
| 4 | 14.6 | 3.60 | 1.78 | 5.89 |
| 5 | 15.3 | 3.47 | 1.68 | 5.70 |
| 6 | 16.1 | 3.35 | 1.60 | 5.53 |
| 7 | 16.9 | 3.24 | 1.52 | 5.39 |
| 8 | 17.6 | 3.14 | 1.45 | 5.25 |
To analyse the SA cluster observations we use a Bayesian analysis package, McAdam (Marshall et al. 2003 and Feroz et al. 2009b). This uses MultiNest (Feroz & Hobson 2008 and Feroz et al. 2009a), an implementation of nested sampling (Skilling, 2004), to efficiently explore the multidimensional parameter space and to calculate the Bayesian evidence. This analysis has been applied to pointed observations of known clusters (e.g. AMI Consortium: Rodríguez-Gonzálvez et al. 2010; AMI Consortium: Zwart et al. 2010), and also to detect previously unknown clusters (AMI Consortium: Shimwell et al., 2010). We use it here to model the effect of radio point sources on the SA data, using the LA data as priors. To transform the SA data into a format suitable for McAdam, the -data for all good observations were concatenated together to make a -fits file for each channel. These were then transformed into lists of visibilities for the purpose of generating a covariance matrix for the data. The covariance matrix describes the terms which contribute to the data but are not part of the model, i.e. the CMB, thermal noise from the telescope and confusion noise from unresolved point sources. The latter were modelled using the Tenth Cambridge Radio Survey (10C: AMI Consortium: Franzen et al. 2010; AMI Consortium: Davies et al. 2010), integrating the confusion power from zero up to the LA source detection limit.
The data were also binned into cells of width , determined in Marshall (2003) as a suitable binning scale to reduce the size of the data to a manageable level without adversely affecting the resulting inference of model parameters. The binned data files were then analysed by McAdam using the method described in AMI Consortium: Zwart et al. (2010). Maps were made using imagr in aips from each channel of the SA and LA observations; however we here present only the combined-channel maps of the SA and LA observations. The task imean was used on the LA individual maps to attach the map noise to the map header, and flatn was then used to stitch the maps together, with a primary beam correction applied using parameters shown in Tab. 2.
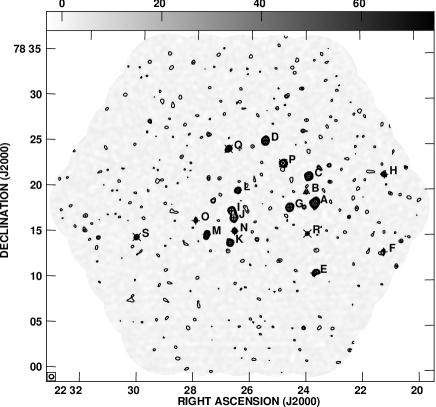
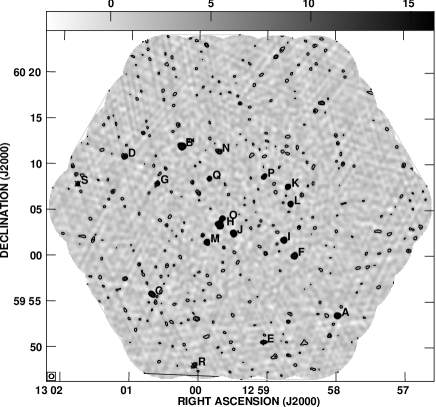
Source-finding was carried out on the LA data using software modified from that used in the 9C survey (Waldram et al., 2003). Spectral indices were fitted using LA maps of all six channels, assuming source fluxes follow a power-law relation of for the AMI frequencies. The properties of point sources detected at 4 and above by the LA are used as priors when modelling the SA data in McAdam. The position prior used in McAdam is a delta function since the resolution of the LA is around three times that of the SA; two exceptions are discussed in Section 3.1. LA flux densities generated the peak of Gaussian priors on the SA source flux densities, with s set to the calibration error of five per cent of the source flux density added in quadrature with the local map noise. Spectral index () priors were also set as Gaussians with equal to the error on the spectral index fit. These errors tend to be small () for bright sources and large () for faint sources. Fig. 1 shows the LA maps for the candidates with radio point sources marked; the positions and properties of the sources are given in Tables 3 and 4.
| ID | RA | Dec | /mJy | /mJy | ||
|---|---|---|---|---|---|---|
| A | 22 23 41.0 | +78 18 35.1 | ||||
| B | 22 23 59.3 | +78 19 49.4 | ||||
| C | 22 23 53.6 | +78 21 29.1 | ||||
| D | 22 25 29.4 | +78 25 25.3 | ||||
| E | 22 23 41.6 | +78 10 51.1 | ||||
| F | 22 21 12.6 | +78 13 08.6 | ||||
| G | 22 24 35.3 | +78 18 05.5 | ||||
| H | 22 21 09.2 | +78 21 40.8 | ||||
| I | 22 26 41.7 | +78 17 39.7 | ||||
| J | 22 26 36.9 | +78 16 53.3 | ||||
| K | 22 26 43.9 | +78 14 08.0 | ||||
| L | 22 26 28.4 | +78 19 55.8 | ||||
| M | 22 27 34.7 | +78 15 00.6 | ||||
| N | 22 26 34.7 | +78 15 24.9 | ||||
| O | 22 27 59.3 | +78 16 31.5 | ||||
| P | 22 24 50.3 | +78 22 57.7 | – | – | ||
| Q | 22 26 49.9 | +78 24 28.7 | – | – | ||
| R | 22 23 56.9 | +78 15 12.8 | – | – | ||
| S | 22 30 06.4 | +78 14 34.4 | – | – |
| ID | RA | Dec | /mJy | /mJy | ||
|---|---|---|---|---|---|---|
| A | 12 57 58.3 | +59 53 32.9 | ||||
| B | 13 00 15.4 | +60 12 01.3 | ||||
| C | 13 00 40.7 | +59 55 50.6 | ||||
| D | 13 01 05.9 | +60 10 49.4 | ||||
| E | 12 59 03.0 | +59 50 38.7 | ||||
| F | 12 58 36.2 | +60 00 04.8 | ||||
| G | 13 00 36.8 | +60 07 58.1 | ||||
| H | 12 59 41.6 | +60 03 25.2 | ||||
| I | 12 58 45.3 | +60 01 49.0 | ||||
| J | 12 59 29.6 | +60 02 31.8 | ||||
| K | 12 58 42.0 | +60 07 39.5 | ||||
| L | 12 58 39.6 | +60 05 45.0 | ||||
| M | 12 59 52.9 | +60 01 33.2 | ||||
| N | 12 59 42.9 | +60 11 29.1 | ||||
| O | 12 59 39.6 | +60 04 08.9 | ||||
| P | 12 59 03.1 | +60 08 43.8 | ||||
| Q | 12 59 51.2 | +60 08 30.3 | ||||
| R | 13 00 03.2 | +59 48 03.9 | – | – | ||
| S | 13 01 46.8 | +60 07 49.5 | – | – |
3 Results and Discussion
After the source models were fitted to the SA data in McAdam, the sources were subtracted from the data using the modelled source fluxes and spectral indices. The data were then mapped again in aips to generate source-subtracted maps. The parameters used for source-subtraction are the last two columns of Tables 3 and 4.
3.1 PLCKESZ G115.71+17.52
The raw map for this candidate, Fig. 2a, shows a very complicated region with both positive and negative features. The sources appear to consist of two main complexes: one to the south-east of the pointing centre, consisting of sources L, I, J, N, K, M and O. To the west and north is a separate complex, consisting of sources D, P, C, B, G and the extended source A. Given the extent of this source, and the uncertainty on whether source B was also extended, these were modelled with Gaussian position priors with ″. This is useful when dealing with extended emission as the location and magnitude of the peak of such emission may differ significantly when measured on different scales; it has previously been used to account for small amounts of extended emission in AMI Consortium: Shimwell et al. (2011) and AMI Consortium: Rodríguez-Gonzálvez et al. (2011).
After source-subtraction (see Fig. 2b), extended positive residuals are visible directly to the north of the pointing centre, and to the south of source A. These areas of emission have no obvious counterparts on the LA map (Fig. 1a) and have SA peak flux densities mJy. However the complexes have integrated flux densities of mJy each. This seems to indicate that the emission is real, extended, and positive.
A difficulty arises when using an interferometer to measure structure of unknown extent, as it is unclear how much will be resolved out due to the lack of -coverage on large scales. This partially negates the natural filtering advantage of using an interferometer for SZ detection, discussed in Birkinshaw (1999). When deconvolving the dirty map with the synthesised beam in the clean process (Clark, 1980), incomplete interferometric measurement of extended structure can lead to artifacts, including negative signal. It is unclear whether the negative signal 7′ south-west of the pointing centre, in the source-subtracted map, is purely artifactual from poor cleaning of the extended positive emission, or also includes a component from SZ emission. Publicly available ROSAT data (Voges et al., 1999) show elongated X-ray emission of ′extent at the Planck ESZ position. If this object is a galaxy cluster then the SZ and X-ray emission are likely not to be strongly offset, so the south-west negative feature (and other negative features on the map) are probably artifactual.
As to the source of the positive extended emission seen in this region, we note that Galactic observations with the SA (see e.g. AMI Consortium: Hurley-Walker et al. 2009) tend to pick up more extended emission closer to the Galactic plane. This is likely to be synchrotron associated with regions which also have bright thermal dust emission. The latter was also noted by Planck Collaboration (2011a) as a problem when measuring the SZ effect toward this object. There is also the possibility that the two source complexes are extended radio doubles from jet-producing galaxies, which would be more likely to appear in a galaxy cluster than in the field.


3.2 PLCKESZ G121.11+57.01
It is clear even before source subtraction that there is isolated excess negative signal in the centre of the SA map, Fig. 3a. After source-subtraction the initially elliptical appearance is revealed as a close to circularly-symmetric SZ decrement, Fig. 3b. The 6 positive residual between sources P and N corresponds well to an overdensity of 3 features nearby in the LA map, and is likely to be extended emission resolved-out by the LA. The feature is more than one synthesised beam away from the cluster and appears alone, so should not affect measurement of the cluster decrement.
From the source-subtracted map, we measure the integrated flux density of the central negative signal as mJy. We estimate the S/N of our measurement as 13, by dividing the absolute value of the integrated flux density by the map noise of mJy. Thus we confirm the Planck blind SZ detection of PLCKESZ G121.11+57.01 as a galaxy cluster. We hope to investigate the full comparison of AMI and Planck data via common cluster models in future publications.
We also measure a position offset from the ERCSC position, finding ″ and ″, resulting in an improved cluster position of RA 12h 59m 36.4s, Dec +60∘04′ 468. Wen et al. (2009) identify a cluster of redshift 0.33 at RA 12h 59m 33.4s, Dec +60∘ 04′ 09″ in the Sloan Digital Sky Survey DR6 Galaxy Clusters Catalog. Given that the separation between these two measurements is merely 44″, and the redshift is typical of clusters detected by Planck (Planck Collaboration, 2011a), it is likely that the two are the same object. Publicly-available ROSAT data (Voges et al., 1999) show only a few X-ray photons, consistent with noise, so the cluster appears to have a low X-ray luminosity.


4 Conclusions
We confirm the Planck blind SZ detection of PLCKESZ G121.11+57.01 as a galaxy cluster at , with a 15 GHz integrated flux density of mJy. Our observations improve the measurement of the cluster position to RA 12h 59m 36.4s, Dec +60∘ 04′ 468. We cannot positively identify PLCKESZ G115.71+17.52 as a galaxy cluster via SZ, as the data are consistent with both the presence of an SZ decrement and extended positive emission, or simply the latter. However we note that radio source environment may indicate the presence of jets from active galaxies, often found in galaxy clusters.
5 ACKNOWLEDGMENTS
We thank the staff of the Mullard Radio Astronomy Observatory for their invaluable assistance in the commissioning and operation of AMI, which is supported by Cambridge University and the STFC. Computational results were obtained using the COSMOS supercomputer (DiRAC STFC HPC Facility). This work was based on observations obtained with Planck, an ESA science mission with instruments and contributions directly funded by ESA Member States, NASA, and Canada. This research made use of the ROSAT Data Archive of the Max-Planck-Institut für extraterrestrische Physik (MPE) at Garching, Germany. MLD, TMOF, CRG, MO, MPS and TWS acknowledge the support of PPARC/STFC studentships.
References
- AMI Consortium: Davies et al. (2010) AMI Consortium: Davies M. L., et al., 2010, ArXiv e-prints
- AMI Consortium: Franzen et al. (2010) AMI Consortium: Franzen T. M. O., et al., 2010, ArXiv e-prints
- AMI Consortium: Hurley-Walker et al. (2009) AMI Consortium: Hurley-Walker N., et al., 2009, MNRAS, 396, 365
- AMI Consortium: Rodríguez-Gonzálvez et al. (2010) AMI Consortium: Rodríguez-Gonzálvez C., et al., 2010, ArXiv e-prints
- AMI Consortium: Rodríguez-Gonzálvez et al. (2011) —, 2011, ArXiv e-prints
- AMI Consortium: Shimwell et al. (2010) AMI Consortium: Shimwell T. W., et al., 2010, ArXiv e-prints
- AMI Consortium: Shimwell et al. (2011) —, 2011, ArXiv e-prints
- AMI Consortium: Zwart et al. (2008) AMI Consortium: Zwart J. T. L., et al., 2008, MNRAS, 391, 1545
- AMI Consortium: Zwart et al. (2010) —, 2010, ArXiv e-prints
- Astronomical Image Processing Software (2007) Astronomical Image Processing Software, 2007, www.aips.nrao.edu
- Baars et al. (1977) Baars J. W. M., Genzel R., Pauliny-Toth I. I. K., Witzel A., 1977, A&A, 61, 99
- Birkinshaw (1999) Birkinshaw M., 1999, Phys.Rep., 310, 97
- Carlstrom et al. (2002) Carlstrom J. E., Holder G. P., Reese E. D., 2002, ARA&A, 40, 643
- Clark (1980) Clark B. G., 1980, A&A, 89, 377
- Feroz & Hobson (2008) Feroz F., Hobson M. P., 2008, MNRAS, 384, 449
- Feroz et al. (2009a) Feroz F., Hobson M. P., Bridges M., 2009a, MNRAS, 398, 1601
- Feroz et al. (2009b) Feroz F., Hobson M. P., Zwart J. T. L., Saunders R. D. E., Grainge K. J. B., 2009b, MNRAS, 398, 2049
- Marshall (2003) Marshall P. J., 2003, PhD thesis, University of Cambridge
- Marshall et al. (2003) Marshall P. J., Hobson M. P., Slosar A., 2003, MNRAS, 346, 489
- Patnaik et al. (1992) Patnaik A. R., Browne I. W. A., Wilkinson P. N., Wrobel J. M., 1992, MNRAS, 254, 655
- Planck Collaboration (2011a) Planck Collaboration, 2011a, ArXiv e-prints, 1101.2024
- Planck Collaboration (2011b) —, 2011b, ArXiv e-prints, 1101.2041
- Skilling (2004) Skilling J., 2004, in American Institute of Physics Conference Series, Fischer R., Preuss R., Toussaint U. V., eds., pp. 395–405
- Sunyaev & Zeldovich (1970) Sunyaev R. A., Zeldovich Y. B., 1970, Comments on Astrophysics and Space Physics, 2, 66
- Voges et al. (1999) Voges W., et al., 1999, A&A, 349, 389
- Waldram et al. (2003) Waldram E. M., Pooley G. G., Grainge K. J. B., Jones M. E., Saunders R. D. E., Scott P. F., Taylor A. C., 2003, MNRAS, 342, 915
- Wen et al. (2009) Wen Z. L., Han J. L., Liu F. S., 2009, ApJS, 183, 197