Temporal response to harmonic driving in electroconvection
Abstract
The temporal evolution of the spatially periodic electroconvection (EC) patterns has been studied within the period of the driving ac voltage by monitoring the light intensity diffracted from the pattern. Measurements have been carried out on a variety of nematic systems, including those with negative dielectric and positive conductivity anisotropy, exhibiting ”standard EC” (s-EC), those with both anisotropies negative exhibiting ”non-standard EC” (ns-EC), as well as those with the two anisotropies positive. Theoretical predictions have been confirmed for stationary s-EC and ns-EC patterns. Transitions with Hopf bifurcation have also been studied. While traveling had no effect on the temporal evolution of dielectric s-EC, traveling conductive s-EC and ns-EC patterns exhibited a substantially altered temporal behavior with a dependence on the Hopf frequency. It has also been shown that in nematics with both anisotropies positive, the pattern develops and decays within an interval much shorter than the period, even at relatively large driving frequencies.
pacs:
61.30.Gd, 64.70.mj, 89.75.Kd, 42.25.FxI Introduction
Electroconvection (EC) in a thin layer of a nematic liquid crystal (NLC) is a paradigm of pattern forming instabilities kramer ; Pesch , and as such, it has been widely studied both experimentally and theoretically.
These studies have concluded that the sign (and magnitude) of the anisotropies of the dielectric permittivity, , and of the electrical conductivity, , and the initial director alignment are the key parameters that determine whether, and what kind of EC patterns can exist Kluw . Subscripts || and ⟂ indicate here the values measured parallel with and perpendicular to the initial director orientation n, respectively. Due to the crucial role of the anisotropies it is convenient to classify NLCs into , , , and compounds, with the first sign corresponding to and the second one to .
Electroconvection typically appears at a threshold rms value of the driving ac voltage of frequency as a spatially periodic pattern (a set of rolls) characterized by a wave vector . In most cases the pattern involves a distortion of the director field accompanied with charge separation and vortex flow, forming a feedback loop known as the Carr-Helfrich mechanism kramer ; Kluw . Its theoretical formulation, the so called standard model (SM) of EC Bod ; kramer provides a quantitative description of basic pattern characteristics – such as and – for various combinations of the key parameters where EC can occur either as a direct transition (planar kramer or homeotropic buka ) or as a secondary instability (e.g., homeotropic Kai96 ; Buka00 ). Therefore these patterns will be referred to as standard EC (s-EC) patterns further on. It has to be mentioned, however, that according to the rigorous analysis by SM, the boundaries of existence of s-EC modes in the (, ) space do not coincide exactly with the sign inversion of the anisotropies Kluw .
Though the SM predicts a bifurcation to stationary EC patterns, occasionally (for some range of material and control parameters , and sample thickness ) traveling rolls (TRs) have also been observed experimentally at threshold in various NLCs Kai78 ; Joets88 ; Rehberg89 ; Dennin95 indicating a Hopf-bifurcation. In order to explain these features, a theoretical extension of the SM (the weak electrolyte model – WEM) has been developed by taking into account diffusion, recombination and dissociation of ionic charge carriers Treiber95 . The and dependencies calculated from the WEM do, however, practically coincide with those provided by the SM.
According to SM, the existence of s-EC patterns is excluded for nematics Kluw ; de Gennes . However, convection in ac electric field associated with roll formation has long ago been observed, e.g., in homologous series of N-(p-n-alkoxybenzylidene)-n-alkylanilines, or in di-n-4-4’-alkyloxyazoxybenzenes leger ; blinov , and recently in 4-n-alkyloxy-phenyl-4-n’-alkyloxy-benzoates Ela ; Toth07 . The characteristics of these patterns, like orientation of the rolls, contrast, frequency dependence of and , and the director distribution in space and time, are different from those of the s-EC. Since this roll formation process falls outside of the frame of the SM it has been called non-standard electroconvection (ns-EC) Ela .
After several attempts of explanation leger ; blinov ; blinov77 ; madu , the scenario has recently been understood, and experimental results have been quantitatively reproduced by the extended SM which incorporates flexoelectricity Krekhov08 . Though in this scenario the standard Ohmic charge separation of the Carr-Helfrich mechanism leads to a negative feedback due to , this effect can be compensated and the homogeneous state is destabilized by the flexoelectric charges.
There is a number of experimental evidences blinov77 ; Blinov ; Trufanov ; Rout ; Rjumtsev93 ; Nakagawa ; Kumar2010 that EC may occur in nematics too, which also infringes the predictions of the (extended) SM. The isotropic (Felici-Benard) mechanism felici ; Blinov has been proposed to explain the observed instabilities blinov77 ; Trufanov , however, a rigorous theoretical formulation of this mechanism, which is capable to provide the main pattern characteristics, is unfortunately not yet available.
In the present paper we intend to focus on the time evolution of the EC patterns, hence one has to take into account the characteristic time scales involved in EC. According to SM the Carr-Helfrich mechanism has three relevant time scales: the director relaxation time , the charge relaxation time and the viscous relaxation time . Here is the splay elastic modulus, is the density, is the rotational, and is the isotropic viscosity, is the sample thickness. Typically, with s) kramer . affects the so-called cut-off frequency which separates two basic regimes of s-EC patterns having opposite time symmetries. Below – in the conductive regime – the charge distribution oscillates with the applied ac voltage, while above – in the dielectric regime – the director and the flow follows the electric field. , together with and the voltage deviation from , determines how fast the pattern develops (decays) after switching on (off) the driving voltage. It has been shown recently that the decay rates grow strongly with increasing Eber04 ; Pesch06 . In case of traveling waves further time scales enter the game related to the ionic processes as described by the WEM; that makes the appearance of Hopf bifurcation and the calculation of the Hopf frequency possible Treiber95 .
The period of the driving voltage corresponds to an additional characteristic time. In most cases holds – as it is in our experiments reported later in the paper too. We note here that if becomes comparable or larger than (low frequency driving), the time evolution of the pattern may suffer a significant change; the pattern might exist only as bursts in a part of the period as proven recently for dielectric s-EC May08 .
In regard of the experimental methods, most of the EC measurements involve primarily optical microscopy. Since the driving frequencies in EC studies are mostly comparable with, or larger than the standard video rates, microscopy usually cannot provide information on the temporal evolution of the director within one period of the applied AC voltage unless stroboscopic techniques Schneider92 ; Messlinger07 , or high-speed cameras are used.
Light diffraction may serve as an alternative technique. A comprehensive theoretical analysis of diffraction gratings formed by EC has been developed Kosmo87 ; Zengino88 ; Zengino89 ; Pesch06 . Diffraction experiments were mainly devoted to the laser diffraction efficiency of EC Caroll72 , studying the cascade of EC patterns above Lu71 ; Xu07 , measuring the frequency of the oscillatory motion of Williams domains above Akahoshi76 ; Miike84 , investigating stochastically excited EC John02 ; John03 ; John04 , and determining the growth and decay rates of EC patterns Papa99 ; John03 ; Eber04 ; Pesch06 .
Light diffraction is especially an adequate technique for studying the temporal evolution as the intensity of the first order diffraction fringes is directly related – near the onset – to the square of the director distortion angle (). Interestingly, however, we are not aware of any systematic investigation of the light intensity diffracted from EC patterns at within the period of the driving voltage, except of the early work Orsay71 where a single screenshot of synchronous oscilloscopic recording of the excitation voltage and of the light intensity scattered from dielectric s-EC pattern is presented.
In this paper we intend to fill this gap. After introducing the experimental set-up and the NLCs used for the measurements in Sec. II, in Sec. III we present our experimental results on the temporal variations of the light intensity diffracted from various EC patterns at (or close to) the onset of the instability. On the one hand, our motivation was to confirm/test the theoretical predictions of the SM. Hence in Sec. III.1 we present the temporal evolution of the diffracted light intensity for stationary conductive and dielectric s-EC in compounds. On the other hand, for several other pattern morphologies unfortunately no such predictions exist, so experimental determination of the behaviour is of high importance. For example, in the case of traveling s-EC patterns, which are discussed in Sec. III.2, the WEM should presumably provide the temporal evolution of the director distribution. Measurements have also been carried out in NLCs exhibiting ns-EC. In Sec. III.3 time dependence of ns-EC patterns of a nematic is addressed. For this case the extended SM foresees a time symmetry similar to that of the dielectric s-EC Krekhov08 . Measurements presented in Sec. III.4 for EC in NLCs may serve as important ingredients for a future construction of a theoretical description. Finally, in Sec. IV we summarize the conclusions obtainable from our measurements and from the comparison with existing theories.
II Substances and experimental set-up
Substances for the present studies have been carefully selected to cover all combinations of and , but the case which is not considered here. For investigating both conductive and dielectric s-EC in materials, we have used nematic mixtures Phase 4, Phase 5 and Phase 5A (from Merck Co.). In these systems both stationary and traveling s-EC patterns could be realized at a fixed temperature of C. For studying ns-EC in nematics, two members of the homologous series of 4-n-alkyloxy-phenyl-4-n’alkyloxy-benzoates Kresse80 (labelled as n/m, where and are the alkyl-chain lengths of the tails of the molecules) have been used. We have reported recently Ela ; Toth07 that, while their dielectric anisotropy is always negative, the two selected members of the series – namely 8/7 and 10/6 – exhibit sign inversion of at some temperature in the nematic phase, and therefore, one can conveniently study both s-EC [at temperatures where the compounds are of type] and ns-EC [at temperatures where they are of type]. It is convenient to introduce here a reduced temperature as , with and denoting the nematic–isotropic and the nematic–smectic phase transition temperatures, respectively. This reduced temperature will be used throughout the paper for compounds 8/7 and 10/6. Finally, as a nematic, commercially available 4-cyano-(4’-pentyl)biphenyl (5CB) has been studied at C.
NLCs have been enclosed between two parallel glass plates coated with etched transparent indium tin oxide (ITO) electrodes and with rubbed polyimide to assure planar initial alignment. Cells of different thickness in the range of m m have been used. The direction of the director at the surfaces is chosen as the -axis. A sinusoidal electric voltage of frequency and amplitude provided by a function generator was applied across the sample (along the -axis) via a high voltage amplifier.
For electroconvection measurements the cells have been placed into an oven with thermal stability within C. EC patterns have been studied with two different techniques: polarizing microscopy and laser diffraction. Microscopic observations, either by the shadowgraph (single polarizer) technique or with two crossed (or nearly crossed) polarizers, have been used here to verify the type of the EC pattern only. In the diffraction set-up a central area of about 1mmmm of the cell has been illuminated with a beam of a laser-diode of wavelength nm. Due to the periodicity of the EC patterns a sequence of diffraction fringes (far field image) appear on a screen placed normal to the initial beam at a distance of m from the sample. An optical fiber (with a diameter of 1 mm) has been positioned onto the center of a first order diffraction spot. The fiber transmitted the diffracted light into a photo-multiplier working in its linear regime. The output of the photo-multiplier has been fed through a current-to-voltage converter into a digital oscilloscope. That has allowed computer recording of the fringe intensity at 8 bit resolution with adjustable sampling rate.
We have monitored in order to check whether there are modulations of the intensity with the driving frequency or its upper harmonics. In general, at (or slightly above) the onset the signal mainly corresponds to a dc level with a superposed second harmonic component. Therefore, throughout the paper we characterize the intensity modulation by the ratio , where is the amplitude of the component while is the average intensity with respect to a background dark level measured at the fringe location for .
III Results
III.1 Light diffraction on stationary s-EC patterns
We start from the case of stationary conductive and dielectric s-EC where the theoretical expectations given by the SM are firmly established. The SM provides the temporal variation of the director field at onset in a (harmonic) Galerkin expansion. One of the basic differences between the two types of s-EC patterns – the conductive and the dielectric rolls – lies in their time symmetry. According to the SM, the time dependence of the director is composed of the odd terms of the expansion () for the dielectric and of the even terms () for the conductive rolls (). Focusing on the leading terms only, it means that in the dielectric regime the director oscillates with the frequency of the driving ac voltage (and thus passes the state twice in each period), contrary to the case of the conductive regime, where is stationary. Numerical calculations show that higher harmonics in the Galerkin expansion have typically a very small weight; even the term next to the leading one is less than a few percent (). As the intensity of the first order diffracted fringe is , one expects (in terms of definitions given in Sec. II , i.e. ) for the dielectric pattern, while for the conductive one (i.e. , , and ) is anticipated.
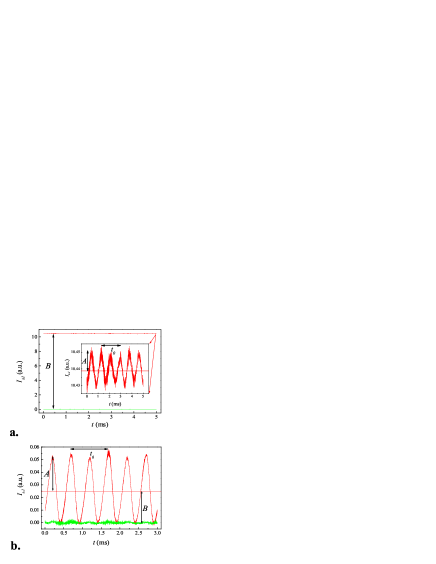
In order to verify the above predictions diffraction measurements have been carried out on the nematic liquid crystals Phase 5 and Phase 5A which are often used for studying s-EC. In Phase 5A only stationary conductive s-EC rolls have been detected which are characterized by an almost constant fringe intensity (in general, ) as shown in Fig. 1a. In Phase 5, above the cut-off frequency stationary dielectric rolls are present with the fringe intensity falling down to zero twice in each period of the applied voltage as demonstrated in Fig. 1b (i.e. ). Therefore, experimental results on the stationary s-EC patterns of Phase 5 or 5A agree fully with the predictions of the SM.
III.2 Light diffraction on traveling s-EC patterns
While stationary s-EC patterns can fully be described by SM, traveling of the patterns cannot be explained within its framework. It could be accounted for by an extension of the SM, considering the ionic processes of electrical conductivity (the weak electrolyte model). The WEM inherits the basic Carr-Helfrich mechanism of the EC pattern formation from the SM and it has been shown that the frequency dependences of and provided by the two models practically coincide Treiber95 . Though the WEM has been analyzed for the Hopf frequency (i.e. traveling), it has not been done – to our knowledge – for the spatio-temporal distribution of the director. On the one hand, the identity of the basic instability mechanisms and threshold features might suggest that for traveling s-EC rolls should be similar to that of stationary s-EC (which was discussed in Sec. III.1). On the other hand, the governing equations of the WEM are more complex than those of the SM, and this might show up in the temporal behaviour of their solutions.
In Phase 5, below , stationary as well as traveling conductive s-EC rolls could be seen which gave an opportunity for an experimental testing of the case. The frequency range in which the traveling conductive s-EC rolls occur, the Hopf frequency, as well as the spatial homogeneity of the pattern increases as the thickness of the sample is decreased. Fig. 2a shows an example of diffraction measurements on a thin, m sample of Phase 5, where spatially homogeneous traveling (with high speed) conductive s-EC rolls have been observed. As one sees, the intensity modulations here are considerably larger () than in the case of stationary conductive s-EC (Fig. 1a).
We note here, that for the traveling conductive s-EC the diffraction fringes became more diffuse, indicating less spatial regularity of the pattern compared to the stationary one. This is, however, not expected to affect the ratio.
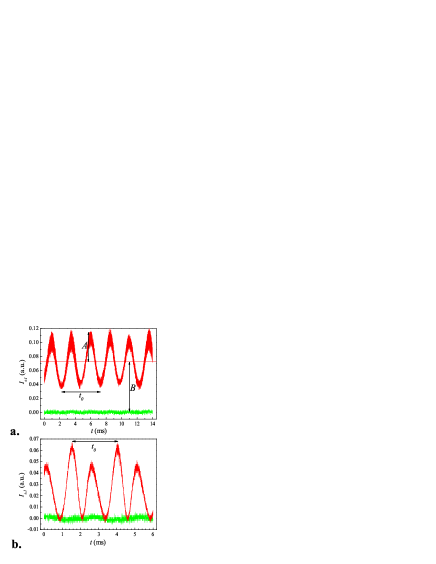
While traveling conductive s-EC rolls are commonly observed, traveling dielectric s-EC rolls have not been reported until recently Toth08 . If one follows the predictions of the WEM and the experimental findings regarding the conditions under which traveling conductive s-EC rolls are observed, one expects that for the occurrence of traveling dielectric s-EC patterns a compound with low electrical conductivity is needed in a very thin sample. Therefore, we have prepared a m thick sample of Phase 4, in which traveling dielectric s-EC rolls could indeed be detected. For this pattern exhibited a modulation of the intensity as illustrated in Fig. 2b. The intensity decreases to the background level in each half period, i.e. the curve yields , similarly to that measured for stationary dielectric s-EC (Fig. 1b).
The measurements above have proven that the Hopf-bifurcation has no effect on the ratio in the dielectric regime of s-EC; however, in the case of traveling conductive s-EC rolls the intensity modulation (as shown in Fig. 2a) becomes much larger than what would be predicted by the SM and has been measured for stationary conductive s-EC (Fig. 1a).
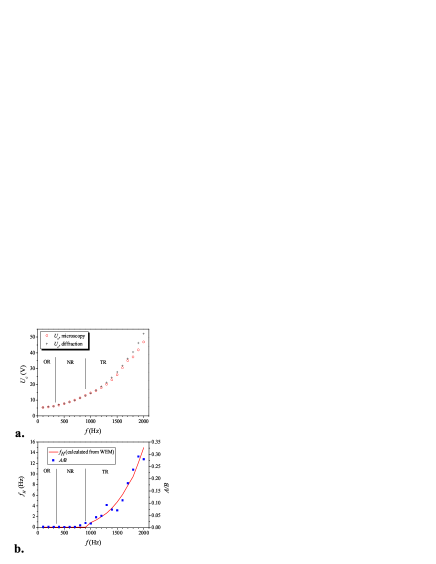
This astonishing behaviour justifies a more detailed study of the problem in an NLC where both stationary and traveling conductive s-EC rolls can be detected in a conveniently broad frequency range. For this purpose a mixture of Phase 5 and Phase 5A has been prepared in a mass ratio of 7:1. In Fig. 3a the curves are plotted for a m thick sample (determined independently both with polarizing microscopy and by diffraction measurements). It is seen, that the composition of the mixture assured broad frequency ranges for stationary oblique (OR) and normal (NR) rolls as well as for traveling (TR) roll patterns. The frequency dependence of the ratio of is shown in Fig. 3b as symbols. Obviously, remains very small in the whole frequency range of stationary patterns (independent of whether OR or NR), however, it starts to grow with considerably when entering the range of traveling roll scenarios (with the Hopf frequency also increasing with ). Using the WEM one can calculate the frequency dependence of Treiber95 . Results of these calculations are also presented in Fig. 3b by the solid line. We want to emphasize that this is not a fit; besides the known material parameters and the sample thickness, only the measured threshold voltages and the frequency at which the rolls start to travel (Hz) are required for the calculations Treiber95 . Fig. 3b clearly demonstrates that the ratio scales with .
Finally, we mention that in the high temperature range () of the nematic phase compound 8/7 possesses the parameter combination and consequently, s-EC occurs Toth07 . In this high temperature range, traveling conductive s-EC rolls have been detected below , while stationary dielectric s-EC rolls above it by polarizing microscopy. Our light diffraction experiments yielded for the patterns below , while above we obtained ; i.e., the intensity modulations found in the s-EC of 8/7 are in full agreement with those obtained for other nematics having traveling conductive s-EC (see, e.g., Figs. 2a and 3b) and stationary dielectric s-EC (Fig. 1b).
III.3 Light diffraction on ns-EC patterns
The Carr-Helfrich mechanism, on which the SM is based, is not capable to explain the ns-EC patterns occurring in NLCs. It has been shown, however, recently that a proper theoretical description can be provided by incorporating flexoelectricity as the source of destabilization into the SM Krekhov08 . This extended SM concludes that flexoelectricity establishes a coupling between the conductive and dielectric modes, and that the director should oscillate with the frequency of the driving voltage similarly to the case of dielectric s-EC, however, is different and the spatial director distribution is more complex. The director has a spatially alternating tilt and azimuthal modulation which oscillate in phase Krekhovunpub ; therefore at one instant in each half period there is no deformation. As a consequence, one would expect that for this pattern morphology the diffracted intensity should fall down to the background level twice in each period, just as in Figs. 1b or 2b.
Previous observations with polarizing microscopy on the compound 10/6 Ela have shown that in a broad temperature range of the nematic phase stationary ns-EC appears at the onset of the instability. Traveling ns-EC pattern has not been observed on this compound. Fig. 4a shows the temporal dependence of the intensity of the first order diffraction fringe just above the onset of the stationary ns-EC instability measured in a m thick sample of 10/6 at and Hz. Clearly fulfils, thus confirming in this respect the ”dielectric time symmetry” of the stationary ns-EC pattern.
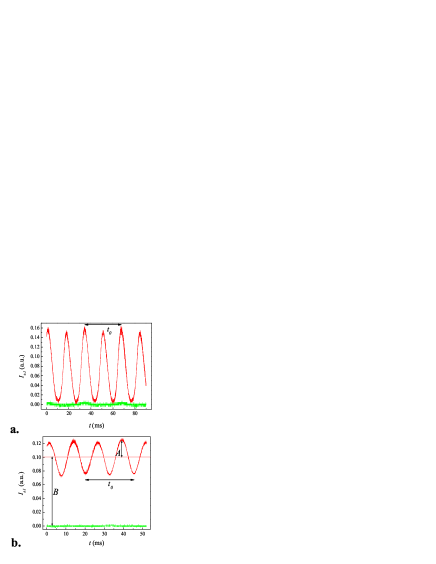
Nonstandard EC rolls may also be traveling, as it was observed in the low temperature range () of the nematic phase of 8/7 where the substance is of type Toth07 . Fig. 4b represents a diffraction measurement in this low temperature range taken at and Hz using a m thick sample. It follows from the figure that . It was found in general, that by varying , and/or the ratio falls into the range of for traveling ns-EC (i.e., into the same range as measured for the traveling conductive s-EC discussed in Sec. III.2). This indicates that for traveling ns-EC patterns the ”dielectric time symmetry” seems to fail.
III.4 Light diffraction on the ”roll pattern” of a nematic
Very recently two EC pattern morphologies – a ”cellular” and a subsequent ”roll” pattern – have been detected in the same frequency range in a nematic, namely in 5CB Kumar2010 . As the mechanisms of formation of these patterns still wait for exploration, no theoretical guesses can be made for their spatio-temporal director distribution.
Unfortunately, light diffraction experiments on the cellular pattern did not provide any information about the temporal evolution of the light intensity . The most probable reasons for this are the low contrast and the relatively large wavelength of the pattern (see Figs. 2b and 4b of Ref. Kumar2010 ), which makes the first order diffraction fringe positioned too close to the central beam where the intensity of the scattered light (the background) is too high. Therefore, using a high-speed camera could be a more powerful tool for studying the temporal evolution of the cellular pattern. These studies are currently in progress.
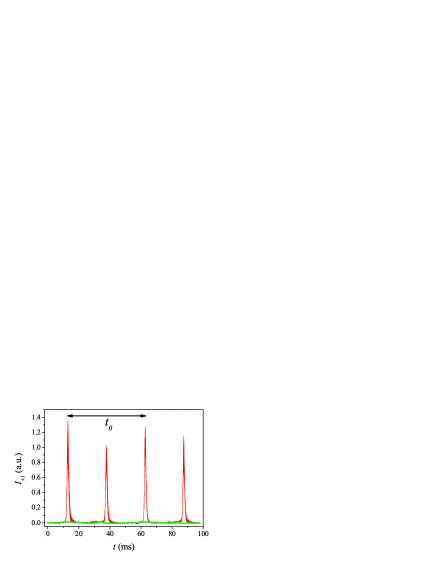
For the roll pattern (the secondary instability which has a much lower wavelength than the cellular one) near its onset (V in a m thick planar cell at Hz and C) has been reported as a sequence of bursts appearing twice within one period of the driving voltage Kumar2010 . Interestingly, the roll pattern remains stable over a wide range of the driving voltage. In Fig. 5 the temporal evolution is depicted much below (at V) and much above (at V). As one sees, even highly above the threshold (in terms of the dimensionless control parameter ), the temporal evolution of the pattern remains the same as that at the onset (cf. Fig. 5 in Ref. Kumar2010 ): two ”short-time” bursts within one period of the driving voltage, and no pattern in most of the time.
IV Discussion and summary
Our experimental results presented above clearly show that monitoring the oscillations of the light intensity diffracted from various EC patterns is a convenient tool for the analysis of temporal behaviour and is a selective method for distinguishing certain pattern morphologies. We have managed to prove that for those patterns where the proper theoretical description is well developed (stationary s-EC and ns-EC), the experimental results are in full agreement with the theoretical predictions. It has, however, turned out that the temporal behavior of traveling patterns is mostly significantly different from those of stationary ones and there is a correlation between the magnitude of the modulation and the Hopf frequency characterizing the traveling.
In view of the fact that the frequency of the illuminating light (Hz) is several orders of magnitude larger than the Hopf frequency (Hz) or even the driving frequency (Hz), there is no reason to assume that diffraction optics could be responsible for the altered time dependence of the traveling rolls. Rather one can state that the diffraction fringe pattern appearing on the screen corresponds to a snapshot in the Fourier-space of the momentary director distribution.
Therefore we conclude that the spatio-temporal director distribution in traveling roll patterns should be significantly different compared to that of the corresponding stationary patterns. The resulting difference in the intensity modulation may occur via at least two ways. First, trivially, an increase of the weight of the higher () harmonic in should induce a larger modulation (larger ). Second, it has been shown recently Pesch06 that the diffraction efficiency of a pattern depends also on the -profile of the director. Thus if changes significantly moving from stationary to traveling rolls, it could also be responsible for a change of , even if the harmonic weights remain the same. A thorough theoretical/numerical analysis of the problem by the WEM would presumably clarify the situation, and give some clue to the correlation between and the Hopf-frequency which exists according to Fig. 3.
In case of traveling dielectric rolls no significant change has been detected compared to the case of stationary dielectric rolls. The intensity diminishes to zero twice in each period, confirming that the director crosses the position. A possible change in the weights of higher harmonics would not change this behaviour; that could show up only in higher harmonic modulation of the diffracted intensity which has not been investigated here.
We note that while only modulations have been expected in , actually a non-negligible basic harmonic modulation could also be detected, as it is noticeable in Figs. 1b and 2b. The modulation actually means a polarity sensitivity of the response. We propose that this feature might be related to flexoelectricity. While according to the SM (flexoelectricity is neglected) the different time symmetries of the conductive and the dielectric regimes are clearly reflected by the parity of the time harmonics, it has been shown recently Krekhov08 that in the extended SM (flexoelectricity included) there is a coupling between modes; therefore the harmonic expansion may have even and odd harmonics as well. If the director has both a constant and a basic harmonic component, the intensity should have a basic harmonic component too.
Diffraction on ns-EC patterns is a more delicate problem. While for stationary ns-EC the experimental findings seem to agree with the theoretical predictions, in case of traveling ns-EC the temporal evolution of the diffraction intensity alters qualitatively. The intensity does not fall down to the background level; reduces from 1 to about which is approximately the same value as that for traveling conductive s-EC rolls. It has also been found by optical microscopy that whenever the ratios of the two kinds of patterns are similar, the Hopf-frequencies are also of the same order of magnitude. Understanding that the diffraction intensity is related to a snapshot of the director field, one might conclude that in traveling ns-EC there is no such time instant when the director returns to its initial undeformed state. That might, e.g., occur if the tilt and azimuthal oscillations (which are in phase for stationary ns-EC) become phase shifted due to the traveling. Theoretical description of this phenomenon is a great challenge; it would require an extension of the WEM by inclusion of flexoelectricity.
Finally, light diffraction experiments on the nematic (5CB) have revealed a completely different temporal evolution of the light intensity. Instead of intensity oscillations (which were observed both in s-EC and in ns-EC), here we have detected a sequence of bursts occurring twice within one period, while in most of the time the pattern does not exists at all. Bursts may exist in s-EC too: it has been reported for dielectric s-EC May08 and has recently been detected in the conductive regime as well Eberunpub . Surprisingly, however, the bursts in 5CB occur even at quite high frequencies (around 20Hz, see Fig. 5), while in s-EC (Phase 4 or Phase 5) they become observable only at very low (Hz) driving. This huge difference in frequency range cannot be explained by differences in the sample thickness or of the viscosity coefficients. Also, in the NLC the phase shift between the bursts and the driving voltage appears to be independent of , which is not the case in the dielectric s-EC May08 . These observations suggest that the instability mechanism in nematics is completely different from that of the roll patterns of either s-EC of or ns-EC of NLCs, and the phenomenon is governed – at least partially – by different time scales.
ACKNOWLEDGEMENTS
We thank to W. Pesch and A.P. Krekhov for fruitful discussions. Financial support by the Hungarian Research Fund Contract No. OTKA-K81250 is gratefully acknowledged.
References
- (1) L. Kramer and W. Pesch, in Pattern Formation in Liquid Crystals, edited by Á. Buka and L. Kramer (Springer-Verlag, New York, 1996), p. 221.
- (2) L. Kramer and W. Pesch, in Physical Properties of Liquid Crystals: Nematics, edited by D.A. Dunmur, A. Fukuda and G.R. Luckhurts (EMIS Datareview Series, London, 2001), p. 441.
- (3) A. Buka, N. Éber, W. Pesch, and L. Kramer, in Self Assembly, Pattern Formation and Growth Phenomena in Nano-Systems, edited by A.A. Golovin and A.A. Nepomnyashchy (Springer, Dortrecht, 2006), p. 55.
- (4) E. Bodenschatz, W. Zimmermann, and L. Kramer, J. Phys. (France) 49, 1875 (1988).
- (5) A. Buka, B. Dressel, W. Otowski, K. Camara, T. Tóth-Katona, L. Kramer, J. Lindau, G. Pelzl, and W. Pesch, Phys. Rev. E 66, 051713 (2002); A. Buka, B. Dressel, L. Kramer, and W. Pesch, Phys. Rev. Lett. 93, 044502 (2004); A. Buka, B. Dressel, L. Kramer, and W.Pesch, Chaos 14, 793 (2004).
- (6) S. Kai, K. Hayashi, and Y. Hidaka, J. Phys. Chem. 100, 19007 (1996).
- (7) A. Buka, P. Toth, N. Eber, and L. Kramer, Phys. Rep. 337, 157 (2000).
- (8) S. Kai and K. Hirakawa, Prog. Theor. Phys. Suppl. 64, 212 (1978).
- (9) A. Joets and R. Ribotta, Phys. Rev. Lett. 60, 2164 (1988).
- (10) I. Rehberg, S. Rasenat, and V. Steinberg, Phys. Rev. Lett. 62, 756 (1989).
- (11) M. Dennin, D.S. Cannell, and G. Ahlers, Mol. Cryst. Liq. Cryst. Sci. Technol., Sect. A 261, 337 (1995).
- (12) M. Treiber and L. Kramer, Mol. Cryst. Liq. Cryst. Sci. Technol., Sect. A 261, 311 (1995).
- (13) P.G de Gennes and J. Prost, The Physics of Liquid Crystals (Claredon Press, Oxford, 1993).
- (14) M. Goscianski and L. Léger, J. Phys. (France) bf 36, C1-231 (1975).
- (15) L.M. Blinov, M.I. Barnik, V.T. Lazareva, and A.N. Trufanov, J. Phys (France) 40, C3-263 (1979).
- (16) E. Kochowska, S. Németh, G. Pelzl, and Á. Buka, Phys. Rev. E 70, 011711 (2004).
- (17) T. Tóth-Katona, A. Cauquil-Vergnes, N. Éber, and Á. Buka, Phys. Rev. E 75, 066210 (2007).
- (18) M.I. Barnik, L.M. Blinov, S.A. Pikin, and A.N. Trufanov, Sov. Phys. JETP 45, 396 (1977).
- (19) N.V. Madhusudana and V.A. Raghunathan, Mol. Cryst. Liq. Cryst. Lett. 56, 201 (1988); Liq. Cryst. 5, 1789 (1989).
- (20) A. Krekhov, W. Pesch, N. Éber, T. Tóth-Katona, and Á. Buka, Phys. Rev. E 77, 021705 (2008).
- (21) L. M. Blinov and V. G. Chigrinov, Electrooptic Effects in Liquid Crystal Materials (Springer, Berlin, 1996).
- (22) A. N. Trufanov, M. I. Barnik, L. M. Blinov, and V. G. Chigrinov, Zh. Eksp. Teor. Fiz. 80, 704 (1981).
- (23) D. K. Rout and R. N. P. Choudhary, Liq. Cryst. 4, 393 (1989).
- (24) E.I. Rjumtsev and S.G. Polushin, Liq. Cryst. 13, 623 (1993).
- (25) M. Nakagawa and T. Akahane, J. Phys. Soc. Japan 52, 3773 (1983); ibid. 52, 3782 (1983).
- (26) P. Kumar, J. Heuer, T. Tóth-Katona, N. Éber, and Á. Buka, Phys. Rev. E 81, 020702(R) (2010).
- (27) N. Felici, Revue generale de l’Electricite 78, 717(1969).
- (28) N. Eber, S.A. Rozanski, S. Nemeth, and A. Buka, Phys. Rev. E 70, 061706 (2004).
- (29) W. Pesch, L. Kramer, N. Eber, and A. Buka, Phys. Rev. E 73, 061705 (2006).
- (30) M. May, W. Schöpf, I. Rehberg, A. Krekhov, and Á. Buka, Phys. Rev. E 78, 046215 (2008).
- (31) U. Schneider, M. de la Torre Juárez, W. Zimmermann, and I. Rehberg, Phys. Rev. A 46, 1009 (1992).
- (32) S. Messlinger, A. Sack, W. Schöpf, and Ingo Rehberg, 35th Topical Meeting on Liquid Crystals, Bayreuth 2007.
- (33) J.A. Kosmopoulos and H.M. Zenginoglou, Appl. Opt. 26, 1714 (1987).
- (34) H.M. Zenginoglou and J.A. Kosmopoulos, Appl. Opt. 27, 3898 (1988).
- (35) H.M. Zenginoglou and J.A. Kosmopoulos, Appl. Opt. 28, 3516 (1989).
- (36) T.O. Caroll, J. Appl. Phys. 43, 767 (1972).
- (37) S. Lu and D. Jones, J. Appl. Phys. 42, 2138 (1971).
- (38) Z.D. Xu, Y.N. He, M.C. Guo, and X.G. Wang, J. Appl. Phys. 102, 026101 (2007).
- (39) S. Akahoshi, K. Miyakawa, and A. Takase, Japan. J. Appl. Phys. 15, 1839 (1976).
- (40) H. Miike, Y. Kuriyama, H. Hashimoto, and Y. Ebina, J. Phys. Soc. Japan 53, 3280 (1984).
- (41) T. John, U. Behn, and R. Stannarius, Phys. Rev. E 65, 046229 (2002).
- (42) T. John, U. Behn, and R. Stannarius, Eur. Phys. J. B 35, 267 (2003).
- (43) T. John, U. Behn, and R. Stannarius, Phys. Rev. E 70, 025202(R) (2004).
- (44) P.L. Papadopoulos, H.M. Zenginoglou, and J.A. Kosmopoulos, J. Appl. Phys. 86, 3042 (1999).
- (45) Orsay Liquid Crystal Group, Mol. Cryst. Liq. Cryst. 12, 251 (1971).
- (46) H. Kresse, A. Wiegeleben, and D. Demus, Krist. Tech. 15, 341 (1980).
- (47) T. Tóth-Katona, N. Éber, A. Krekhov, and Á. Buka, Phys. Rev. E 78, 036306 (2008).
- (48) A. Krekhov, W. Pesch, and Á. Buka (unpublished).
- (49) N. Éber, Á. Buka, L.O. Palomares, A. Krekhov, and W. Pesch (unpublished).