A broad-band X-ray view of the Warm Absorber in radio-quiet quasar MR 2251-178.
Abstract
We present the analysis of a new broad-band X-ray spectrum ( keV) of the radio-quiet quasar MR 2251-178 which uses data obtained with both Suzaku and the Swift/BAT. In accordance with previous observations, we find that the general continuum can be well described by a power-law with and an apparent soft-excess below 1 keV. Warm absorption is clearly present and absorption lines due to the Fe UTA, Fe L (Fe xxiii-xxiv), S xv and S xvi are detected below keV. At higher energies, Fe K absorption from Fe xxv-xxvi is detected and a relatively weak ( eV) narrow Fe K emission line is observed at keV. The Fe K emission is well modelled by the presence of a mildly ionised () reflection component with a low reflection fraction (). At least 5 ionised absorption components with cm-2 and are required to achieve an adequate spectral fit. Alternatively, we show that the continuum can also be fit if a power-law is absorbed by a column of cm-2 which covers % of the source flux. Independent of which continuum model is adopted, the Fe L and Fe xxv He lines are described by a single absorber outflowing with c. Such an outflow/disk wind is likely to be substantially clumped () in order to not vastly exceed the likely accretion rate of the source.
keywords:
galaxies: active – galaxies: individual (MR 2251-178) – X-rays: galaxies1 Introduction
It is now well established that the soft X-ray spectrum of at least half of all Seyfert 1 galaxies is characterised by regions of photoionised “warm” absorption along the line of sight (Blustin et al. 2005; McKernan et al. 2007). Extensive studies of the local Seyfert population with Chandra and XMM-Newton have revealed that the warm absorber (WA) is an intricate array of narrow absorption lines, often seen to be moderately blueshifted with km s-1, from various ionisation stages of abundant elements such as C, N, O, Ne, Mg, Si, S and Fe (e.g. Kaastra et al. 2000; Kaspi et al. 2002; Crenshaw, Kraemer & George 2003). Detailed modelling of the WA with photoionisation codes such as xstar (Bautista & Kallman 2001) have shown that the absorbing material is typified by an ionisation parameter in the range , a column density of between cm-2, and most likely originate in a wind outflowing from the putative torus (Blustin et al. 2005) or the later stages of an accretion disk wind (Proga & Kallman 2004). Energetically, due to their low , soft X-ray WAs typically have kinetic luminosities to the order of of an AGN’s bolometric luminosity (e.g. Blustin et al. 2005) and are therefore unlikely play an important role in terms of AGN feedback scenarios.
In addition, there is now also a large body of observational evidence for blueshifted absorption lines at rest-frame energies greater than 7 keV in many AGN (e.g. PG 1211+143, Pounds et al. 2003; PDS 456, Reeves et al. 2003; NGC 1365, Risaliti et al. 2005; MCG -5-23-16, Braito et al. 2007; H 1413+117, Chartas et al. 2007; Mrk 766, Miller et al. 2007; NGC 3516, Turner et al. 2008; Mrk 509, Cappi et al. 2009; 3C 445, Reeves et al. 2010 & Braito et al. 2011; Tombesi et al. 2010a; Tombesi et al. 2010b). This absorption is generally attributed to Fe xxv/xxvi in an outflowing accretion disk wind and requires both a high column density (i.e. cm-2 or above), high ionisation parameter (i.e. ), and an outflow velocity c.
Given their large outflow velocities the resulting kinetic power of accretion disk winds can reach a significant fraction of a sources bolometric luminosity (e.g. Pounds & Reeves 2007; Tombesi et al. 2010b) and they may represent a driving mechanism for AGN feedback processes. Indeed, extrapolating the kinetic luminosity over a conservative active phase and outflow duty cycle for a given AGN, it is often found that the total mechanical output can be in excess of, or is at least very similar to, the binding energy of a reasonably sized galaxy bulge. Accretion disk winds could therefore be a possible explanation for the observed relation (Ferrarese & Merritt 2000; Gebhardt et al. 2000); where mass ejected from a radiatively driven accretion disk wind (e.g. King 2003) can move out into a host galaxy, sweeping up material until, once a critical black hole mass has been reached, the ISM has been evacuated of material and both star formation and SMBH growth cease (see King 2010, and references therein)
1.1 The Radio-Quiet Quasar MR 2251-178
MR 2251-178 (; Bergeron et al. 1983; Canizares et al. 1978) was first detected as a bright X-ray source during the Ariel V all-sky survey (Cooke et al. 1978) and subsequently identified as a radio-quiet quasar by Ricker et al. (1978) using SAS-3 observations. The quasar is located on the outskirts of a cluster of approximately 50 galaxies (Phillips 1980) and is surrounded by a large extended nebula of diffuse gas which is characterised by [O iii] emission in the optical (Bergeron et al. 1983). More recent observations have also noted similar extended emission in the X-ray band (Kaspi et al. 2004; Gibson et al. 2005). The source is observed to be a weak radio emitter, and has a Fanaroff-Riley type I (FR I) morphology.
The first detailed spectral study of MR 2251-178 in the X-rays was conducted by Halpern (1984) who noticed that absorption in the soft X-ray band varied on time scales of around year. The variability implied an order of magnitude increase in the absorption column and was attributed to the change in ionisation of material along the line of sight. Historically, this is regarded as the first suggestion of an X-ray AGN warm absorber.
Subsequent observations with EXOSAT, Ginga and BeppoSAX established that the broadband X-ray spectrum of MR 2251-178 can be well described by a power-law of photon-index which is absorbed by a column density of around a few cm-2 (Pan et al. 1990; Mineo & Stewart 1993), and a high-energy roll-over at around keV (Orr et al. 2001). Mineo & Stewart (1993) also found that the ionisation state of the absorbing material was strongly correlated with the source luminosity.
In the ultra-violet (UV), Monier et al. (2001) found absorption lines due to Ly, N v and C iv blueshifted in the rest-frame by km s-1. The C iv absorption was later shown by Ganguly et al. (2001) to vary over a period of roughly 4 years which enabled the authors to deduce a maximum distance of 2.4 kpc between the absorption clouds and the continuum source.
Kaspi et al. (2004), using a series of ASCA, BeppoSAX and XMM-Newton observations which spanned 8.5 years, confirmed that the continuum can be described by an absorbed power-law of photon index but found that it further required an additional soft excess at low X-ray energies. The XMM-Newton spectrum required at least two or three separate ionised absorbers with column densities in the range cm-2 and had physical properties which appeared to vary between observations. This lead the authors to posit a scenario where absorption clouds were moving across the line of sight over the timescale of ‘several months’. Further UV absorption lines from C iii, H i and O vi were detected in the FUSE spectrum, which were blueshifted with velocities similar to those found by Monier et al. (2001).
MR 2251-178 has also been observed by the Chandra/HETG which revealed evidence of a highly-ionised, high-velocity (i.e. km s-1) outflow in the Fe K band (Gibson et al. 2005). Gibson et al. (2005) attributed this absorption to the Ly line of Fe xxvi, and inferred that unless the absorber has a low covering fraction the mass-loss rate of MR 2251-178 is at least an order of magnitude larger than the accretion rate.
In this paper we present a new broad-band X-ray observation of MR 2251-178, using data obtained with both Suzaku and the Swift Burst Alert Telescope (BAT). We begin by discussing the data reduction process in §2, and then parameterise the broadband spectrum in §3. In §3.2 we discuss the several absorption lines which are detected and determine their statistical significance, before performing a detailed modelling of the spectrum with the xstar photoionisation code in §4. To calculate luminosities, a concordance cosmology with H km s-1 Mpc-1, =0.73, and =0.27 (Spergel et al. 2003) was adopted.
| Instrument | Date | Exposure | Count rate | Flux | Obs. ID | |
|---|---|---|---|---|---|---|
| (ks) | (s-1) | ( erg cm-2 s-1) | ||||
| Suzaku | XIS-FI | 07/05/09 | 136924 | 4.29a | 704055010 | |
| XIS-BI | 4.35a | |||||
| HXD/PIN | 103800 | 5.48b | ||||
| HXD/GSO | 89228 | |||||
| Swift | BAT | – | – | ( | 6.63d | N/A |
a 2-10 keV flux.
b 15-50 keV flux.
c 50-100 keV flux 90% upper limit
d 20-100 keV flux.
2 The Suzaku & Swift Observations of MR 2251-178
Suzaku (Mitsuda et al. 2007) observed MR 2251-178 in the XIS nominal pointing position for 287 ks between the of May . Data are included from the X-ray Imaging Spectrometer (XIS; Koyama et al. 2007) and from the PIN instrument of the Hard X-ray Detector (HXD; Takahashi 2007), both of which were processed using version 2.3.12.25 of the Suzaku data reduction pipeline.
A complementary hard X-ray dataset obtained with the Swift Burst Alert Telescope (BAT), which observed MR 2251-178 as part of the 58 month all sky survey (Baumgartner et al. 2010), is also included in our analysis. A summary of the observations is included in Table 1.
2.1 XIS Data Reduction
XIS data were selected in the and modes using ASCA grades 0, 2, 3, 4 and 6. Standard XIS screening criteria were applied such that data were excluded if taken: (1) within 436 s of passage through the South Atlantic Anomaly (SAA), (2) within an Earth elevation angle (ELV) , and/or (3) with Earth day-time elevation angles . Hot and flickering pixels were removed from the XIS images using the cleansis script. Source spectra were extracted from within circular regions of radius , and background spectra were extracted from offset annuli of the same radius with care taken to avoid the corners containing the Fe55 calibration sources. The redistribution matrix file and ancillary response file were generated using the tasks xisrmfgen and xissimarfgen, respectively.
After checking for consistency (see §3.1), spectra obtained from the two front-illuminated XIS 0 and XIS 3 detectors were combined into a single source spectrum (hereafter referred to as XIS-FI) using mathpha in order to maximise signal-to-noise. Data from the back-illuminated XIS 1 (hereafter XIS-BI) were not combined and were instead analysed separately. Only XIS data over the energy range 0.6–9.0 keV were included due to a degradation in S/N above 9.0 keV. Data were also ignored between 1.6–2.1 keV due to uncertainties associated with the the Si K edges intrinsic to the detector assembly of the XIS instrument.
The background subtracted count rates during the observation were per CCD for the XIS-FI and in the case of the XIS-BI. The net exposure for the observation was 136.9 ks. All XIS spectra and corresponding response files were binned to sample the half-width half-maximum (HWHM) energy resolution of the detectors (i.e. 60 eV resolution at 6 keV). Counts were additionally grouped with grppha to achieve a minimum of 50 counts per energy bin to enable the use of minimisation, which was used for all subsequent spectral fitting.
2.2 HXD/PIN & GSO Data Reduction
The HXD/PIN spectrum was extracted from the cleaned events files and was also processed according to the screening criteria described previously. The Non X-ray Background (NXB) was generated using the tuned event files made available by the HXD instrument team (Fukazawa et al. 2009) with a count rate of counts s-1. The Cosmic X-ray Background (CXB) was simulated using the form of Boldt (1987) and resulted in a CXB count rate of counts s-1. Simultaneous good time intervals (GTIs) were found for both the source spectrum and the NXB using the mgtime task and the NXB exposure time was increased by a factor of ten to reduce the effects of photon noise. The NXB and CXB were combined with equal weight using the mathpha operation and subsequently subtracted from the source spectrum within xspec.
The background subtracted count rate in the HXD/PIN was counts s-1, corresponding to a 15-50 keV flux of erg cm-2 s-1. The net exposure time was 103.8 ks after detector dead time was taken into account with hxddtcor. Spectra were binned to a 5 level above the background per bin from 15-50 keV.
For consistency we also reduced the data obtained with the HXD/GSO. The total (background subtracted) GSO exposure was 89.2 ks for a count rate of counts s-1, which corresponds to 90% upper limit on the 50-100 keV flux of erg cm s-1. Note that the GSO data are not used during spectral fitting and are used solely to check the consistency of the time-averaged Swift/BAT dataset.
3 Broad-band X-ray Spectral Analysis
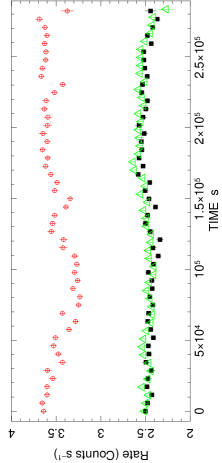
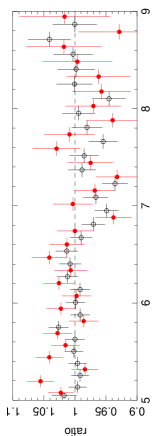
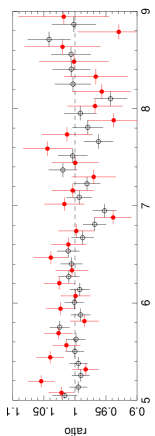
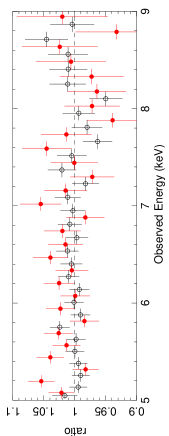
We performed a wide-band spectral analysis of MR 2251-178 in the 0.6–180 keV energy range using xspec v. (Arnaud 1996) and heasoft v. . All fits were modified by a Galactic column of (Dickey & Lockman 1990) which was not allowed to vary. We used a photoelectric absorber with Wisconsin cross-sections (the wabs component in xspec; Morrison & McCammon 1983) to model the Galactic absorption. Spectral parameters are quoted in the rest-frame of the source () unless otherwise stated and errors are quoted to the 90% level for 1 parameter of interest (i.e. ). The cross-normalisations for the XIS-FI and XIS-BI were allowed to vary in all fits and generally found to be within of each other. The HXD/PIN normalisation was set to 1.16 of the XIS. The normalisation on the Swift/BAT was left as a free parameter throughout, and was found to be 4-5% greater than that of the XIS instruments. There was no strong variability (i.e. level) observed over the course of the observation. Lightcurves for the three XIS detectors are shown in Fig 1. In all spectral plots XIS data are binned to sample the half-width half-maximum energy resolution of the detectors (i.e. 60 eV at 6 keV) unless otherwise stated.
3.1 Initial Continuum Parameterisation
We first considered the X-ray spectrum of MR 2251-178 in the 3–5 keV band of the XIS data. An initial fit of the continuum with a simple power–law of photon index modified solely by Galactic absorption yielded a reasonable fit (with /degrees of freedom=212.5/178). Individually, the photon indices for the three XIS spectra are all in good agreement with this value, and have indices of , and for the XIS 0, XIS 1 and XIS 3 data, respectively.
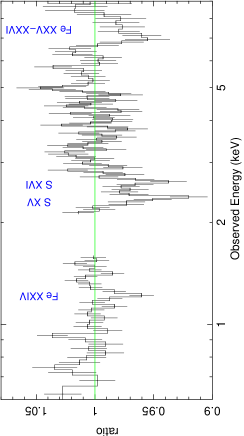
Extending the data to include the full 0.6–180.0 keV energy range reveals significant deviations from the simple power–law fit and the fitting statistic is extremely poor (). The residuals of this fit are shown in Fig. 2 (top panel).
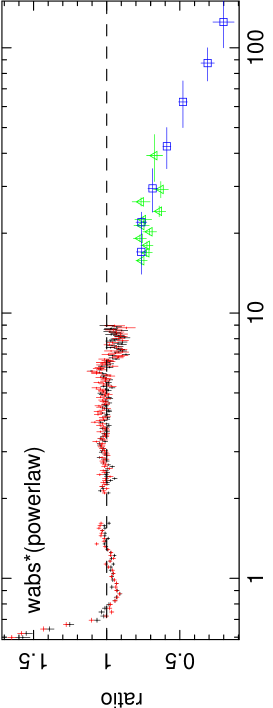
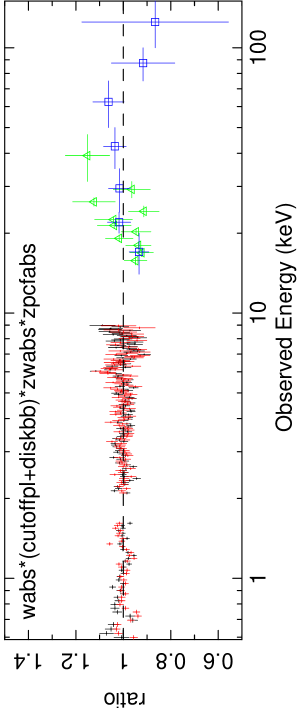
In the XIS data a clear soft excess can be seen at energies below around 0.7 keV and there is a noticeable discrepancy between 0.8–1.6 keV, presumably due to the presence of the warm absorber. The ubiquitous Fe K line is present at keV and the spectrum also appears to roll over above 10 keV in accordance with the presence of the high-energy cut-off reported by Orr et al. (2001). Note that as the Swift/BAT spectrum is time-averaged over 58 months, we checked the HXD/GSO spectrum to determine the validity of the high-energy cut-off present in the BAT data. We find a upper limit for the HXD/GSO flux of erg cm-2 s-1 in the 50-100 keV band, which is consistent with the Swift/BAT flux over the same energy range ( erg cm-2 s-1) and suggests that the roll-over is valid for the Suzaku observation.
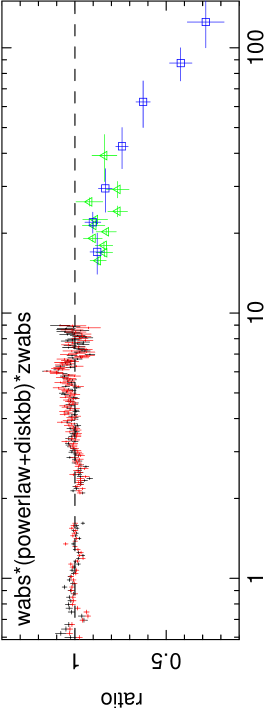
To parameterise the 0.6–180 keV continuum we initially fit the data with a model of the form , where the diskbb component is a simple parameterisation of the soft excess as an accretion disk blackbody, zgauss is a Gaussian used to model the Fe K fluorescence emission line and zwabs is a simple photoelectric absorber modelled in the source rest-frame (i.e. at z=0.064).
With this model the fit statistic is drastically improved, but is still quite poor (). The power-law component has a photon index of and is absorbed by cm-2, which is similar to that found by Ramìrez et al. (2008) for the lowly ionised absorber in the Chandra/LETG observation of this source. The accretion disk blackbody used to parameterise the soft-excess has a temperature eV. The Fe K line is unresolved ( eV) and found at a rest-frame energy of keV, which is consistent with an origin in neutral or mildly ionised material. As shown in Figure 2 (second panel), the poor fit statistic is due to the model being unable to adequately reproduce the spectral curvature between keV and in the hard X-ray band. This suggests that additional absorption is required.
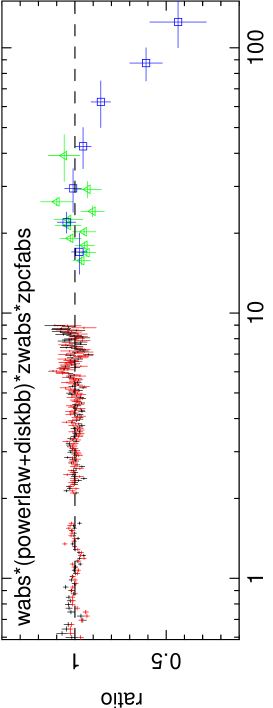
We therefore tested for a more complex absorption scenario by adding an additional neutral absorber with cm-2 which covers of the source flux (modelled with zpcfabs in xspec). This gives a significant improvement to the fit ( for two additional free parameters) and the residual spectral curvature in the XIS data is no longer present. With a softer photon index of , the new model was also able to replicate the observed flux in the HXD/PIN data. Nevertheless, visual inspection of the third panel in Figure 2 shows that the model is still unable to reproduce the curvature present above keV (Figure 2, third panel).
In order to fit the observed rollover in the Swift/BAT data we replaced the power-law with a cutoffpl component which models a power-law with an exponential high-energy cut-off (). The addition of the cut-off further improves the fit by for 1 more free parameter and there are no longer any residuals in the BAT data (Figure 2, bottom panel). In this model and keV, zwabs has cm-2, zpcfabs covers of the source flux with cm-2 and the soft excess is parameterised by a eV accretion disk blackbody. The final fit statistic is and is our best-fit continuum parameterisation.
3.2 Absorption Lines
Several absorption features are present below 3 keV and in the Fe K band. We modelled these absorption lines with Gaussian profiles fit in the rest-frame of the AGN. The statistical significances for each absorption line in this section were determined against the best-fit continuum model discussed above. Monte Carlo simulations (MC) were also performed to further assess the statistical significances; the details of which are discussed in §3.3. Table 2 shows a summary of all line parameters. Detailed discussion regarding all line identifications, including the consideration of alternative identifications, is presented in appendix A.
3.2.1 The Soft X-ray band
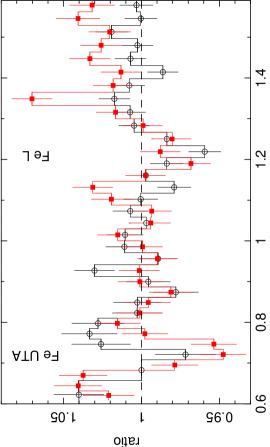
Below 2 keV two absorption lines are required (Fig. 3; top panel). The first is unresolved and detected at a rest-frame energy of keV. This is consistent with the Fe i-xvi M-shell unresolved transition array (UTA) which is expected between 0.729–0.775 keV (Behar et al. 2001, Netzer et al. 2004). The line has an equivalent width (EW) of eV and its addition to the model improves the global fit by . The line is found to be 99.9% significant from MC simulations.
The second line has a rest energy of keV and an EW= eV. The line is highly significant ( from MC simulations) and its addition improves the fit by . Unlike the UTA, this second line does not have an energy that corresponds to any expected strong X-ray transitions. There are several possible identifications for this line (see Appendix A) but the most conservative association which is internally consistent with our xstar model (§4) is with the Fe xxiv 2s3p doublet which is expected at an mean energy of keV. The line identification requires a blueshift of c () assuming this identification.
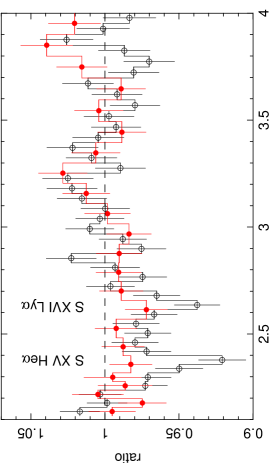
Two further Gaussian absorption lines are required at keV and keV in the rest-frame, with equivalent widths of eV and eV, respectively (Fig. 3; middle panel). Both lines are significant at the level from MC simulations and their addition improves the model by a further and , respectively. Theoretically, the strongest spectral features expected in the 2–3 keV energy range are those associated with the 1s2p transitions of S xv ( keV) and S xvi ( keV), but the rest-frame energies of the detected lines do not correspond to either of these which suggesting that they may be blueshifted. If identified with the S xv and S xvi transitions the measured line centroids indicate that they are blueshifted by c () and c (), respectively. Both lines are unresolved and their widths were fixed to eV throughout.

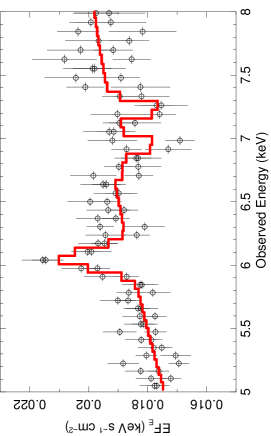
3.2.2 The Fe K region
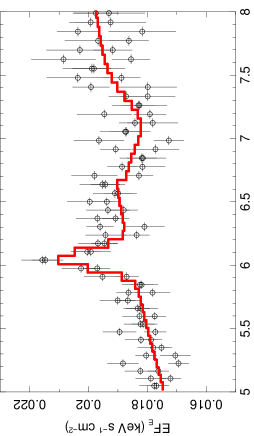
There are further residuals in the data/model ratio present in the Fe K region. In addition to the Fe K emission line there is a clear broad absorption feature in the 6.5–8 keV range, as can be seen in the bottom panel of Fig. 3. Note that this absorption is found in excess of the neutral Fe K absorption edge (expected at E=7.1 keV) which is included as part of both the zwabs and zpcfabs absorbers. This absorption trough was initially modelled with a broad Gaussian profile and its centroid energy left as a free parameter. The centroid energy and intrinsic width of the broad line are keV and eV, and it has an EW of eV. The addition of the line results in a improvement of for 3 additional free parameters, and it is statistically required at the 99.3% level from MC simulations. With the addition of the broad absorption component the width of the Fe K emission line is now more tightly constrained than before at eV (while EW= eV).
In this energy range the spectrum is expected to be dominated by atomic features attributable to iron. In particular, the 1s2p transitions are expected to be particularly strong, as are the many resonance transitions associated with the Fe K edge near 7.1 keV (Kallman et al. 2004). If due to the strong 1s2p transitions this immediately places a constraint on the possible identifications for the absorption as being due to at least Fe xviii ( keV), where the Fe ions become sufficiently ionised to have an L-shell vacancy for a 1s electron transition. Above this ionisation state, the 1s2p transitions occur between keV for Fe xviii-xxiv, and at keV and keV for Fe xxv He and Fe xxvi Ly, respectively. If the broad profile is identified with Fe xxv He it requires a velocity shift of c (= ), while if identified with Fe xxvi Ly the velocity shift is slightly lower at c ().
An alternative interpretation is that the broad absorption represents a blend of the above lines rather than a single discrete profile. To investigate the possibility that the profile is a blend of He- and H- like Fe we replaced the broad profile with two narrow ( eV) absorption lines at fixed rest frame energies of keV and keV and left their common velocity shift as a free parameter. This fit was a slight improvement to that of the broad Gaussian obtained previously, and gives a for 3 parameters of interest. Even so Fig. 4 shows that this model slightly under-predicts the absorbed flux of the Fe xxv He line at keV (rest-frame; observed), while the Fe xxvi Ly line is well fit. The resulting simultaneous velocity shift is c with respect to the rest frame of the AGN.
| Line ID | (keV) | (keV) | Fluxa | (eV) | EW (eV) | MC | |
|---|---|---|---|---|---|---|---|
| Fe UTA | 65.6 | ||||||
| Fe xxiv | 66.1 | ||||||
| (2s3p) | |||||||
| S xv | 2.461 | 15.9 | |||||
| S xvi | 2.623 | 10.9 | |||||
| Fe K | 6.4 | 52.9 | — | ||||
| Fe xxv-xxvi | 6.7 and/or 6.97 | 16.6 | 99.3% |
∗ Denotes parameter was fixed at listed value
a Line flux quoted in units of erg cm-2 s-1.
b Change in fitting statistic when adding a Gaussian to best-fit continuum model.
3.3 Montecarlo Simulations
The Montecarlo simulations we used are analogous to those carried out by Tombesi et al. (2010a). Briefly:
-
1.
We simulated XIS spectra between 0.6-10.0 keV based upon the baseline continuum parameterisation model (outlined in §3.1), using the fakeit command in xspec. Both the HXD/PIN and Swift/BAT spectra were not included in the simulation as they had no effect on the absorption line parameters.
-
2.
In each of the simulated spectra we stepped an inverted Gaussian of a set fixed width (see below) between two pre-defined energy bands in equal steps. After each step, the model was fit for the line normalisation of the Gaussian and the resulting overall was recorded. To sample the entire XIS spectrum we performed this process twice, once to cover the Fe K band and once to cover the soft X-rays. For the Fe K absorption we stepped a broad absorption line of eV width every 100 eV between 4-9 keV, while in the soft X-ray band we stepped a narrow absorption line of 10 eV width every 25 eV between 0.6 and 4 keV. Due to the XIS-BI having poorer S/N around Fe K we used only the XIS-FI data in this band. Both the XIS-FI and XIS-BI were used in the soft X-rays where the S/N of the XIS-BI is higher.
-
3.
After spectra were generated the associated grid of values then corresponded to how statistically likely it would be for a randomly occurring feature to have a improvement greater than a particular value. To assess the probabilities of the absorption lines detected, the value we obtained from our Gaussian fits was then compared to this generated grid of values. If of the simulated spectra had a feature of significance greater than this value, the resulting detection confidence level of the measured line was .
The statistical probabilities for each line from MC simulations are recorded in Table 2.
4 Self-consistent Modelling
With both the general continuum and the absorption lines parameterised, we proceeded to replace the simple parameterising models (i.e. zpcfabs and zwabs) with a series of self-consistent model grids generated using the xstar photoionisation code. Each xstar grid contains a series of models, each pertaining to a particular photoionised spectrum with a characteristic ionisation parameter (), a column density (), and a redshift (). In addition, each grid is attributed an intrinsic turbulent velocity () upon generation which determines the intrinsic width of any emission and absorption lines. The grid is then used as a simple multiplicative model in xspec to simultaneously fit the broadband continuum and any spectral lines which may be present.
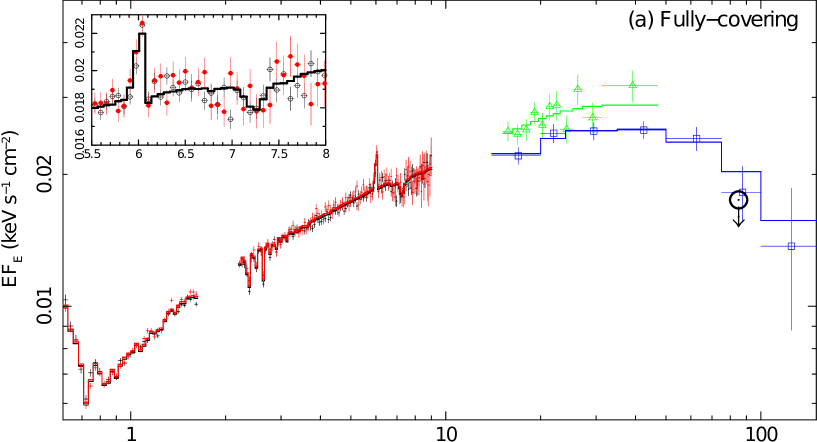
4.1 Fully covering models
We first modelled the spectrum assuming that the photoionised absorbers fully cover the view to the ionising source, and that the soft excess represents an intrinsic component of the source continuum. We sequentially added xstar grids to a baseline continuum model of the form wabs (cutoffpl+ diskbb+zgauss) xstar until an acceptable fit had been achieved. Solar abundances of Grevesse & Sauval (1998) are assumed throughout unless otherwise stated.
4.1.1 Lowly ionised absorbers
In the soft X-ray band two low turbulence ( km s-1) ionised absorption components are required to provide a good description to both the Fe UTA absorption line and the general spectral curvature below 10 keV (see Fig. 5). The first absorber (Zone 1; for 3 additional free parameters) is lowly ionised and mainly responsible for the Fe UTA, while he second absorber (Zone 2) is less significant to the fit ( for 2 more free parameters) and mainly fits the curvature. These absorbers also contribute to a shallow Fe K edge in the Fe K band, however its depth is insufficient to adequately replicate the feature (see §4.1.4). For fitting purposes the soft X-ray absorbers were assumed to be co-spatial and their common outflow velocity was fixed to km s-1 to be consistent with the UV outflows reported in this source by Monier et al. (2001). Allowing the outflow velocities to vary did not yield any appreciable change in the fit statistic and they were thus left fixed throughout.
4.1.2 Detection of a Fe L-shell and Fe xxv absorber?
To model the absorption line at keV we used a higher turbulence ( km s-1) grid to account for the apparent line broadening. Zone 3 (; see TableLABEL:final_fcov for parameters) fits both the 1.29 keV line (Fig 6) and also appears to fit the higher energy component of the Fe K absorption (Fig. 7) at keV (rest-frame; 7.24 keV observed). The outflow velocity found for this absorber is consistent with an identification of the Fe K absorption with Fe xxv He, however, the velocity is substantially larger than that found if the 1.29 keV line is identified as solely Fe xxiv. This could be the result of the line at 1.29 keV being a blend of Fe xxiii (2s3p; expected at 1.127 keV) and Fe xxiv (2s3p). If this is the case, the outflow velocity would then be consistent with that found for the xstar grid. We hereafter denote this absorption component the “Fe L-shell absorber” as at an ionisation of , the most prominent ions are from Fe xxiii-xxv.
4.1.3 Sulphur absorbers
There is a level of ambiguity regarding the correct physical interpretation of the lines at and keV. In particular, we were unable to obtain a satisfactory fit to the lines assuming solar abundances, and the lack of other distinct absorption lines meant that when fit with variable abundances, the required Sulphur over-abundance was entirely unconstrained. With the current data we therefore parameterise the absorption lines using a column density comprising solely of Sulphur ().
As discussed in §3.2.1, the most conservative interpretation is that the lines are identified with the 1s2p transitions of He- and H-like Sulphur, respectively. In this interpretation the lines are well modelled by the addition of two further ionised absorbers. The first (Zone 4), which models S xv at keV, is described and a Sulphur column density of cm-2. For a solar Sulphur/Hydrogen abundance ratio of (Grevesse & Suvaul 1998) this corresponds to a Hydrogen column of cm-2, which is similar to the column densities reported previously for this source (i.e. Orr et al. 2001; Kaspi et al. 2004; Gibson et al. 2005, Ramìrez et al. 2008). The net outflow velocity of this absorber is km s-1 ( c), which is consistent with that found when fitting simple Gaussians. At this column density and ionisation parameter the grid also contributes He (1s3p) and weak He (1s4p) lines in addition to strong He, however the energy separation of the lines is insufficient to fit the line at keV simultaneously and a second grid is required to model the remaining residuals.
The second Sulphur absorber (Zone 5; ) which models the S xvi Ly is described by cm-2 (= cm-2) and . The outflow velocity is found to be km s-1 ( c), which is again consistent with that found from simple Gaussian fitting. The fit statistic for the model assuming two zones of Sulphur absorption is .
4.1.4 A further highly ionised zone?
While the soft X-ray and Fe L absorbers contribute a shallow Fe K edge at keV (see middle panel of Figure 7) its depth is insufficient to fit the remaining absorption feature at keV (rest-frame, observed frame keV). This feature can be tentatively ( for 3 additional parameters; Fig 7 bottom panel) fit by the addition of a highly ionised and high column density absorber ( km s-1) which is outflowing with km s-1 ( c). The parameters imply that the feature may be identified with Fe xxvi (1s2p), which is expected to be the must abundant ion at such an ionisation. This feature may be a higher velocity analogue of the outflowing Fe xxvi absorption ( km s-1) which was reported by Gibson et al. (2005) in a earlier Chandra/HETG observation of this source.
4.1.5 Reflection Component
The above absorbers in addition to the cutoffpl, diskbb and zgauss components provide a good description of the general broad-band continuum and the fit is marginally acceptable (; null probability=0.08). However, for consistency we replaced the redshifted Gaussian modelling the Fe K emission with the ionised reflection model reflionx (Ross & Fabian 2005), which self-consistently takes into account any reprocessing due to reflection in a face-on system. Fixed Solar abundances were assumed and the photon-index of the reflected power-law was tied to that of the intrinsic.
The addition of a lowly ionised reflection component ( erg cm s-1) with a low reflection fraction (, where and is the solid angle subtended by the reflector) reproduces the Fe K profile and improves the fit in the hard X-ray band, for a final fit statistic of (null prob=0.14), and keV). The overall best-fit parameters for the fully-covering model are listed in Table LABEL:final_fcov.
| Continuum parameters | |||
| Flux (erg cm-2 s-1) | |||
| Luminosity (erg s-1) | |||
| Best-fit model components | |||
| Component | Parameter | Value | |
| Galactic absorption | — | ||
| cutoffpl | — | ||
| reflection | Abund | 77.2 | |
| R | |||
| diskbb | 114.6 | ||
| norm | |||
| Soft X-ray absorber 1 | 93.7 | ||
| (Zone 1) | |||
| 200 | |||
| Soft X-ray absorber 2 | 36.9 | ||
| (Zone 2) | |||
| 200 | |||
| Fe L absorber | 74.0 | ||
| (Zone 3) | |||
| 5000 | |||
| S xv absorber | 76.4 | ||
| (Zone 3) | |||
| 1000 | |||
| S xvi absorber | 32.9 | ||
| (Zone 5) | |||
| 1000 | |||
a Absorber column density in units of cm-2.
b Cut-off energy in units of keV.
c Accretion disk black body temperature, in units of eV
e ionisation parameter in units of erg cm s-1.
f Outflow Velocity of absorber given in units of km s-1.
g Assumed absorber turbulent velocity in units of km s-1.
h Significance of component with respect to the final best-fitting model.
i Statistical significance of reflionx component is given in comparison to a fit where Fe K is left unmodelled.
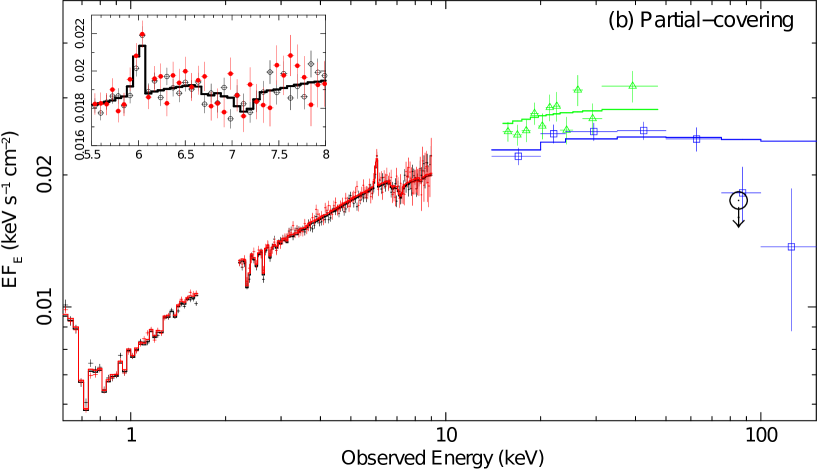
4.2 Partial covering models
We also investigated the possibility that only a fraction of the line-of-sight source flux may be covered by the ionised absorbers. This would then require for the power-law continuum to steepen to compensate for the increased absorption, and similar partial covering scenarios have been invoked to self-consistently model hard X-ray excesses in several AGN (e.g. NGC1365, Risaliti et al. 2009; 1H0419-577, Turner et al. 2009; PDS 456, Reeves et al. 2009). Modelling the hard X-ray excess in this way typically requires the intrinsic flux below 10 keV to be strongly absorbed by Compton thick material (i.e. cm-2). However, if the partial coverer is Compton thin, it may be able replicate the roll-over and soft excess.
We thus constructed a low turbulence ( km s-1 partial covering model using the zxipcf model in xspec. Our starting model had the form wabs (zxipcfpowerlaw+reflionx) xstar, where we have removed the diskbb component which previously parameterised the soft-excess and reverted to a simple power-law with no high-energy cut-off. The overall best-fit parameters for our partial covering model are listed in Table LABEL:final_pcov. Importantly, this model still requires the presence of several fully covering absorbers to account for the Fe L/Fe K and Sulphur absorption, and these absorbers have best-fit parameters which are consistent with those obtained in the fully covering model. A reflionx reflection component was also included for self consistency. In this geometry the partially covering clouds would need to be very compact in size and located close to the ionising source to only obscure a fraction of the emergent continuum. One possibility is that the partial coverer may be associated with a clumpy disk-wind where the covering fraction relates to the filling factor of the denser clouds, while the more ionised absorbers appear to fully cover the source along the line-of-sight. Such scenarios have been effective in explaining the broad-band spectral properties of objects such as MCG -6-30-15 (Miller et al. 2008) and 3C 445 (Reeves et al. 2010), and are consistent with theoretical expectations that disk-winds are inhomogeneous outflows and contain clumps of dense, high column-density, material (e.g. Proga & Kallman 2004; Sim et al. 2010)
In this case the partial covering model requires a very lowly ionised, high column density absorber which covers approximately 30% of the source in order to fit the soft-excess and curvature below 10 keV (Table LABEL:final_pcov). As expected, the power-law is also much steeper () than that usually inferred for this source (). With just the partial coverer included significant residuals remained in the soft X-ray band and two low turbulence ( km s-2) fully-covering absorbers are also required to achieve an adequate fit (Zones 1 and 2 in Table LABEL:final_pcov).
Interestingly, the outflow velocity of Zone 2 is km s-1 ( c), which is much faster than the 100-1000 km s-1 expected for typical warm absorbers (e.g. Blustin et al. 2005; Crenshaw, Kraemer & George 2003). Nevertheless, the very high outflow velocity is strongly required in this model (see Figure 8), and fixing the outflow velocity to the source rest-frame (i.e. ) resulted in a worse fit by (for one less free parameter). As it is not required in the fully-covering scenario, the high outflow velocity of this component is likely to be highly model dependent and further observations at a higher resolution are required to determine its validity.

4.2.1 The Fe K band
As in the fully-covering model, the reflionx component gives an excellent description of the Fe K emission line and the reflector is once again found to be both lowly ionised and have a low reflection fraction. The partial coverer provides a very good fit to the residual absorption in the Fe K band (see inset of Figure. 9, bottom panel) and, in addition to the Fe xxv He absorption which is being modelled by the Fe L absorber, the lowly ionised partial coverer provides an excellent fit to the Fe K edge.
4.2.2 The high-energy roll-over
While the overall fit statistic for the partial covering model is good (; null prob=0.13) the fit still appears to overestimate the flux at the highest energies (see Figure 9, bottom panel). We thus tried to replicate the roll-over by adding an exponential roll-over using the highecut model; however this only marginally improved the fit ( for one additional free parameter). Nevertheless, the final fit statistic for the partial covering model is (null hypothesis=0.168) which is comparable to that obtained with the fully-covering model.
| Continuum parameters | |||
| Flux (erg cm-2 s-1) | |||
| Luminosity (erg s-1) | |||
| Best-fit model components | |||
| Component | Parameter | Value | |
| Galactic absorption | — | ||
| highecut | 10.1 | ||
| power-law | – | ||
| Reflection | Abund | 1∗ | 54.9 |
| R | |||
| zxipcf | 217.9 | ||
| 200 | |||
| Soft X-ray absorber 1 | 110.3 | ||
| (Zone 1) | |||
| Soft X-ray absorber 2 | 106.3 | ||
| (Zone 2) | |||
| 200 km s-1 | |||
| Fe L absorber | 48.7 | ||
| (Zone 3) | |||
| 5000 | |||
| S xv absorber | 51.6 | ||
| (Zone 4) | |||
| 1000 | |||
| S xvi absorber | 20.7 | ||
| (Zone 5) | |||
| 1000 | |||
a Absorber column density in units of cm-2.
b Cut-off energy in units of keV.
e Ionisation parameter in units of erg cm s-1.
f Outflow velocity of the absorber given in units of km s-1.
g Assumed absorber turbulent velocity in units of km s-1.
h Significance of component with respect to the final best-fitting model.
i Statistical significance of reflionx component is given in comparison to a fit where Fe K is left unmodelled.
5 discussion
5.1 The soft excess
We have demonstrated that the soft excess in MR 2251-178 can be adequately modelled either as an intrinsic component of the emergent X-ray continuum (i.e. an accretion disk black body), or as the side effect of an absorption dominated (partially covered) spectrum below 10 keV. However, there are several further alternative interpretations which we also considered.
5.1.1 Comptonisation
A particular caveat of the fully-covering model is the manner in which we have parameterised the soft excess as being the thermal emissions from a geometrically thin accretion disk (diskbb), and thus as an intrinsic component of the X-ray spectrum. While simple and generally well fitting in a wide range of objects, such an interpretation typically requires a thermal continuum with a temperature higher than that expected for geometrically thin accretion disks (e.g. Shakura & Sunyaev 1974; Porquet et al. 2004; Gierliński & Done 2004). The expected temperature for a geometrically thin disk is approximately K, where is the accretion disk mass in units of . With ( (see later) and (Dunn et al. 2008) appropriate for MR 2251-178, and assuming most of the emission originates at the innermost stable circular orbit ( for a Schwarzschild black-hole), we have eV. This is roughly 3 times cooler than the best-fitting diskbb temperature ( eV) and implies that the soft excess cannot easily be attributed to thermal emission from a standard accretion disk without modification.
An alternative interpretation of the soft excess as an intrinsic component is that it is the Wien tail of soft photons from the accretion disk which have been Comptonised by a hot corona located above the plane of the disk (e.g. Czerny & Elvis 1987; Haardt & Maraschi 1991, 1993; Nayakshin, Kazanas, & Kallman 2000; Nayakshin 2001). If the distribution of electrons in such a Comptonising corona is “quasi-Maxwellian” (i.e., has both a thermal and non-thermal component; see Coppi 1999), it may be able to produce both the hard X-ray power-law continuum for which it is typically invoked, as well as the soft excess.
To see whether this interpretation was feasible, we replaced the diskbb component in our best-fitting fully-covering xstar model with the comptt component (Titarchuk 1994). The thermal temperature of the input accretion disk photons was assumed to eV, while the redshift was fixed to that of the source. The resulting fit was comparable (), and the other model parameters were all consistent with those obtained previously when using diskbb. The Comptonising electron temperature is keV and the optical depth of the corona is .
5.1.2 Ionised reflection
Another alternative explanation for the soft excess in general is as a byproduct of ionised reflection from optically thick matter in the nuclear regions of the AGN, e.g. the accretion disk, the broad line region (BLR) or the molecular the torus. However, due to the lack of a strong ionised reflection component and the absence of a broadened iron line, this seems unlikely in the case of MR 2251-178.
5.1.3 Section summary
In summary, the soft excess in MR 2251-178 is well modelled by either a thermal accretion disk black body or as the result of the Comptonisation of soft thermal photons from the accretion disk. A partial covering interpretation of the dataset is also capable of replicating the soft-excess albeit with a steeper power-law photon index, i.e. , which is similar to the value found commonly for radio-quiet quasars (e.g. Porquet et al. 2004). The lack of a strong ionised reflection component above 10 keV and the absence of a broadened Fe K line suggests than an origin through blurred reflection is unlikely. Regardless of the true nature of the soft excess in MR 2251-178, the parameters that describe the fully-covering absorption components are largely invariant between the differing interpretations.
5.2 The Fe K line
From past observations of MR 2251-178 there has been significant uncertainty in the reported Fe K emission EW: i.e. eV (Ginga; Mineo & Stewart 1993), eV (ASCA; Reynolds 1997), eV, (BeppoSAX; Orr et al. 2001) eV (XMM-Newton; Kaspi et al. 2004) and eV (Chandra; Gibson et al. 2005).
A possible explanation for the uncertainty is that the previous observations lacked the spectral resolution and S/N in the Fe K band in order to resolve the absorption feature blue-ward of the Fe K, and this may have artificially broadened the measured EW of the Fe K emission line. Incidentally, we note that the two observations thus far which have reported the presence of Fe xxv/xxvi absorption (this work and Gibson et al. 2005) have also reported the tightest constraint on the Fe K EW.
Even so, the Fe K EW we find for MR 2251-178 is still below average. For example, based on an archival study of 36 sources in the Chandra/HETG archive (which includes MR 2251-178) Shu et al. (2010) have reported the narrow core of the Fe K emission line has a weighted mean EW of eV, which is substantially broader than that which we find here. Furthermore, from their large Suzaku study of nearby Seyfert galaxies, Fukazawa et al. (2010) have found that a mean Fe K EW of around eV for sources which are absorbed by column densities similar to MR 2251-178 (i.e. cm-2). Given that MR 2251-178 is a highly X-ray luminous AGN, the apparent weakness of the Fe K line could be a result to the ‘X-ray Baldwin Effect’ - an apparent anti-correlation between source X-ray luminosity and the Fe K EW, which has been well documented in the literature (e.g. Iwasawa & Taniguchi 1993; Page et al. 2004; Jiang et al. 2006; see also Shu et al. 2010 and Fukazawa et al. 2010). Furthermore, given that MR 2251-178 has a FR I radio morphology, it could also be due to a dilution of the observed X-ray spectrum by a component of X-ray continuum emitted in a radio-jet. The radio-loudness of an object is typically given in terms of the radio-loudness parameter, , defined by
| (1) |
where is the monochromatic radio flux at 5 Ghz and is the optical flux at Å. In this regime, objects where are regarded as radio-loud, while those where are radio-quiet. For MR 2251-178 Reeves & Turner (2000) found that which suggests that any present radio-jet is very weak and unlikely to contribute in the X-ray band.
A further possibility is that the weakness of the Fe K emission may be due to the inner accretion disk being shielded by the outflow. If this is the case, this could also explain the lack of a strong ionised reflection component as the observed reflection would have to originate at distances further from the central engine, i.e. the BLR or the torus. Sim et al. (2010) have also recently shown that Fe K emission can originate via reflection from dense material in an outflowing wind (with EWss of eV), which may also be applicable here. Furthermore, the Fe K EW can also become suppressed in the presence of a sufficiently high-column absorber (e.g. Miller et al. 2010; Yaqoob et al. 2010) such as those found here.
| Soft X-ray 1 | Soft X-ray 2 | S xv | S xvi | Fe L/Fe K | |
|---|---|---|---|---|---|
| (Zone 1) | (Zone 2) | (Zone 3) | (Zone 3) | (Zone 5) | |
| (km s-1) | |||||
| (pc) | 700 | 300 | 30 | 100 | |
| (pc) | 20 | 20 | 0.06 | 0.005 | |
| ( yr-1) | |||||
| (erg s-1) | |||||
| (erg s-1) |
∗Denotes the parameter was fixed at this value.
5.3 The multi-component outflow of MR 2251-178
We have shown that the X-ray spectrum of MR 2251-178 can be adequately modelled with both a fully-covering and an absorption dominated partially-covered interpretation. We find that both of these models require the presence of a number of fully-covering absorbers to account for the observed Fe UTA, Fe L (Fe xxiii-xxiv), S xv, S xvi and Fe xxv-xxvi absorption lines. In this section, we turn our attention to these absorbers and investigate their geometries, kinematics, and, ultimately, estimate their energetic output. For simplicity we consider here the absorbers as per the fully-covering model, and focus on the Fe L absorber as it is likely to be the most energetic given its high . For completeness, however, the methods discussed here were individually applied to all absorbers in the fully-covering model and the results are summarised in Table LABEL:absorbers.
Note that as the parameters of the Fe L absorber are largely invariant between the two continuum models, the results obtained here are applicable to either interpretation and are thus not model dependent.
5.3.1 Distance
The observed column density of a spherically symmetric absorber a distance from the ionising source is equal to the absorber density multiplied by the thickness of the shell of material; i.e. . From the definition of the ionisation parameter, , where is the ionising luminosity between 1-1000 Rydbergs (13.6 eV to 13.6 keV) and is the hydrogen gas density, this then implies that the inner face of the absorber, , is located at
| (2) |
from the central ionising continuum. Assuming that the absorber forms a thin shell where , equation (2) then sets an upper limit on the distance to the inner face of the absorbing material, i.e. . From the best-fit continuum parameters of the fully-covering model, is estimated to be of the order of erg s-1. Therefore, taking cm-2 and characteristic of the Fe L absorber, we find pc.
Assuming that the outflow escapes the system we can set a lower limit on the radial distance by considering the escape radius of the material. For a spherical geometry the radius at which material will be able to escape the BH is given by
| (3) |
with being the gravitational radius. Given that the Fe L absorber has an outflow velocity of c, . This suggests that the outflow may have an origin consistent with an accretion disk wind or the BLR. Indeed, Kaspi et al. (2004) set a lower limit on the size of the BLR in MR 2251-178 of pc ( Rg), which has significant overlap with the upper limit obtained here.
5.3.2 Mass outflow rates
We can also estimate the mass outflow rate. Assuming a quasi-spherical system:
| (4) | |||||
| (5) |
where is the geometrical factor allowing for an outflowing wind subtending sold angle . The parameters of the Fe L absorber suggest that it is capable of expelling yr-1. For comparison, the accretion rate required to maintain the observed radiative bolometric output is:
| (6) |
where is the bolometric luminosity and is the accretion efficiency. With for a Schwarzschild black-hole accreting at maximum efficiency, and adopting a UV-determined bolometric luminosity of erg s-1 (Dunn et al. 2008), we find that the AGN in MR 2251-178 requires an accretion rate of yr-1 to maintain its bolometric radiative output. This is orders of magnitude lower than the estimated mass outflow rate and implies that either, (1) the AGN will exhaust its fuel supply of accreting material over a relatively short timescale in order to maintain an effective mass outflow rate much higher than , or (2) the outflow is not spherical and has a small covering fraction or is rather clumpy (i.e. ). Similar conclusions were also reached by Gibson et al. (2005) in their analysis of the Chandra/HETG observation.
By assuming that we can estimate the clumping/covering factor of the outflow with respect to the central nucleus, i.e. . The resulting inferred covering factors are listed in Table LABEL:absorbers. We note that in principle could be larger than this. However, this estimate allows us to set a conservative lower-limit to the energetics of the outflow in the next section.
5.3.3 Energetics
The kinetic luminosity of the Fe L absorber is:
| (7) |
which implies a conservative mechanical output of erg s-1 for as discussed above. This makes the Fe L absorber the most significant outflowing component in terms of overall energetics, despite its substantial putative clumping. The energetics of the other absorbers are listed in Table LABEL:absorbers.
Assuming that the BH mass grows through accretion alone, we can then estimate a required ‘active phase’ for the QSO as the current estimated BH mass () divided by the accretion rate, i.e. yr. Combining this with the mechanical output calculated previously suggests that the Fe L absorber has an estimated mechanical output of erg over the lifetime of the AGN. This is comparable to the binding energy of a typical galaxy bulge and further supports the premise that such outflows may be energetically significant in AGN/Galaxy feedback scenarios.
6 Summary
We have performed a broad-band spectral analysis of the radio-quiet quasar MR 2251-178 using recent observations from Suzaku and the Swift BAT. Below is a summary of our results:
-
•
The continuum shows considerable curvature above around keV and an apparent soft excess is present below 1 keV. A weak ( eV), unresolved ( eV), Fe K emission line from neutral material is present at keV. The spectral curvature and soft excess can be equally well modelled as an artefact of an absorption dominated, partially covered, continuum or as a fully covered intrinsic continuum component.
-
•
Absorption lines due to the Fe UTA and the Fe L-shell are present below 2 keV. The Fe L line is consistent with being a blueshifted blend of 2s3p transitions from Fe xxiii and Fe xxiv. Two further absorption lines are detected at keV and keV, which we conservatively identify with S xv He and S xvi Ly. For this identification the lines require blueshifted velocities of c and c, respectively. From Montecarlo simulations we find that all soft X-ray absorption lines are significant at the % level.
-
•
We also detect significant ( from MC) absorption in the Fe K band ( keV; rest-frame) which is consistent with the presence of blueshifted Fe xxv-xxvi. A single high turbulence ( km s-1) ionised absorber provides a good fit to both the Fe L-shell line at keV and to a portion of the absorption present in the Fe K band, requiring an outflow velocity of c.
-
•
We derive distances to the absorbers and find that the Fe L absorption may originate at sub-parsec scales, possibly in an accretion disk wind. By balancing the mass outflow and mass accretion rates, we estimate covering fractions (or ‘clumpiness’) and subsequent energetics for all absorbers. The Fe L absorber is consistent with being substantially clumped, by a factor of around , but still dominates in terms of the overall energetics with an estimated kinetic output of erg s-1.
Acknowledgments
The Suzaku X-ray observatory is a collaborative mission between the Japan Aerospace Exploration Agency (JAXA) and the National Aeronautics and Space Administration (NASA). This research has made use of the NASA/IPAC Extragalactic Database (NED) which is operated by the Jet Propulsion Laboratory, Caltech, under contract with the National Aeronautics and Space Administration. We would like to thank the anonymous referee for their comments on this work, and Dean McLaughlin for his numerous helpful suggestions. JG and VB would like to acknowledge support from the UK STFC research council.
References
- [Arnaud(1996)] Arnaud, K. A., 1996, ASPC, 101, 17
- [Baumgartner et al.(2010)] Baumgartner et al., 2010, ApJS, submitted
- [Bautista & Kallman(2001)] Bautista, M. A, & Kallman, T. R., 2001, ApJS, 134, 139
- [Behar et al.(2001)] Behar, E., Sako, M., & Kahn, M. S. 2001, ApJ, 563, 497
- [Bergeron et al.(1983)] Bergeron, J., Bennefeld, M., Boksenberg, A., & Tarenghi, M., 1983, MNRAS, 202, 125
- [Braito et al.(2007)] Braito, V., Reeves, J. N., Dewangan, G. C., George, I., Griffiths, R. E., Markowitz, A., Nandra, K., Porquet, D., Ptak, A., Turner, T. J., Yaqoob, T., & Weaver, K., 2007, ApJ, 670, 978
- [Braito et al.(2011)] Braito, V., Reeves, J. N., Sambruna, R., & Gofford, J., 2011, MNRAS, in press
- [Blustin et al.(2005)] Blustin, A. J., Page, M. J., Fuerst, S. V., Branduardi–Raymont, G., & Ashton, C. E. 2005, A&A, 431, 111
- [Boldt(1987)] Boldt, E., 1987, IAUS, 124, 611
- [Cappi(2009)] Cappi, M., Tombesi, F., Bianchi, S., Dadina, M., Giustini, M., Malaguti, G., Maraschi, L., Palumbo, G. G. C., Petrucci, P. O., Ponti, G., Vignali, C. & Yaqoob, T., 2009; A&A, 504, 401
- [Canizares et al.(1978)] Canizares, C. R., McClintock, J. E., & Ricker, G. R., 1978, ApJ, 226, 1
- [Chartas et al.(2007)] Chartas, G., Eracleous, M., Dai, X., Agol, E., & Gallagher, S., 2007, ApJ, 661, 678
- [Crenshaw et al.(2003)] Crenshaw, D. M., Kraemer, S. B., & George, I. M. 2003, ARA&A, 41, 117
- [Cooke et al.(1978)] Cooke, B. A., Ricketts, M. J., Maccacaro, T., Pye, J. P., Elvis, M., Watson, M. G., Griffiths, R. E., Pounds, K. A., McHardy, I., Maccagni, D., Seward, F. D., Page, C. G., & Turner, M. J. L., 1978, MNRAS, 182, 489
- [Coppi(1999)] Coppi, P. S., 1999, ASPC, 161, 375
- [Czerny & Elvis(1987)] Czerny, B., & Elvis, M., 1987, ApJ, 321, 305
- [Dickey & Lockman(1990)] Dickey, J. M. & Lockman, F. J. 1990, ARA&A, 28, 215
- [Dunn et al.(2008)] Dunn, J. P., Crenshaw, D. M., Kraemer, S. B., & Tripple, M. L., 2008, AJ, 136, 1201
- [Ferrarese & Merritt(2000)] Ferrarese, L., & Merritt, D., 2000, ApJ, 539, 9
- [Fukazawa et al.(2009)] Fukazawa, Y., Mizuno, T., Watanabe, S., Kokubun, M., Takahashi, H., et al., 2009, PASJ, 61, S17
- [Fukazawa et al.(2010)] Fukazawa, Y., Hiragi, K., Mizuno, M., Nishino, S., Hayashi, K., Yamasaki, T., Shirai, H., Takahashi, H., & Ohno, M., astro-ph/1011.1750
- [Ganguly et al.(2001)] Ganguly, R., Charlton, J. C., & Eracleous, M., 2001, ApJ, 556, 7
- [Gebhardt et al.(2000)] Gebhardt, K., Bender, R., Bower, G., Dressler, A., Faber, S. M., Filippenko, A. V., Green, R., Grillmair, C., Ho, L. C., Kormendy, J., Lauer, T. R., Magorrian, J., Pinkney, J., Richstone, D., & Tremaine, S., 2000, ApJ, 539, 13
- [Gibson et al.(2005)] Gibson, R. R., Marshall, H. L., Canizares, C. R., & Lee, J. C., 2005, ApJ, 627, 83
- [Gierliński & Done(2004)] Gierliński, M., & Done, C., 2004, MNRAS, 349, 7
- [Grevesse & Sauval(1998)] Grevesse, N. & Sauval, A. J. 1998, Space Sci. Rev., 85, 161
- [Haardt & Maraschi(1991)] Haardt, F., & Maraschi, L., 1991, ApJ, 380, 51
- [Haardt & Maraschi(1993)] Haardt, F., & Maraschi, L., 1993, ApJ, 413, 507
- [Halpern(1984)] Halpern, J. P., 1984, ApJ, 281, 90
- [Iwasawa & Taniguchi(1993)] Iwasawa, K., & Taniguchi, Y., 1993, ApJ, 413, 15
- [Jiang et al.(2006)] Jiang, P., Wang, J. X., & Wang, T. G., 2006, ApJ, 644, 725
- [Kallman et al.(2004)] Kallman, T. R., Palmeri, P., Bautista, M. A., Mendoza, C., & Krolik, J. H. 2004, ApJS, 155, 675
- [Kaastra et al.(2000)] Kaastra, J. S., Mewe, R., Liedahl, D. A., Komossa, S., & Brinkman, A. C., 2000, A&A, 354, 83
- [Kaspi et al.(2002)] Kaspi, S., Brandt, W. N., George, I. M., Netzer, H., Crenshaw, D. M., Gabel, J. R., Hamann, F. W., Kaiser, M. E., Koratkar, A., Kraemer, S. B., Kriss, G. A., Mathur, S., Mushotzky, R. F., Nandra, K., Peterson, B. M., Shields, J. C., Turner, T. J., & Zheng, W., 2002, ApJ, 574, 643
- [Kaspi et al.(2004)] Kaspi, S., Netzer, H., Chelouche, D., George, I. M., Nandra, K., & Turner, T.J. 2004, ApJ, 611, 68
- [King(2003)] King, A. R., 2003, ApJ, 596, L27
- [King(2010)] King, A. R., 2010, MNRAS, 402, 1516
- [Koyama et al.(2007)] Koyama, K., et al. 2007, PASJ, 59, 23
- [McKernan et al.(2007)] McKernan, B., Yaqoob, T., & Reynolds, C. S. 2007, ApJ, 379, 1359
- [Miller et al.(2007)] Miller, L., Turner, T. J., Reeves, J. N., George, I. M., Kraemer, S. B. & Wingert, B., 2007, A&A, 463, 131
- [Miller et al.(2008)] Miller, L., Turner, T. J., & Reeves, J. N., 2008, A&A, 483, 437
- [Miller et al.(2010)] Miller, L., Turner, T. J., Reeves, J. N., & Braito, V., 2010, MNRAS, 408, 1928
- [Mineo & Stewart(1993)] Mineo, T., & Stewart, G. C., 1993, MNRAS, 262, 817
- [Mitsuda et al.(2007)] Mitsuda, K., et al. 2007, PASJ, 59, 1
- [Monier et al.(2001)] Monier, E. M., Mathur, S., Wilkes, B., & Elvis, M., 2001, ApJ, 559, 675
- [Morrison & McCammon(1983)] Morrison, R., & McCammon, D., 1983, ApJ, 270, 119
- [Nayakshin et al.(2000)] Nayakshin, S., Kazanas, D., & Kallman, T. R., 2000, ApJ, 537, 833
- [Nayakshin(2001)] Nayakshin, S., 2001, AdSpR, 28, 425
- [Netzer(2004)] Netzer, H., 2004, ApJ, 604, 551
- [Orr et al.(2001)] Orr, A., Barr, P., Guainazzi, M., Parmar, A., & Young, A., 2001, A&A, 376, 413
- [Page et al.(2004)] Page, K. L., O’Brien, P. T., Reeves, J. N., & Turner, M. J. L., 2004, MNRAS, 347, 316
- [Pan et al.(1990)] Pan, H. C., Stewart, G. C., & Pounds, K. A., 1990, MNRAS, 242, 177
- [Phillips(1980)] Phillips, M. M., 1980, ApJ, 236, 45
- [Porquet et al.(2004)] Porquet, D., Reeves, J. N., O’Brien, P., & Brinkmann, W., 2004, A&A, 422, 85
- [Pounds et al.(2003)] Pounds, K. A., Reeves, J. N., King, A. R., Page, K. L., O’Brien, P. T., & Turner, M. J. L. 2003, MNRAS, 345, 705
- [Pounds & Reeves(2007)] Pounds, K. A., & Reeves, J. N., 2007, MNRAS, 374, 823
- [Proga & Kallman(2004)] Proga, D., & Kallman, T. R., 2004, ApJ, 616, 688
- [Ramírez et al.(2008)] Ramírez, J. M., Komossa, S., Burwitz, V., & Mathur, S., 2008, ApJ, 681, 965
- [Reeves & Turner(2000)] Reeves, J. N., & Turner, M. J. L., 2000, MNRAS, 316, 234
- [Reeves et al.(2003)] Reeves, J. N., O’Brien, P. T., Ward, M. J., 2003, ApJ, 593, 65
- [Reeves et al.(2009)] Reeves, J. N., O’Brien, P. T., Braito, V., Behar, E., Miller, L., Turner, T. J., Fabian, A. C., Kaspi, S., Mushotzky, R., & Ward, M., 2009, ApJ, 701, 493
- [Reeves et al.(2010)] Reeves, J. N., Gofford, J., Braito, V., & Sambruna, R. M., 2010, ApJ, in press
- [Reynolds(1997)] Reynolds, C. S., 1997, MNRAS, 286, 513
- [Ricker et al.(1978)] Ricker, G. R., Clark, G. W., Doxsey, R. E., Dower, R. G., Jernigan, J. G., Delvaille, J. P., MacAlpine, G. M., & Hjellming, R. M., Nature, 271, 35
- [Risaliti et al.(2005)] Risaliti, G., Bianchi, S., Matt, G., Baldi, A., Elvis, M., Fabbiano, G., & Zezas, A., 2005, ApJ, 630, 129
- [Risaliti et al.(2009)] Risaliti, G., Braito, V., Laparola, V., Bianchi, S., Elvis, M., Fabbiano, G., Maiolino, R., Matt, G., Reeves, J., Salvati, M., & Wang, J., 2009, ApJ, 705, 1
- [Ross & Fabian(2005)] Ross, R. R., & Fabian, A. C., 2005, MNRAS, 358, 211
- [Sim et al.(2010)] Sim, S. A., Proga, D., Miller, L., Long, K. S., & Turner, T. J., 2010, MNRAS, 408, 1396
- [Shakura & Sunyaev(1973)] Shakura, N. I., & Sunyaev, R. A., 1973, A&A, 24, 337
- [Shu et al.(2010)] Shu, X. W., Yaqoob, T., & Wang, J. X., 2010, ApJS, 187, 581
- [Spergel et al.(2003)] Spergel, D. N., et al. 2003, ApJS, 148, 175
- [Takahashi et al.(2007)] Takahashi, T., et al. 2007, PASJ, 59, 35
- [Titarchuk(1994)] Titarchuk, L., 1994, ApJ, 434, 570
- [Tombesi et al.(2010a)] Tombesi, F., Cappi, M., Reeves, J. N., Palumbo, G. G. C., Yaqoob, T., Braito, V., & Dadina, M., 2010, A&A, 521, 57
- [Tombesi et al.(2010b)] Tombesi, F., Sambruna, R. M., Reeves, J. N., Braito, V., Ballo, L., Gofford, J., Cappi, M., Mushotzky, R. F., 2010, ApJ, 719, 700
- [Turner et al.(2008)] Turner, T. J., Reeves, J. N., Kraemer, S. B., & Miller, L., 2008, A&A, 483, 161
- [Turner et al.(2009)] Turner, T. J., Miller, L., Kraemer, S. B., Reeves, J. N., & Pounds, K. A., 2009, ApJ, 698, 99
- [Yaqoob et al.(2010)] Yaqoob, T., Murphy, K. D., Miller, L., & Turner, T. J., 2010, MNRAS, 401, 411
Appendix A Line identifications
The outflow velocities (and resultant energetics) of the absorbers are contingent on the correct identifications of the absorption features. Most of the absorption features detected in the Suzaku spectrum have rest-frame energies which do not correspond to any strong features expected in the X-ray band, and have thus been conservatively identified as being the blueshifted absorption from the strongest expected nearby spectral transition. Here we discuss alternative identifications for these absorption lines.
A.1 Fe xxiv
The observed energy range of the suspected Fe xxiv (2s3p) line, i.e. 1.28-1.30 keV, is populated by an array of high-order transitions from low-abundance elements which makes a rest-frame identification unlikely. For example, the 2sd transitions of Co xviii and Co xx are found in this energy range which can be ruled out based on very low astrophysical abundances (i.e. Co/H ). Indeed, these transitions are also unlikely as they are expected to be very weak in comparison to their lower-order counterparts.
The line at keV is also unlikely to be identified with any blueshifted lines of the expected abundant elements (i.e. O, Ne) without an extreme outflow velocity. Indeed, if identified with H- or He-like Neon (1.02 keV and 0.922 keV, respectively) the outflow velocity would be c. This is much larger than that typically found in AGN warm absorbers (e.g. Blustin et al. 2005). Furthermore, an identification with the 1s2p lines of Na x/xi (1.12 keV and 1.24 keV) is unlikely as such Na absorption has not been reported in even the longest exposure AGN X-ray spectra (e.g. Kaspi et al. 2002).
As an identification with any local 1s2p transition is unlikely, we also considered nearby 2s3p transitions. The most likely 2s3p transition local to the observed 1.29 keV line is that of Fe xxiv at keV. For this identification the line would then require an outflow velocity of c. We note that while the oscillator strengths of the 2s3p lines of Fe XXV (expected at keV) are expected to be higher than those of Fe XXIV in this band, the required outflow velocity assuming this identification ( c) would be incompatible with that obtained from xstar fitting (see §4.1.2).
A.2 S xv/xvi
The lines at keV and keV do not correspond with any expected transitions in the rest-frame. The only transitions which have consistent rest-frame energies are those associated with extremely low abundance elements which are not expected to be observed in the X-ray spectrum (e.g. Kr, Rb, Mo).
The higher energy line is consistent with the 1s3p He-like Sulphur line at keV but such an identification is again unlikely given that at the best-fitting ionisation stage (Table LABEL:final_fcov) H-like Sulphur is expected to be the dominant ion (Kallman & McCray 1982). Furthermore, if the line was caused by the He-like Sulphur 1s3p line, we would still expect to see much stronger 1s2p transitions, which are not present. Thus a origin appears to be ruled out for both of the lines and they are most likely be blueshifted.
The most likely ions in the 2-3 keV energy band which are expected to be strong in the X-rays are He- and H-like Sulphur at keV and keV, respectively. An identification with Silicon (e.g. Si xiv Ly at 2.01 keV) would require a substantially larger soft X-ray outflow velocity c and thus seems unlikely; as does an identification with any lower Z ions for similar reasons.
A.3 Fe xxv/xxvi
While their oscillator strengths suggest that the absorption features between 7-8 keV are most likely Fe xxv/xxvi, several other elements are also expected to have transitions above keV which may interfere with this identification. Most notable of these are H- and He-like Nickel which have 1s2p lines at rest-frame energies of keV and keV, respectively. The observed energy of the absorption feature is consistent with neither of these transitions without significant redshift, however, making an identification unlikely. An identification with lower ionisation Nickel could be plausible but the column densities at which moderately ionised Nickel would be observed are unacceptably high (i.e. cm-2) and with an abundance ratio of Fe/Ni (Grevesse & Suvaul 1998) we would also expect to observe hugely dominant 1s2p Fe transitions, which are not observed. Thus an identification with Ni would appear to be ruled out.
For the tentative high-ionisation Fe K absorber an identification with any ions other than Fe xxvi is unlikely given the high ionisation as Fe xxvi is expected to be the only abundant ions at the best fit ionisation parameter (Kallman et al. 2004). Furthermore, while Zone 5 may be contributing Fe xxiii-xxiv 1s2p lines to the Fe K band, Fe xxv is expected to be the dominant ion at the measured ionisation parameter and we adopt it as our most probable line identification for the contribution of Zone 5 to the Fe K band.