Kepler observations of variability in B-type stars
Abstract
The analysis of the light curves of 48 B-type stars observed by Kepler is presented. Among these are 15 pulsating stars, all of which show low frequencies characteristic of SPB stars. Seven of these stars also show a few weak, isolated high frequencies and they could be considered as SPB/ Cep hybrids. In all cases the frequency spectra are quite different from what is seen from ground-based observations. We suggest that this is because most of the low frequencies are modes of high degree which are predicted to be unstable in models of mid-B stars. We find that there are non-pulsating stars within the Cep and SPB instability strips. Apart from the pulsating stars, we can identify stars with frequency groupings similar to what is seen in Be stars but which are not Be stars. The origin of the groupings is not clear, but may be related to rotation. We find periodic variations in other stars which we attribute to proximity effects in binary systems or possibly rotational modulation. We find no evidence for pulsating stars between the cool edge of the SPB and the hot edge of the Sct instability strips. None of the stars show the broad features which can be attributed to stochastically-excited modes as recently proposed. Among our sample of B stars are two chemically peculiar stars, one of which is a HgMn star showing rotational modulation in the light curve.
keywords:
stars: early-type stars: oscillations1 Introduction
The Kepler mission is designed to detect Earth-like planets around solar-type stars by the transit method (Koch et al., 2010). Kepler will continuously monitor the brightness of over 150 000 stars for at least 3.5 yr in a 105 square degree fixed field of view. In the course of the mission, extremely accurate photometry will be obtained. The mean top-of-the-noise level in the periodogram (which we will call the grass level) for a star of magnitude 10 is about 3 ppm for an observing run of 30 d, dropping to about 1 ppm after one year. For a star of magnitude 12 the corresponding grass noise level is about 6 ppm for one month and 3 ppm after one year. These values apply to a frequency range 0–20 d-1, the noise level dropping slowly towards higher frequencies. With this unprecedented level of precision one might expect to discover new behaviour for many stars.
Stability analyses (Cox et al., 1992; Dziembowski & Pamyatnykh, 1993; Dziembowski et al., 1993) show that an opacity bump due to a huge number of absorption metal lines can destabilize low-order and modes in Cephei stars and high-order modes in slowly-pulsating B (SPB) stars. Driving of pulsations due to the mechanism can only occur if certain criteria are met. One of these criteria is that the pulsation period is of the same order or shorter than the thermal timescale. Otherwise the driving region remains in thermal equilibrium and cannot absorb/release the heat required for driving the pulsations. Another requirement is that the pressure variation is large and varies only slowly within the driving region. This criterion is satisfied for low radial order modes and (in some models) high-order modes with 6 in Cep stars in the iron-opacity bump region. In Cep stars this opacity bump is located in a relatively shallow layer where the thermal timescale is well below 1 d. It turns out that the timescale constraint is fulfilled only for modes of low radial order and for modes with 6 (Dziembowski & Pamyatnykh, 1993). In less massive stars, the iron-opacity bump is located in a deeper layer and, in addition, the luminosity is lower. Both factors contribute to an increase in the thermal timescale. Consequently, all modes are stable because their periods are much shorter than the thermal timescale, while high radial order modes with low fulfill the timescale and pressure amplitude constraints and can now be driven. Thus we find two instability regions among the B stars: the high-luminosity Cep instability strip and the low-luminosity SPB instability strip.
A number of Cep stars, however, show low-frequency pulsations characteristic of SPB stars (see e.g., Le Contel et al., 2001; Chapellier et al., 2006; De Cat et al., 2007; Pigulski & Pojmański, 2008a, b; Handler, 2009). These are known as Cep/SPB hybrids. In general, high radial order modes are heavily damped in B stars of high mass because they have high amplitudes in the deep layers just above the convective core. The temperature variation gradient in this region is very large, leading to significant heat loss and damping of the pulsations. However, the structure of the eigenfunctions plays an important role and for some modes driving in the iron-opacity bump region exceeds damping in the inner layers. Hence some low-frequency modes can occur together with high frequency modes in the same star.
Unfortunately, the modes observed in some Cep stars are usually found to be stable in the models (e.g. Dziembowski & Pamyatnykh, 2008). It is also found that the observed range of instability at high frequencies is wider than can be explained. The problem may be resolved by postulating an overabundance of iron-peak elements in the driving region by up to a factor of four (Pamyatnykh et al., 2004). The use of OP opacities and the recently-revised solar mixture (Asplund et al., 2009) requires a modest 50 percent enhancement of Fe in the iron-opacity bump for Eri models (Zdravkov & Pamyatnykh, 2008). Since there is no observational evidence to suggest that the current metal abundances are in error by that amount, the required opacity enhancement needs the increase in metal abundance to be confined to the iron-opacity bump region. Unfortunately, any enhancement of Fe in this region cannot be hidden and should be detectable in the photosphere (Seaton, 1999). Either a further upwards revision of the opacities is required or some physics is missing from model calculations.
The hybrid stars provide an important test of the models because they probe a very wide frequency range. Hybrid behaviour is more common in models using OP opacities than OPAL opacities (Miglio et al., 2007). This is mainly due to the fact that the metal bump opacity in the OP data occurs at a deeper level where the temperature is about 20 000 K higher than in OPAL. Also, the period gap between Cep stars and SPB stars is expected to decrease as increases (Balona & Dziembowski, 1999). If most of the low-frequency modes in Cep stars have high , it might explain why such modes have low amplitudes which are difficult to detect from the ground but are seen in space observations of these stars (e.g. Degroote et al., 2009b).
In the past, model calculations for Cep and SPB stars have been mostly confined to modes of low spherical harmonic degree, 2. With the precision attainable by space observations, it is expected that modes of much higher values of should be detected. One may therefore expect that the view of Cep/SPB pulsations from space may differ considerably from the view obtained by ground-based observations. This is indeed the case, as will be shown.
The iron-opacity peak also leads to the formation of a small convective zone in the envelope of sufficiently luminous OB stars (Stothers & Chin, 1993). It is often accompanied by an even smaller convective zone due to partial ionization of helium. These convective zones are so thin that they have no influence on the pulsational stability or energy transport. The convection zone due to the iron-opacity bump is more prominent for lower surface gravity, higher luminosity and higher initial metallicity (Cantiello et al., 2009). These thin convective zones may be connected to photospheric turbulence (as seen, for example in the broad spectral lines in O-type stars), spectral line variability, wind clumping and the generation of a magnetic field.
In this context, one of the most interesting and important results is that obtained from CoRoT observations of the Cep star HD 180642 (V1449 Aql). In addition to a bulk of coherent modes with stable amplitudes, broad structures in the frequency range 9–22 d-1 were detected (Belkacem et al., 2009). These structures have been suggested to be modes with short lifetimes which are stochastically excited in a thin convective envelope. In addition, CoRoT observations of the O-type star HD 46149 reveal a pattern characteristic of stochastic oscillations, which are predicted to be similarly excited as in B stars due to thin convective layers in the envelope (Degroote et al., 2010). With the outstanding precision of Kepler observations, it is possible to search for the presence of stochastically-excited modes in a larger sample of early B-type stars.
Finally, of course, there is the prospect for uncovering hitherto unsuspected types of variability among B stars. While it is not possible to deduce the nature of stars solely from an analysis of the light curves, one may obtain some clues by classifying stars into similar groups from which a common mechanism may, with further observations, be deduced. In this paper we confirm some of the results obtained by CoRoT (Degroote et al., 2009a), though testing of our speculations must await further observations.
In this paper we review the photometric variability of all Kepler Asteroseismic Science Consortium (KASC) targets that were identified as main sequence B-type stars. The paper is organized as follows. Section 2 describes the selection of B-type stars from the Kepler photometry database. Section 3 shows how stellar parameters were derived for the selected sample. Section 4 describes the time-series analysis followed by a presentation and review of the different types of variability among the selected sample (Section 5). In Section 6 we discuss the SPB and Cep variables that have been identified and compare their properties with models. The issue of stochastically-excited modes in early B-type stars is discussed in Section 7.
2 Selection of main-sequence B-type stars
Main sequence B-type stars (MSB stars) are members of Population I which are confined to the Galactic disk. Consequently, very few such stars are expected to be located at distances larger than about 100 pc above and below the Galactic plane. The Kepler field of view lies within Galactic latitudes 6 20. A mid-B star with an apparent magnitude of 10 mag at these latitudes will be about 600 pc above the Galactic plane at a distance of about 4 kpc. Clearly, only the nearest and brightest B stars are expected to be included in the Kepler field of view. Only some of the brightest stars in this field have been observed spectroscopically, which makes it very difficult to select the MSB stars.
Fortunately, in preparation for the mission, Sloan Digital Sky Survey (SDSS)-like , D51 (510 nm) and 2MASS photometry was obtained for most stars (Batalha et al., 2010). Effective temperatures, surface gravities and radii derived from this photometry are included in the Kepler Input Catalogue (KIC) 111http://archive.scsi.edu/kepler.. It should be noted that the above filters do not include the Balmer-jump band which is essential for the characterization of hot objects. Since effective temperatures are crucial for selecting B-type stars, we plotted the effective temperatures for stars with known spectral types to test the validity of the KIC calibration. The results shown in Fig. 1 indicate that the KIC temperatures are not very reliable for B stars and are usually largely underestimated (see also Molenda-Żakowicz et al., 2010; Lehmann et al., 2010). The recently released GALEX database (http://galex.stsci.edu/GR6/) can also be useful in distinguishing between B-type and later stars, although there is, as yet, few matches with B stars in the Kepler field (see also Section 3.2.2).

In order to maximize our chances of finding main sequence B-type stars in the Kepler database, we used the following selection criteria: (i) all stars classified as B type in the HD or other catalogues and (ii) all stars with effective temperatures greater than 10 000 K in the KIC. This was supplemented by recent spectroscopic investigations of stars in the Kepler field, such as those of Lehmann et al. (2010) and Catanzaro et al. (2010). These selection criteria will inevitably lead to the inclusion of hot compact stars, mainly hot subdwarfs and white dwarfs. We therefore used the list of compact objects compiled by Østensen et al. (2010) and eliminated all objects that were classified by these authors as non-main sequence stars. Several objects were excluded because their effective temperature derived by Lehmann et al. (2010) appeared to be smaller than 10 000 K. These criteria resulted in a list of 72 presumably MSB stars.
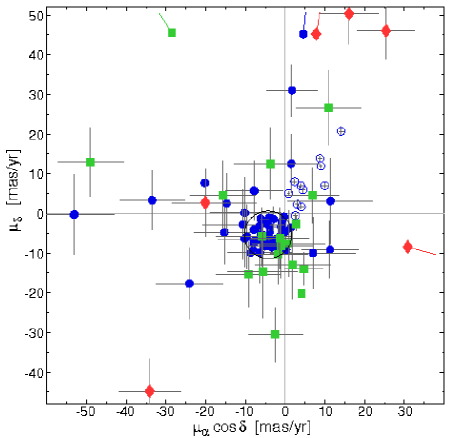
Proper motions can be used to further refine our sample of stars. We used proper motions from the UCAC3 catalogue (Zacharias et al., 2009) to identify and exclude probable non-MSB stars. All but seven stars in our sample are listed in this catalogue. Fig. 2 shows the location of the selected stars in the proper-motion diagram. As can be seen from the figure the MSB stars, especially the brightest stars (with small error bars), form a well-defined clump centered at , ) (4.3,5.4) mas yr-1. The center of the clump is consistent with the average proper motion of the young population in the direction of the Kepler field of view as can be judged from proper motions of open clusters (Kharchenko et al., 2003). However, there is a sample of eleven bright stars, shown with open circles in Fig. 2, which fall well outside the clump but are classified as main sequence B8 or B9 stars. Their magnitudes and proper motions are consistent with membership of the Gould Belt which happens to cross the Kepler field of view (see Elias et al., 2009, and references therein).
The three groups of hot stars we are considering here (MSB stars, hot subdwarfs and white dwarfs) show different spreads in proper motions (Fig. 2). In particular, white dwarfs have the largest proper motions. The proper motions of hot subdwarfs are smaller, but still larger than for MSB stars. However, proper motions alone are not sufficient to distinguish between the three groups. For example, some hot subdwarfs are to be found among the clump of MSB stars in Fig. 2. Statistically, the larger the proper motion, the nearer the star. We may therefore use proper motion, , as an approximate indicator of the distance, . From this, we may define a quantity which is related to the absolute magnitude. This is useful because it is the absolute magnitude which best discriminates between the three groups of stars.
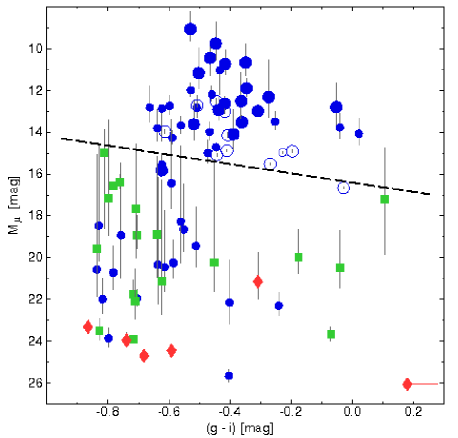
We may define a parameter as an indicator of the absolute magnitude of a star:
where is a Sloan-like magnitude taken from the KIC catalogue and is the difference in proper motion from the center of the clump in Fig. 2. In order to avoid singularity in calculating , the lower limit for was set to 1 mas yr-1. The definition of is a slight modification of the parameter called “reduced proper motion” by Østensen et al. (2010) for a similar purpose. A plot of as a function of the index from the KIC is shown in Fig. 3. It can be seen that the three groups are quite well separated by . In particular, the dashed line in Fig. 3 separates MSB stars (above the line) from hot subdwarfs (below the line). The separation is verified by the location of MSB stars with good MK spectral classification which we know are certainly not compact objects (larger symbols in Fig. 3). Stars belonging to Gould Belt have different proper motions and are located far from the clump of MSB stars in Fig. 2. It is therefore not surprising that they might have a larger and indeed, KIC 11973705 which is a known MSB star (see Table 1), lies on the fringe of the Gould Belt distribution and below the dashed line. The spectrum of KIC 12258330, another star below the line, shows that it is an MSB star (Table 1).
All stars falling below the dashed line in Fig. 3 except for these two stars were excluded from our sample as they are unlikely to be MSB stars. In addition, we excluded seven very faint stars with magnitudes in the range 14.5–17.0 mag which do not have proper motions in the UCAC3 catalogue. It is unlikely they are MSB stars as they would lie at a very great distance from the Galactic plane. We are then left with a sample of 48 MSB stars for detailed frequency analysis. These stars are listed in Table 1. We have to stress, however, that even though the selection of our target stars was done in a consistent way, we cannot exclude the possibility that some MSB stars might have been overlooked.
| KIC | 2MASS | SC | LC | a | a | Classification | Sp. type | Notes | |
|---|---|---|---|---|---|---|---|---|---|
| number | number | [d] | [d] | [mag] | [mag] | [mag] | |||
| 3240411 | 19310672+3819417 | 9.7 | 322.1 | 10.08 | — | — | Hybrid | B2 V b | |
| 3756031 | 19350581+3852500 | — | 321.6 | 9.86 | 0.47 | 10.44 | SPB + Sct? | B5 V-IV b | |
| 3839930 | 19130682+3859204 | — | 321.6 | 10.68 | 0.51 | 12.82 | SPB | — | |
| 3848385 | 19233702+3859363 | — | 44.4 | 8.86 | 0.35 | 10.65 | Rot + ? | B8 V c | GALEX mags. |
| 3865742 | 19411999+3856436 | — | 321.6 | 10.96 | 0.43 | 11.03 | FG | B | |
| 4276892 | 19400775+3920382 | 25.9 | 44.4 | 9.06 | 0.35 | 11.89 | Bin + ? | B8–A0 d | SB1? d, FUV GALEX mag. |
| 4581434 | 19455619+3939557 | 30.0 | 33.4 | 9.12 | 0.20 | 14.90 | Bin/Rot | B9–A5 d | SB1 d |
| 5130305 | 19563429+4014532 | — | 321.6 | 10.07 | 0.36 | 13.51 | Rot | B9 IV-V b | |
| 5217845 | 19555093+4023268 | — | 321.6 | 9.35 | 0.27 | 12.32 | Bin + Rot | B8.5 III b | binary b |
| 5304891 | 19551942+4029573 | 30.0 | 44.4 | 9.07 | 0.31 | 12.98 | Rot | B4–B8 d | |
| 5458880 | 19390756+4037365 | 28.9 | 311.1 | 7.63 | 0.53 | 9.05 | Bin/Rot | B0 III e, B0.5 II f | |
| 5479821 | 19572477+4038084 | — | 321.6 | 9.74 | 0.42 | 12.63 | Bin + Rot/? | B5.5 V b | |
| 5786771 | 19214208+4105482 | 30.0 | 44.4 | 9.01 | 0.41 | 14.13 | Rot | B9–A5 d | |
| 6128830 | 19334968+4128452 | 28.9 | 44.4 | 9.09 | 0.46 | 12.19 | Rot | B6 HgMn d | |
| 6954726 | 19344680+4226081 | — | 321.6 | 11.72 | 0.52 | 13.62 | FG | Be g,h | Be star, StH166 |
| 7599132 | 19155121+4312084 | 33.4 | 321.6 | 9.22 | 0.44 | 15.08 | Bin | B8.5 V b | |
| 7974841 | 19463656+4345480 | 27.1 | 44.4 | 8.05 | 0.41 | 14.88 | Rot/SPB | B8 V i | |
| 8018827 | 19115652+4353258 | 33.4 | — | 7.90 | 0.45 | 12.52 | Rot | B9 j | FUV GALEX mag. |
| 8057661 | 20001799+4349558 | — | 321.6 | 11.62 | 0.05 | 12.80 | Hybrid | OBH k | Be star, KW97 41-38 |
| 8087269 | 19110975+4359571 | 30.0 | 321.6 | 11.94 | 0.47 | 14.99 | FG | GALEX mags. | |
| 8161798 | 19213515+4403022 | — | 321.6 | 10.33 | 0.44 | 12.94 | Bin | B8 j | GALEX mags. |
| 8177087 | 19422573+4401183 | 33.4 | 311.1 | 7.90 | 0.50 | 11.16 | SPB | B5 V i, B7 III b | |
| 8324268 | 19565014+4416159 | — | 311.1 | 7.81 | 0.42 | 13.00 | Rot | B9 V f, B8p Si l | V2095 Cyg, CVn star |
| 8351193 | 19012177+4423115 | 30.3 | 33.4 | 7.40 | 0.51 | 12.73 | Rot | B9 V i | |
| 8381949 | 19484697+4421208 | — | 321.6 | 10.97 | 0.36 | 12.51 | Hybrid | OB | |
| 8389948 | 19565533+4420307 | 31.1 | 321.6 | 9.13 | 0.27 | 15.52 | Rot | B9.5 V-IV b | |
| 8459899 | 20021338+4426469 | 30.7 | 44.4 | 8.58 | 0.42 | 10.73 | SPB | B2 III f, B4.5 IV b | SB2? b |
| 8488717 | 19172024+4433508 | — | 321.6 | 11.62 | 0.39 | 14.09 | Rot/Bin | B9 j | |
| 8692626 | 19324040+4452514 | 30.0 | 44.4 | 8.27 | 0.23 | 14.96 | Rot + ? | [B9] m | |
| 8714886 | 19591018+4451448 | — | 321.6 | 10.86 | 0.25 | 13.49 | Hybrid/FG | GALEX mags. | |
| 8766405 | 19455212+4455071 | 33.4 | 321.6 | 8.71 | 0.45 | 9.74 | FG | B5 V f, B7 III b | SB2? b |
| 9655433 | 19372486+4618390 | — | 311.1 | 11.93∗ | — | — | Sct | A3: n, B7 o | NGC 6811 #114, B66 |
| 9716301 | 19371376+4625257 | 27.1 | 321.6 | 11.68 | 0.02 | 14.07 | FG | A3 n, B9 o | NGC 6811 #34, B22 |
| 9716456 | 19372852+4624183 | — | 321.6 | 12.00 | 0.04 | 13.77 | Bin + Rot | A1 n, B9 o | NGC 6811 #99, B29 |
| 9964614 | 19480282+4653445 | — | 321.6 | 10.70 | 0.45 | 14.72 | Hybrid | — | |
| 10130954 | 19102372+4709441 | 9.7 | 322.1 | 10.85 | 0.66 | 12.81 | Bin/Rot | B p | FUV GALEX mag. |
| 10285114 | 19440272+4721169 | 9.7 | 322.1 | 10.99 | 0.59 | 14.27 | FG | B p | |
| 10536147 | 19291192+4744430 | 322.1 | 322.1 | 11.33 | 0.64 | 13.81 | Hybrid | — | |
| 10658302 | 19150768+4754190 | 30.7 | 44.4 | 12.86 | 0.62 | 12.86 | SPB/FG | B p | GALEX mags. |
| 10797526 | 19274936+4810363 | 110.2 | — | 8.09 | 0.61 | 13.96 | SPB | OB | |
| 10960750 | 18522875+4824141 | 27.1 | 321.6 | 9.67 | — | — | Hybrid | B4 V: r, B2.5 V b | SB1? d |
| 11360704 | 19460296+4907596 | — | 321.6 | 10.51 | 0.56 | 13.68 | FG | — | |
| 11454304 | 19252435+4918562 | 9.7 | 33.4 | 12.69 | 0.62 | 15.55 | SPB | B p | GALEX mags. |
| 11817929 | 19353836+5002354 | 9.7 | 33.4 | 10.15 | 0.60 | 12.74 | cst | B p | |
| 11973705 | 19464258+5021013 | 9.7 | 322.1 | 9.15 | 0.03 | 16.67 | Bin + SPB + Sct | B8.5 V-IV b | SB2 b, Sct |
| 12207099 | 19221039+5048401 | — | 321.6 | 10.11 | 0.47 | 13.99 | Bin | B9 III-II b | SB2? b, GALEX mags. |
| 12217324 | 19440458+5053578 | 30.0 | 44.4 | 8.10 | 0.53 | 11.98 | Rot | A0 m | |
| 12258330 | 19255755+5054033 | 30.7 | 321.6 | 9.25 | 0.62 | 15.82 | FG | B5 V r, B5.5 V-IV b |
Source of information:
a KIC,
b Lehmann et al. (2010),
c Sato & Kuji (1990),
d Catanzaro et al. (2010),
e Guetter (1968),
f Hill & Lynas-Gray (1977),
g Stephenson (1986),
h Downes & Keyes (1988),
i Bartaya (1983),
j MacRae (1952)
k Hardorp et al. (1964),
l Grenier et al. (1999),
m HD catalogue,
n Becker (1947),
o Lindoff (1972),
p Østensen et al. (2010),
q Svolopoulos (1969),
r Dworetsky et al. (1982),
Note: ∗ Kepler magnitude.
3 Determination of fundamental parameters
| Spectroscopy | Strömgren photometry | SED fitting | ||||||
| KIC | Teff | (cgs) | Teff | (cgs) | Teff | |||
| number | [K] | [dex] | [km s-1] | [K] | [dex] | [K] | [mag] | [dex] |
| 3240411 | 20 980(880) a | 4.01(12) a | 43(5) a | 20 550 | 3.94 | 21 000(8 800) | 0.09(10) | 3.56 |
| 3756031 | 15 980(310) a | 3.75(6) a | 31(4) a | 16 310 | 4.19 | 16 000(1 600) | 0.10(3) | 3.21 |
| 3839930 | 16 500 c | 4.2 c | — | 17 160 | 4.51 | 18 200(7 000) | 0.10(9) | 2.75 |
| 3848385 | — | — | — | 11 680 | 3.76 | 12 200(800) | 0.13(3) | 2.37 |
| 3865742 | 19 500 c | 3.7 c | 133(10) d | 20 190 | 4.20 | 19 400(1 800) | 0.17(2) | 3.76 |
| 4276892 | 10 800(600) b | 4.1(2) b | 10 b | 9 510 | 4.21 | 10 400(600) | 0.11(4) | 1.87 |
| 4581434 | 10 200(200) b | 4.2(2) b | 200 b | 9 130 | 4.43 | 10 200(2 200) | 0.17(17) | 1.62 |
| 5130305 | 10 670(200) a | 3.86(7) a | 155(13) a | 10 190 | 4.38 | 11 000(600) | 0.11(3) | 2.13 |
| 5217845 | 11 790(260) a | 3.41(10) a | 237(16) a | 11 740 | 3.76 | 12 000(600) | 0.19(2) | 2.92 |
| 5304891 | 13 100(700) b | 3.9(2) b | 180 b | 11 530 | 3.81 | 11 800(600) | 0.14(2) | 2.56 |
| 5458880 | — | — | — | 24 070 | 3.18 | 27 600(5 400) | 0.18(5) | 4.65 |
| 5479821 | 14 810(350) a | 3.97(9) a | 85(8) a | 17 580 | 4.43 | 17 600(3 400) | 0.16(5) | 2.76 |
| 5786771 | 10 700(500) b | 4.2(2) b | 200 b | 9 630 | 4.39 | 10 600(1 000) | 0.06(6) | 1.73 |
| 6128830 | 12 600(600) b | 3.5(3) b | 15 b | — | — | — | 2.96 | |
| 6954726 | — | — | 160 d | — | — | — | — | |
| 7599132 | 11 090(140) a | 4.08(6) a | 63(5) a | 10 560 | 4.39 | 11 600(2 200) | 0.13(11) | 1.95 |
| 7974841 | — | — | — | 10 820 | 4.41 | 11 800(1 200) | 0.13(5) | 1.85 |
| 8018827 | — | — | — | 10 410 | 4.37 | 11 200(1 000) | 0.10(5) | 1.79 |
| 8057661 | — | — | 49(5) d | 21 360 | 4.23 | 20 600(2 800) | 0.40(3) | 3.55 |
| 8087269 | 14 500 c | 3.9 c | 271(10) d | — | — | — | 2.80 | |
| 8161798 | 12 300 c | 4.0 c | — | 12 460 | 4.61 | 12 200(800) | 0.08(3) | 2.29 |
| 8177087 | 13 330(220) a | 3.42(6) a | 22(2) a | 13 380 | 3.79 | 13 400(1 000) | 0.10(3) | 3.20 |
| 8324268 | — | — | — | 14 330 | 4.46 | 14 400(2 000) | 0.12(4) | 2.47 |
| 8351193 | — | — | — | 10 210 | 4.61 | 11 000(400) | 0.02(2) | 1.64 |
| 8381949 | 24 500 c | 4.3 c | — | 21 000 | 3.82 | 22 400(7 400) | 0.24(7) | 3.61 |
| 8389948 | 10 240(340) a | 3.86(12) a | 142(12) a | 9 690 | 4.33 | 10 400(1 800) | 0.16(13) | 2.03 |
| 8459899 | 15 760(240) a | 3.81(5) a | 53(4) a | 15 950 | 4.09 | 16 000(2 000) | 0.14(4) | 3.10 |
| 8488717 | 11 000 c | 4.0 c | — | 10 160 | 4.44 | 11 200(1 400) | 0.10(7) | 2.03 |
| 8692626 | — | — | — | 9 826 | 4.71 | 9 400(1 200) | 0.12(12) | 1.52 |
| 8714886 | 19 000 c | 4.3 c | — | 18 505 | 4.49 | 18 000(3 400) | 0.26(5) | 2.98 |
| 8766405 | 12 930(220) a | 3.16(8) a | 240(12) a | 14 050 | 3.74 | 14 400(1 800) | 0.11(4) | 3.46 |
| 9964614 | 20 300 c | 3.9 c | — | 19 471 | 3.75 | 23 400(7 400) | 0.14(10) | 3.61 |
| 10130954 | 19 400 c | 4.0 c | — | 18 663 | 3.96 | 19 600(5 200) | 0.05(6) | 3.38 |
| 10285114 | 18 200 c | 4.4 c | — | 16 229 | 4.16 | 16 400(4 200) | 0.07(7) | 2.76 |
| 10536147 | 20 800 c | 3.8 c | 195(10) d | — | — | — | 3.79 | |
| 10658302 | 15 900 c | 3.9 c | — | — | — | — | 3.02 | |
| 10797526 | — | — | — | 20 873 | 3.22 | 23 600(5 600) | 0.13(5) | 4.15 |
| 10960750 | 19 960(880) a | 3.91(11) a | 253(15) a | 20 141 | 3.85 | 21 800(8 000) | 0.06(8) | 3.56 |
| 11360704 | 20 700 c | 4.1 c | — | 17 644 | 3.89 | 18 200(5 400) | 0.11(7) | 3.66 |
| 11454304 | 17 500 c | 3.9 c | — | — | — | — | 3.25 | |
| 11817929 | 16 000 c | 3.7 c | — | 12 732 | 4.02 | 13 000(1 800) | 0.02(5) | 3.28 |
| 11973705 | (11 150) a | (3.96) a | 103(10) a | 11 898 | 4.25 | 11 800(3 800) | 0.31(26) | (2.11) |
| 12207099 | 11 000 a | 3.1 a | 43(5) a | — | — | — | (3.17) | |
| 12217324 | — | — | — | 10 192 | 4.23 | 11 000(600) | 0.03(3) | 1.81 |
| 12258330 | 14 700(200) a | 3.85(4) a | 130(8) a | 16 436 | 4.35 | 16 600(3 400) | 0.05(6) | 2.89 |
Stellar parameters are required in order to place the stars of Table 1 in the theoretical HR diagram. We cannot use the KIC parameters for reasons already discussed, but fortunately more reliable values of the effective temperature, Teff, and surface gravity, , may be derived from spectroscopy (Section 3.1). Narrow-band photometry can also be used to derive the effective temperatures and luminosities (Section 3.2). In addition, spectroscopic observations allow estimates of the projected rotational velocity, , which can be used as a constraint in the interpretation of Kepler light curves.
3.1 Spectroscopy
In columns 2, 3 and 4 of Table 2, we give Teff, and , respectively, as derived from spectroscopic follow-up observations. The entries include the published results of Lehmann et al. (2010) and Catanzaro et al. (2010). New spectral classifications for some objects were also obtained with the B&C spectrograph using a 400/mm grating ( 550, 362–690 nm) attached to the Bok telescope at Kitt Peak observatory. These observations were done on June 14–16 and July 28–30, 2008. The Teff and were derived by fitting model atmosphere grids to the hydrogen and helium lines visible in the spectra as described by Østensen et al. (2010). Metal-line blanketed LTE models of solar composition as described in Heber et al. (2000) were used. Formal fitting errors on Teff and are about 200 K and 0.05 dex respectively, while the systematic errors are probably about 5 percent for both parameters. Because of the low spectral resolution, the projected rotational velocity could not be determined and 0 was assumed during the fitting procedure.
For five targets (KIC 3865742, 6954726, 8057661, 8087269 and 10536147), at least one high-resolution spectrum ( 81 000, 370–1000 nm) was obtained with the Echelle SpectroPolarimetric Device for the Observation of Stars (ESPaDOnS) attached to the Canada-France-Hawaii Telescope (CFHT) at Mauna Kea (Hawaii) on 2010 July 25, 31 and 2010 August 4. The Kepler light curves of the majority of these objects show characteristics similar to those of Be stars (cf. Section 5.3). Apart from the confirmed Be star KIC 6954726, none of these stars showed emission lines. These spectra were used only to derive a value by applying the Fourier transform method to the He I, Mg II and Si III lines (Gray 1982, see also Simón-Díaz & Herrero 2007 for a recent application to OB-type stars). A full analysis of these spectra, together with a detailed analysis of their Kepler light curves, will be presented elsewhere (Gutiérrez-Soto, in preparation).
3.2 Photometry
3.2.1 Strömgren photometry
Standard Strömgren-Crawford photometry was obtained with the 2.1-m telescope at McDonald Observatory. A standard two-channel photoelectric photometer was used in 2010 August/September in single-channel mode. Apertures of 14.5 and 29′′ were used depending on the brightness of the target and sky background. As the filter wheel can only hold four filters at once, measurements were obtained at different times from observations.
A set of standard stars, selected to span the whole parameter range of the targets in terms of , , , and , were observed for transforming the measurements into the standard system. Transformation equations, used in the context of a larger observing program, were adopted from Handler (2010, in preparation). To maximize the number of objects for which stellar parameters can be estimated, we applied the calibration of Balona (1994) to the de-reddened Strömgren data to obtain Teff and (see columns 5 and 6 in Table 2). As can be seen from Table 2, the results are, for the most part, in good agreement with the spectroscopic values.
3.2.2 Spectra energy distribution (SED) fitting
Values for Teff were determined by fitting Kurucz (1993) model atmospheres with solar metallicity to the combined set of SDSS, 2MASS and Strömgren colours. The calibration zero points for Strömgren and SDSS were derived from the dedicated Vega model from Castelli & Kurucz (1994) and the 2MASS zero points were taken from Cohen et al. (2003). Wherever possible, the photometry was extended with values from Droege et al. (2006), Ofek (2008) and Thompson et al. (1978). A grid search was performed, within the effective temperature range 8 000–30 000 K in steps of 200 K and the surface gravity range between 3.5 and 4.5 dex (cgs), in steps of 0.25 dex. For each combination of Teff and , the model atmosphere was reddened according to the reddening law of Cardelli et al. (1989) using 3.1. The colour excess, , was determined by an iterative procedure using minimization. The confidence interval for Teff was chosen to encompass all values for which was below twice the minimal value. Equal weights were given to all data points in the minimization procedure. The value for cannot be obtained by this method.
We tried to make additional use of the near- and far-ultraviolet photometry from the Galaxy Evolution Explorer satellite (Martin et al., 2005). The GALEX satellite was designed to image light from faint moderate- and high-galactic latitude objects in both near- and far-UV (NUV and FUV, respectively) imaging cameras by means of a beam-splitter. The latest General Release (GR6) delivery to the Multi-Mission Archives at Space Telescope Science Institute (MAST)222Support for the MAST is provided by NASA through a grant from the Space Telescope Science Institute, which is operated by the Association of Universities for Research in Astronomy, Inc., under NASA Contract NAS5-26555. in 2010 showed an overlap of some 60 percent of the Kepler field of view (FOV), which is far more than was delivered in previous releases. The GALEX GR6 catalog were cross-matched with KIC stars at MAST for coordinate separations of less than 2.5 arcsec on the sky, resulting in FUV and/or NUV magnitudes for ten targets in Table 1. The SED fitting was redone including these GALEX magnitudes but did not lead to better results. Although GALEX-determined colours hold out great promise for differentiating among hot stars in the Kepler field, so far only explorations have been carried out to calibrate spectral types (Bianchi et al., 2007). Unfortunately, these are insufficient for our purposes.
3.3 Luminosity
From the definition of surface gravity, and eliminating the radius using the luminosity and effective temperature, we have
High-dispersion spectroscopy gives values of and , but we need in this formula to calculate the luminosity. To do this, we used the relationship expressing in terms of , and [Fe/H] in Torres et al. (2010) (setting [Fe/H] 0.0). Since the values of Teff and as derived from the spectra are probably more accurate than those obtained from the Strömgren/Balona calibration and SED fitting, the values were derived from the spectroscopic determinations where possible. Failing this, values determined from photometry and the Balona (1994) calibration were used. The adopted values of are given in the last column of Table 2. As mentioned before, the spectroscopic and photometric values are in good agreement.
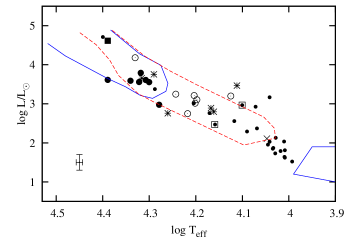
Comparison of the resulting positions in the HR-diagram with known Cep and SPB stars and with the instability strips for modes of low and high degree is shown in Fig. 4.
4 Data and frequency analysis
Following each quarter of a 370-d Kepler solar orbit, the telescope is
rolled to keep its solar panels facing the Sun. Choices and changes of targets are
made on the basis of these “quarters”. Most data are obtained in long cadence
(LC) with integration times of 29.4 min. For 512 targets data are obtained in
short cadence (SC) mode with sampling times just under 1-min. Characteristics of
LC mode are described in Jenkins et al. (2010b) and characteristics of SC
mode in Gilliland et al. (2010). An overview of the Kepler science processing
pipeline is given by Jenkins et al. (2010a). The duration of the quarters are as follows:
Q0: 10 days (2009 May 2–2009 May 11),
Q1: 33 days (2009 May 13–2009 June 15),
Q2: 89 days (2009 June 19–2009 September 16),
Q3: 89 days (2009 September 18–2009 December 16),
Q4: 90 days (2009 December 19–2009 March 19).
These observations provide a unique opportunity to study the incidence of pulsation at the lowest amplitude levels. The median noise level, , in the periodogram depends on the stellar magnitude, , and on the duration of the run, . We find that a relation of the form:
where describes the median noise level of the Kepler periodograms quite well. A more practical measure of detection threshold, however, is the level of the top-of-the-peaks in the periodogram (the grass level), which is approximately equal to (3–4). For our sample of B stars and full Q0–Q4 coverage this detection threshold is typically equal to about 1 ppm for the brightest stars and about 15 ppm for the faintest.
In order to determine whether a peak in the periodogram is significant requires the calculation of a false alarm probability (FAP) which is related to the periodogram noise level. A determination of the FAP, strictly valid only for equally-spaced data, was obtained by Scargle (1982). Scargle’s FAP requires the existence of a set of frequencies at which the periodogram powers are statistically independent. The existence of these is guaranteed only when the data are evenly spaced in time. Although the Kepler data are almost consistently evenly spaced, the time series is interrupted for scheduled spacecraft rolls. Further, observations of individual stars will contain odd outlier points that need to be eliminated before calculating the periodogram. Inspection of quarters Q2–Q4 of the Kepler data (see below) show that approximately 5 percent of the evenly-spaced data set is lost in this way. The conditions required for Scargle’s FAP are therefore not strictly met.
Even if the Scargle conditions had been met, Scargle’s method would require us to calculate the periodogram power only at the natural frequencies. This restricts candidate pulsation frequencies to the Scargle grid. The resolution of this grid is much poorer than that allowed by the length of the Kepler data set, sacrificing precision in the pulsation spectrum. Preliminary determinations of the pulsation spectra of the stars discussed in this paper show a large number of very closely spaced frequencies. The restriction imposed by the Scargle method is thus excessively debilitating in this case.
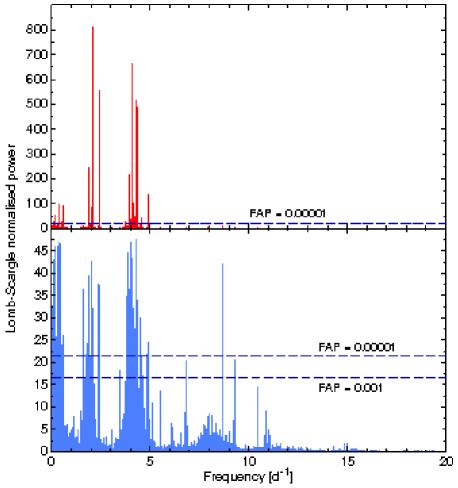
Frescura et al. (2008) showed that when the FAP is determined by Monte Carlo methods, independent frequencies are not needed, allowing the periodogram to be sampled on arbitrary frequency grids. They also showed that oversampling of the periodogram in the frequency domain has no deleterious effect on frequency determination. We computed FAPs for Kepler quarters Q2–Q4, using the methods detailed in Frescura et al. (2008). The FAPs determined by this method are shown in the bottom panel of Fig. 5, where they have been superimposed on a heavily prewhitened periodogram (with 40 frequencies) of KIC 11360704 for illustrative purposes. The non-prewhitened periodogram for this star is shown in the top panel of Fig. 5. In this figure, the two lowest FAP levels lie so close to the frequency axis in this plot that they can not be usefully displayed. The FAP levels can therefore be more clearly seen when plotted in Fig 5, lower panel. This shows the extremely high statistical significance of practically all the visible peaks in the top panel of Fig. 5, and of many dozens of peaks still present in the lower panel of Fig. 5. A detailed analysis of the statistical properties of the Kepler data is in preparation and will be published separately.
The data used here are from the short commissioning run (Q0) and the first four quarters (Q1–Q4). Data for some stars are available for all these runs, a total observing duration of over 320 d in long cadence. Periodograms using the long-cadence data have far better resolution and are more useful in determining the frequencies and amplitudes. SC observations were mostly used to search for frequencies above 24.5 d-1, the Nyquist frequency for the LC data. We did not find frequencies higher than the long-cadence Nyquist frequency in any star except for KIC 11973705. The duration of the observing run for each star in short- or long-cadence mode is indicated in columns 3 and 4 of Table 1.
The MAST Kepler archival database provides for corrected and uncorrected data. We used both corrected and uncorrected data, depending on a star and the observing quarter. Before the data were subjected to an analysis of the frequencies, the time sequence was examined and corrected for trends and discontinuities in the light curve. To a large extent this is an automated procedure in which a smooth curve is fitted to the time series and residuals examined for systematic departures indicative of discontinuities. At the same time, points which are clearly outliers are rejected. While this automated procedure worked satisfactorily in most cases, the data corrected in this way were visually examined and the corrections done by hand if deemed unsatisfactory. Owing to various instrumental effects, such as aperture changes, sudden pointing deviations, long-term drifts and many other effects, the data contain signals which do not belong to the star. Some of the signals lead to characteristic peaks in the periodogram which have been tabulated by the Kepler team and are well-known. Nevertheless, the behaviour at low frequencies is still poorly understood. In analyzing these data, we take the view that frequencies below about 0.2 d-1 should be regarded with suspicion.
It should be noted that while these corrections are often subjective in nature, they only affect the low frequency range. Frequencies above 0.5 d-1 are hardly affected at all by the corrections and comparison of frequencies done independently by different authors are in good agreement. One might also question the level at which a certain peak is deemed to be significant. In some analyses the Lomb-Scargle false alarm criterion (Scargle, 1982) was set to some level, above which peaks are regarded not to be significant. In others, the local signal-to-noise level was calculated and the peak deemed significant only if it exceeds a certain factor. These decisions do not affect the periodogram, but only the set of frequencies which are thought to be real. In this paper, the frequencies we will be discussing are certainly significant by any criterion.
Characteristic frequency spacings in the periodogram, if they exist, clearly provide information about the star. In order to detect characteristic frequency spacings we calculated histograms of all possible frequency separations between unique frequency pairs after the frequencies were extracted. It is necessary to impose some frequency and amplitude restrictions in using this method. This was done by attributing arbitrary weights to the spacings. The weights depend on the amplitude, , where and denote amplitudes of the two terms that form a spacing and is the weight attributed to the spacing . A bin of 0.01 d-1 was used in these histograms which will be hereafter abbreviated as HFS.
5 Results of the analysis
The periodograms and light curves of the stars in Table 1 were examined and deductions made which are described below. It is, of course, difficult to deduce the true nature of the star just from the periodogram. Nevertheless, with this information supplemented by the stellar parameters that were derived for most stars under investigation, we have made an attempt at understanding the true nature of detected variations.
5.1 SPB/ Cephei hybrids
When we examined the periodograms of Kepler B stars we were immediately struck by their strange appearance. In ground-based observations, and even observations from MOST and CoRoT, a Cep star is easily recognizable in having distinctive peaks in the high-frequency domain. It has long been assumed that the typical frequencies for Cep stars are in the range 4–20 d-1 with perhaps a few low-amplitude peaks in the region 0.5–2 d-1 which characterize typical Cep/SPB hybrids. The SPB stars, on the other hand show distinct peaks in the low-frequency domain and no frequencies much higher than 2 or 3 d-1. Here we assume that stars with frequencies exceeding 3.5 d-1 can be regarded as belonging to the Cep group since this frequency is the approximate boundary between and modes in non-rotating stars on the zero-age main sequence. We realize this is an arbitrary number, but we chose it simply for classification purposes.
The periodograms of Kepler pulsating B stars are completely different. They show a very large number of peaks in the low-frequency domain, but with some isolated low-amplitude high-frequency peaks. Nothing like this has ever been seen before and we need to ask ourselves how such stars should be classified. They are not typical Cep stars because the scattered high-frequency peaks usually have very low amplitudes and the periodogram is dominated by a forest of low-frequency peaks. They are not typical SPB stars either because SPB stars do not have low-amplitude high-frequency peaks. They do not resemble any of the known hybrids which are really Cep stars with a few isolated, weak, low-frequency peaks. A possible solution to the strange appearance of the periodograms is discussed in Section 6.
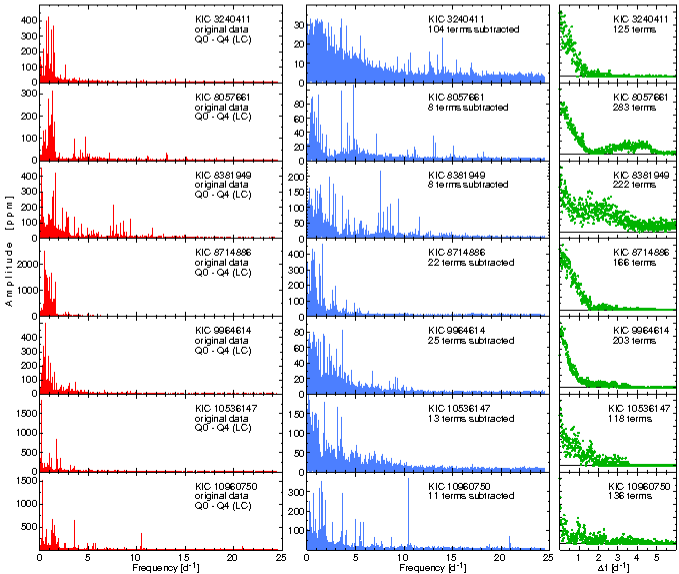
There are seven stars in our sample that we will call SPB/ Cephei hybrids to stress that the dominant modes are the SPB-like modes (Fig. 6) compared to the Cephei/SPB hybrids where the Cephei modes have the highest amplitudes. The periodograms of the two types of hybrids are very different. Since low frequencies dominate in all seven Kepler stars, the middle panels of Fig. 6 show frequency spectra prewhitened with the strongest low-frequency modes in order to reveal the high frequency peaks more clearly. One assumes that the low frequencies are modes while the few isolated high frequencies may be normal modes. However, this assumption may not be correct because the effect of rotation may scatter some low-frequency modes into the high frequency domain (as measured by the observer). For example a sectorial mode of low intrinsic frequency having 20 and azimuthal number 20 may well appear at a frequency of 10–20 d-1 since the rotational frequency perturbation is proportional to where , the rotational frequency, could be around 1 d-1 in some stars.
The detected amplitudes are very small and except for the dominant period in KIC 10960750 do not exceed 700 ppm. As was indicated above, however, the 320-day long Kepler data are of unprecedented precision in which the noise level is only several ppm. The number of significant modes that can be extracted is therefore very large and greatly exceeds the number of frequencies in ground-based observations of hybrid stars. The histograms of frequency spacings are shown in the right-hand panels of Fig. 6. These histograms basically reflect the structure of the periodogram in a different way and are quite interesting for tracing similarities between one star and the next. It is interesting to note the presence of a 2 harmonic of the prominent high-frequency peak at 10.449 d-1 in KIC 10960750.
Of the seven SPB/ Cep hybrids, KIC 3240411, 8057661, 10536147 and 10960750, have known values of (Table 2). The first two stars have low projected rotational velocities typical of SPB stars, but the last two stars have high . There are very few SPB stars known from ground-based observations in which 100 km s-1. In spite of the pronounced difference in projected rotational velocities between these two pairs of stars, we can find no obvious difference in either the appearance of the periodograms or their associated frequency spacing distributions.
KIC 8057661 (KW 41-38, Kohoutek & Wehmeyer 1997), another SPB/ Cep hybrid, is included in the catalogue of objects with H emission (Hardorp et al., 1964). However, recent spectra do not show any emission in the Balmer lines and the spectral lines are relatively narrow (J. Gutiérrez-Soto, in preparation). It may be therefore a Be star seen at low inclination which temporarily does not show H emission.
5.2 SPB stars
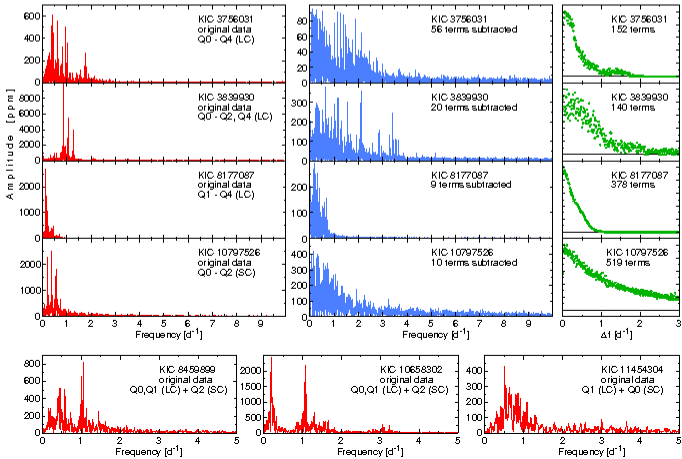
The next group of eight stars we discuss here are stars that can be called ‘normal’ SPB stars because they show only low-frequencies, being devoid of the isolated high frequencies in the stars discussed above. Their frequency spectra are shown in Fig. 7. The three frequency spectra shown at the bottom of Fig. 7 are for stars where the number of detected modes is too small to calculate a reliable HFS.
Only three stars from this group have known values which are low in all three cases: 31 km s-1 for KIC 3756031, 22 km s-1 for 8177087 and 53 km s-1 for 8459899. These values are quite typical for ground-based SPB stars.
In two stars, KIC 8177087 and 10797526, the formal solution comprises of a large number of low-frequency terms. These two stars are, however, among the brightest in our sample. For all other bright stars ( 8.5 mag) a similar increase of amplitude towards low frequency is observed. We therefore conclude that this increase of the noise towards low frequencies is due to the instrumental effects caused by the fact that the stars are close to the bright limit of Kepler observations.
There are several high-frequency terms in the frequency spectrum of KIC 3756031. They are barely visible in Fig. 7 because their signal-to-noise does not exceed 4.5 (amplitudes 8–16 ppm), though this is still significant. The star is located in the middle of the SPB instability strip where mode instability is not expected.
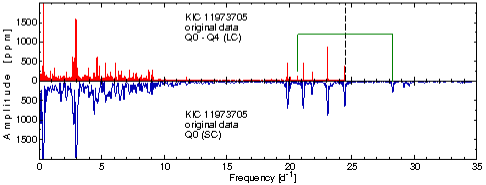
There is another star which may perhaps be regarded as an SPB candidate, KIC 11973705. The frequency spectrum of the LC data (upper panel of Fig. 8) clearly shows multimode behaviour in two frequency regions: below 10 d-1 and over 18 d-1 with only some small-amplitude terms in between. There are SC data available from Q0 which, however, lead to much poorer frequency resolution. In particular, the group of modes around 3 d-1 is not well resolved in the SC data. Nevertheless, the data are useful to show that high frequencies extend beyond the Nyquist frequency of the LC data ( 24.5 d-1). For example, the peak at 20.68 d-1 in the LC data (Fig. 8) is not real; the true frequency of this mode is 28.26 d-1 as we see clearly from the SC data. The LC frequency is mirrored with respect to : .
The star was found to be a double-lined spectroscopic binary by Lehmann et al. (2010). The variability of KIC 11973705 is dominated by an almost sinusoidal variation with period 3.3857 d and semi-amplitude of about 3560 ppm (Fig. 10). This is very probably the orbital period or half this period. The high frequencies probably belong to the A-type star (T 8 000–9 000 K, Lehmann et al. 2010) which is then a Sct variable. One could interpret the low frequencies as SPB pulsations of the B-type primary, but since many Sct stars have low frequencies ( Dor-type variability), these could equally well belong to the A-type companion.
The frequency spectrum of KIC 10658302 shows weak evidence for two broad peaks, at about 1.5 and 3 d-1. It may perhaps be classified as one of the stars with characteristic frequency groupings discussed below.
5.3 Stars with frequency groupings
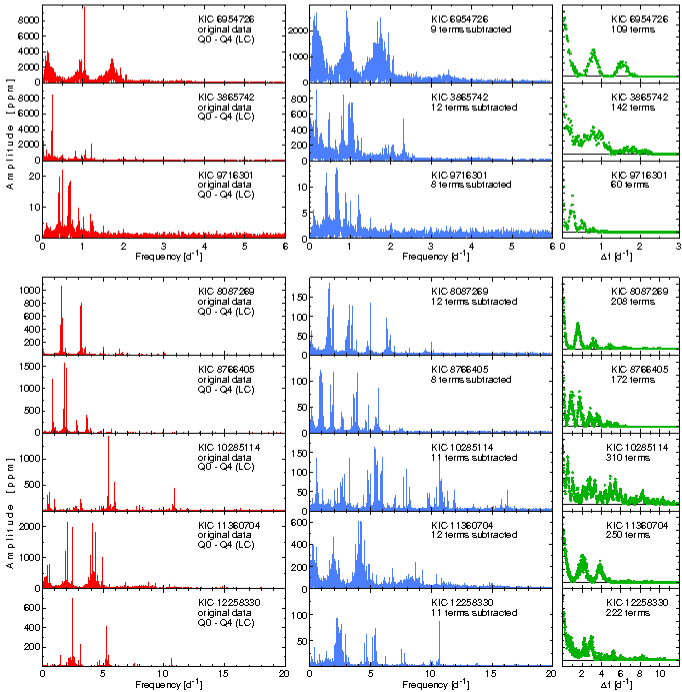
There is one certain Be star in our sample, KIC 6954726 = StH 166 (Stephenson, 1986; Downes & Keyes, 1988; Gutiérrez-Soto et al., 2010). Its projected rotational velocity (160 km s-1, Table 2) is moderate, so that it is probably a rather low-inclination Be star. Its periodogram (top panels of Fig. 9) shows a high-amplitude peak at 1.027 d-1 and three broad peaks (0.1, 0.9 and 1.7 d-1). The HFS for this star shows maxima for separations 0.2, 0.8 and 1.5 d-1. In fact, the light curve of this star is dominated by quasiperiodic long-term variability which was subtracted at the preprocessing phase. The frequency spectrum for this star seems to be characteristic of Be stars. For instance, very similar groupings were discovered in several Be stars observed by the MOST (Walker et al., 2005; Saio et al., 2007; Cameron et al., 2008) and CoRoT satellites (Huat et al., 2009; Diago et al., 2009; Neiner et al., 2009; Gutiérrez-Soto et al., 2010). These groupings are usually interpreted in terms of high radial order modes that have frequencies in the corotating frame smaller than the rotational frequency (Walker et al., 2005; Dziembowski et al., 2007; Cameron et al., 2008). Another explanation is that these short-term variations are due to surface or circumstellar inhomogeneities (Balona, 2009) where the second and third broad peaks are interpreted as the rotational frequency and its first harmonic. A combination of both effects is also a possibility. In both hypotheses, the separation of the broad peaks is interpreted as the rotational frequency, .
Seven other stars from our sample show frequency spectra which, to some extent, are similar to that of KIC 6954726, i.e., they show at least three frequency groupings as judged from their HFS (Fig. 9). None of these stars is known as a Be star. In the HR diagram (Fig. 4), they cover the range of effective temperature corresponding to B2–B8. Projected rotational velocities are available for four of these stars and are moderate to high, ranging between 133 and 271 km s-1 (Table 2). For comparison, the mean projected velocities of B6–B9 main sequence stars ranges from 73 km s-1 (B9–9.5 IV) to 144 km s-1 (B6–B8V) (Levato & Grosso, 2004). The critical rotational velocity for these mid- to late-B stars is about 400 km s-1. The mean equatorial velocities of Be stars is about 350 km s-1. Our sample of these stars is too small to draw any reliable conclusion, but it would be indeed interesting to verify if the rotational velocities of stars in this group are systematically higher than the mean for B-type stars.
If either of the hypotheses proposed for the short-term variability in Be stars is also valid for stars with period groupings, the spacing between frequency groupings, , can be interpreted as . Thus it may be possible to estimate the rotational frequency independently of spectroscopic observations of . As a result, the inclination of the rotation axis, , can be derived. In a pulsating star, knowledge of might help in mode identification and calculation of the visibility of the modes. The values of from the HFS for all eight stars shown in Fig. 9 are presented in Table 3. We note that for two stars, KIC 8766405 and 12258330, two different values of were derived. The former shows a very complicated HFS consisting of broad peaks with superimposed much narrower ones, the HFS for the latter has a double peak.
We suspect that the origin of the frequency grouping in these stars could be rotation, though the sample at our disposal is too small to verify this idea.
| KIC | KIC | ||
|---|---|---|---|
| number | [d-1] | number | [d-1] |
| 3865742 | 0.78 | 9716301 | 0.24 |
| 6954726 | 0.79 | 10285114 | 0.52 and 2.76 |
| 8087269 | 1.59 | 11360704 | 2.05 |
| 8766405 | 0.88 | 12258330 | 2.24 and 2.95 |
5.4 Stars with variations due to binarity or rotation
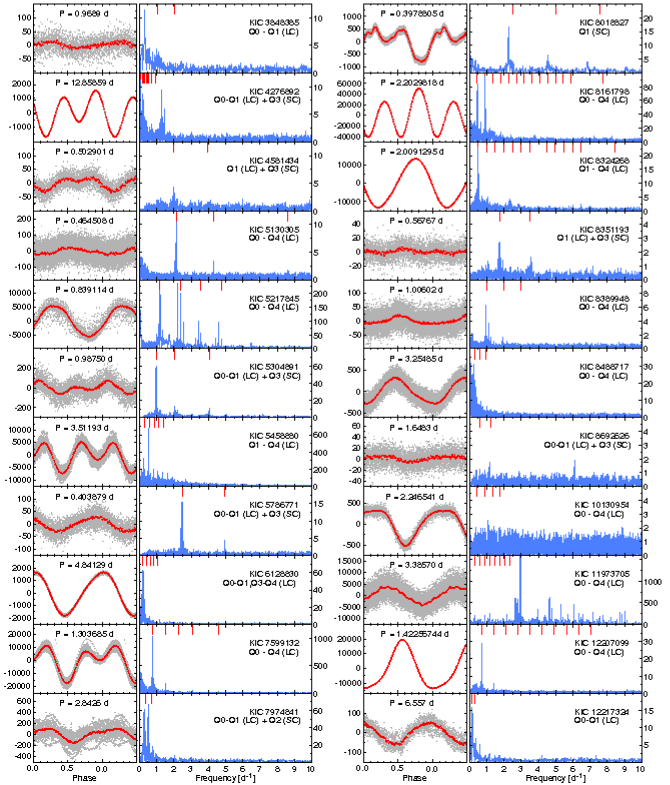
About a half of stars in our sample (23) show much less complicated light curves. Their variability can be understood in terms of proximity effects in a binary system, the presence of surface inhomogeneities and rotation or the combination of both. With the photometric precision of the Kepler data, one may expect to detect weak proximity effects such as light reflection, deformation of components and Doppler beaming (Zucker et al., 2007), even in low-inclination systems. The light curves of these stars are shown in Figs. 10 and 11. The periods and amplitudes of the main periodicity () and its second harmonic () are given in Table 4. Here we have included KIC 11973705, the binary in which the companion is a Scuti variable.
| KIC | Period | Notes | ||||
|---|---|---|---|---|---|---|
| number | [d] | [ppm] | [ppm] | [km s-1] | [R⊙] | |
| 3848385 | 0.9689(7) | 9.5(7) | 3.1(7) | — | — | |
| 4276892 | 12.85859(6) | 581.4(5) | 1194.6(5) | 10 | 2.53 | SB1? |
| 4581434 | 0.502901(8) | 19.2(5) | 11.6(5) | 200 | 1.98 | SB1 |
| 5130305 | 0.464508(7) | 17.5(4) | 4.8(4) | 155 | 1.41 | |
| 5217845 | 0.839114(2) | 5643(9) | 38(9) | 237 | 3.91 | binary |
| 5304891 | 0.98750(3) | 34.5(14) | 37.7 (14) | 180 | 3.49 | |
| 5458880 | 3.51193(4) | 2710(16) | 4675(16) | — | — | |
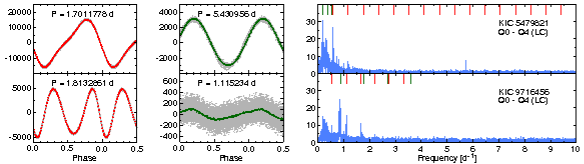
| 5479821 | 1.7011778(4) | 13998.4(19) | 3429.5(19) | 85 | 2.84 | |
| … | 5.430956(19) | 3043.2(19) | 86.1(19) | … | 9.07 | |
| 5786771 | 0.403879(6) | 28.1(5) | 3.6(5) | 200 | 1.59 | |
| 6128830 | 4.84129(3) | 1688.5(18) | 205.9(18) | 15 | 1.43 | CP |
| 7599132 | 1.303685(3) | 8890(20) | 8458(20) | 63/50 | 1.61/1.28 | |
| 7974841 | 2.8426(5) | 107.9(26) | 41.1(26) | — | — | |
| 8018827 | 0.3978805(9) | 437.3(4) | 415.2(4) | — | — | |
| 8161798 | 2.2029818(4) | 13208(4) | 39551(4) | — | — | |
| 8324268 | 2.0091295(4) | 13185.7(7) | 990.0(7) | — | — | CP |
| 8351193 | 0.56767(4) | 1.90(24) | 2.10(24) | — | — | |
| 8389948 | 1.00602(3) | 12.98(26) | 4.50(26) | 142/130 | 2.81/2.57 | |
| 8488717 | 3.25485(7) | 287.7(12) | 45.2(12) | — | — | |
| 8692626 | 1.6483(3) | 4.86(27) | 1.23(27) | — | — | |
| 9716456 | 1.8132861(7) | 859.0(11) | 4455.4(11) | — | — | |
| … | 1.115234(25) | 84.6(11) | 17.3(11) | — | — | |
| 10130954 | 2.246541(10) | 406.7(5) | 106.5(5) | — | — | |
| 11973705 | 3.38570(8) | 3558(14) | 33(14) | 103 | 6.85 | SB2 |
| 12207099 | 1.42256744(14) | 16159.4(7) | 3283(7) | 43 | 1.20 | SB2? |
| 12217324 | 6.557(7) | 53.3(8) | 4.1(8) | — | — |
None of the light curves of stars in this group shows evidence of eclipses. A thorough discussion and analysis of the binary light curves is beyond the scope of this paper and would probably require time-series radial velocity observations. Nonetheless, four stars from this group (KIC 4276892, 4581434, 5217845 and 12207099) are known (or suspected) to be binaries (Table 1). Without corresponding radial velocity observations we cannot be sure that the photometric period corresponds to the orbital period. We also suspect that other stars showing very regular variability with relatively large amplitudes, especially those that have double-wave light variations, are probably binaries as well. These include KIC 5458880, 7599132 and 8161798 (Fig. 10) and also KIC 5479821 and 9716456 (Fig. 11).
The longest period detected in our sample is 12.9 d in KIC 4276892, a suspected SB1 binary (Catanzaro et al., 2010). Binaries with longer orbital periods may have a photometric signature in the Kepler data, but if the amplitude is too small it will probably be mistaken for an instrumental trend.
There are several variables (KIC 4581434, 5130305, 5786771, 8018827, 8351193) with periods in the range of 0.4–0.6 d. Among these, only KIC 4581434 is known to be a binary (Catanzaro et al., 2010). All but KIC 8018827 show variability with the peak-to-peak amplitude of less than 30 ppm. This very small amplitude may be due star spots or other inhomogeneities in a rotating star. If the star spots migrate with respect to each other this could explain amplitude modulation in the light curves. Amplitude modulation is present in the five stars mentioned above. Their frequency spectra (Fig. 10) show residual power in the vicinity of the subtracted main periodicity and its harmonics. KIC 8018827 is exceptional because the strongest residual signal is observed at a frequency of 2.269 d-1, i.e., about 10 percent less than the dominant frequency.
Similar variability can also be seen in stars that have longer periods, e.g., KIC 5304891 and 8389948. For stars where is known, an additional argument in favour of rotation as the cause of variability is the fact that the observed periods are consistent with . With the assumption that the main periodicity corresponds to the rotation period, the minimum radius can be estimated: /2. The values of are given in Table 4 for all stars that have measured . We note that the radii of late B-type stars on the main sequence range from about 1.5 R⊙ to 3.5 R⊙. On this basis, rotation as the cause of variability seems to be excluded for KIC 11973705, the longer period of KIC 5479821 and also perhaps for KIC 5217845. The first star and the last star are known binaries, so we suspect that their variability originates from this cause.
KIC 5479821 is one of two stars (Fig. 11) which shows two non-sinusoidal periodicities. If the longest period in these two stars is attributed to orbital effects, the shortest period needs to be interpreted differently. Rotation is one possibility, but if this is the case, the systems are strongly non-synchronously rotating. Contamination or multiplicity cannot be excluded either. Variability caused by rotation and binarity are not mutually exclusive. In short-period binaries, synchronization of the orbital and rotation period can be expected, but because B-type stars are relatively young, some deviations from full synchronization is possible. In this context, we note that KIC 5217845, which is a binary (Lehmann et al., 2010), has a light curve which is strongly modulated with a period of about 6 days.
Among the stars discussed in this section there are two chemically peculiar (CP) stars. KIC 8324268 (HD 189160, V2095 Cyg), was discovered as a CP Si star by Zirin (1951). Its photometric variability was detected in Hipparcos data, but the period could not be derived. In Kepler data the star shows strictly periodic variability with a period of almost exactly 2 days (Fig. 10, Table 4) and only very small amplitude modulation of about 0.2 percent. The period is assumed to be the rotational period as in other CVn stars.
The other CP star is KIC 6128830, a HgMn star (Catanzaro et al., 2010). The light curve is nearly sinusoidal with a period of about 4.84 d and peak-to-peak amplitude of 3600 ppm. The photometric period, if assumed to be the rotational period, is consistent with 15 km s-1 (Table 4), which is typical for the slowly rotating HgMn stars (Abt et al., 1972). Light variations in HgMn stars have only recently been detected in CoRoT observations (Alecian et al., 2009) and line profile variations are known only in very few stars (Hubrig et al., 2008; Briquet et al., 2010). The light variation implies an inhomogeneous distribution of various elements in the atmospheres of HgMn stars which challenges our understanding of the nature of these stars. HgMn stars were known not to have strong magnetic fields (Aurière et al., 2010) and, while diffusion should lead to vertical stratification, no horizontal surface abundance patches are expected. However, recent observations (Hubrig et al., 2010) indicate the presence of a weak longitudinal magnetic field in the HgMn star AR Aur.
As shown in Fig. 4, stars from this group are mostly late B-type stars falling outside both the Cephei and SPB instability strips. This may explain the lack of variability other than that related to rotation or binarity in these stars. Those that are located within the instability strips are either CP stars or do not show variations that can be interpreted as due to pulsations. Only KIC 5479821, which is located in the SPB instability strip, shows a single peak at 5.709 d-1 and amplitude of 8 ppm which is difficult to understand. The variability in KIC 11973705 has already been discussed.
On the other hand, there are frequencies that cannot be easily explained in four late B-type stars: KIC 3848385 (0.31 d-1), 4276892 (1.29 and 1.45 d-1), 7974841 (0.28 and 0.52 d-1), and 8692626 (6.09 d-1).
Finally, we are left with two stars, KIC 9655433 and 11817929, which we have not yet discussed. The former is the only one from our sample which shows no evidence of variability in Kepler data. The latter is a member of the open cluster NGC 6811 and shows the frequency spectrum characteristic of Sct stars. Its spectral type is very poorly known (Table 1) and we suspect that it may be an A-type star.
6 Modes of high degree in B-type stars
We have seen that there are several B stars in the Kepler data base which are clearly SPB or SPB/ Cep hybrids according to our definition. We have already remarked on the vastly different appearance of the periodograms which are so different from those in ground-based observations of these stars. This requires an explanation.
We see from Fig. 4 that all of the SPB/ Cep hybrid stars are within the Cep instability strip, with KIC 8714886 just cooler than the red edge, but within the SPB instability strip. The instability strips generally discussed in the context of ground-based observations are constructed for modes with 3. From the ground we only see modes of high amplitude, and these tend to be modes with 2 because cancellation effects render modes with higher invisible in photometry. The amplitude limit for ground-based observations is typically a few millimagnitudes, but for Kepler photometry the detection limit is only a few ppm. At this level, the visible range of must be considerably increased. Cancellation effects are severe up to 4, but for higher values of the decrease in visibility with is much smaller (Balona & Dziembowski, 1999). It is possible that with Kepler data, pulsations with values of as high as 20, or even higher, may be visible. Why a particular mode should be selected in preference to another is, at present, an unsolved problem and there is no reason to suppose that only modes of low degree are present in these stars. Clearly, we cannot limit the comparison with models to low values of .
One of the puzzling aspects of the Kepler SPB/ Cep hybrids is the fact that their frequency spectra are dominated by low frequencies. On the other hand, ground-based observations of SPB/ Cep hybrids are dominated by the high frequencies with only a few low-frequency SPB-type modes. Balona & Dziembowski (1999) have studied the excitation of modes of high in B-type stars. They find that for a given value of there are two separate frequency ranges where unstable modes may occur: a range of SPB-like low frequencies and a high-frequency ( Cep like) range. In the high-frequency range only modes of low are excited, while in the low-frequency range modes of high are excited. These high-degree modes are trapped in the outer layers.
In zero-age main sequence stars the region of SPB-type low-frequency instability is present for stars with 4.1 4.4 (B7 to B1) and reaches its maximum extent for 8. As the star evolves, the SPB-type region extents further to hotter temperatures up to 4.5 (O9, B0), reaching its maximum extent for 10. The low-frequency region is still present, though smaller, for 24. It turns out that the maximum extent of the instability strip for low-frequency modes for up to 24 more or less coincides with the SPB instability strip for low shown in Fig. 4. It therefore covers almost the entire B star region. Thus it is not surprising to find that most of the stars observed by Kepler show many low-frequency modes. In all likelihood, these are modes with high . They are not seen from the ground because of their low amplitudes.
It would seem that none of the stars observed by Kepler are in the region of the HR diagram where modes are predominantly excited. The hottest stars in our sample all lie on the cool side of the -mode Cep instability strip as can be seen in Fig. 4. The high-frequency modes are perhaps only weakly driven and have very low amplitudes. Of course, rotation also plays a big role, especially for modes of high which can be perturbed to higher and lower frequencies in proportion to the rotational frequency. The peculiar appearance of the periodograms of these stars thus has a logical explanation in terms of excitation of high-degree modes and their location on the cool side of the Cep instability strip.
In Fig. 4 we also show the location of Kepler B stars which do not pulsate. As already mentioned, some of these stars may be binaries, but there is nothing that clearly distinguishes pulsating and non-pulsating stars. In ground-based observations, the SPB stars nearly all have 100 km s-1, which is not a selection effect and suggests that high rotation suppresses pulsation. The Kepler sample of pulsating and non-pulsating stars comprise both slow and rapid rotators, so rotation does not appear to be a factor. We note that some of these non-pulsating B stars are within the SPB strip and two are within or close to the Cep instability strip. This indicates that the instability strips are not pure, i.e. that stars need not pulsate even if they are located within the instability strip.
7 Stochastic excitation of modes
As we mentioned in the introduction, one of the most interesting results from space observations of Cep stars was the possible discovery of completely unexpected modes with short lifetimes in CoRoT observations of the B1.5 II-III Cep star V1449 Aql (Belkacem et al., 2009) and in the O-type star HD 46149 (Degroote et al., 2010). Features in the periodograms of V1449 Aql were found in the range 9–22 d-1 and were interpreted as stochastic modes excited by turbulent convection just below the photosphere in the thin Fe and He convective zones (Cantiello et al., 2009; Belkacem et al., 2010). The occurrence of convection in the region of iron opacity bump depends strongly on the luminosity and metallicity of the star (Cantiello et al., 2009). One thus expects that the occurrence of stochastic oscillations in B stars would follow a similar dependence if the modes are excited in the Fe-bump region.
Confirmation of the existence of stochastically excited modes in massive stars is clearly of great interest. One of the problems facing such an investigation is that it is not a simple matter to distinguish between self-excited and stochastic modes, as well as non-pulsational light variations. If oscillations occurred in the same frequency range as the Cep pulsations, as they do in V1449 Aql, then one cannot immediately eliminate the Fe bump mechanism as the excitation mechanism for these modes. The suspected stochastic modes seen in the CoRoT observations appear as wide structures in the periodograms of V1449 Aql and HD 46149. They can either be interpreted as a large number of self-excited modes driven by the mechanism (possibly beating with a rotation period unresolved in the measurements) or as single modes that change amplitude and phase stochastically. It is not possible to distinguish between these two explanations unless further information is available.
In Belkacem et al. (2009) the evidence is presented as a time-frequency diagram in which the constant amplitude of a nearby self-excited mode is contrasted with the variable amplitude of the modes thought to be stochastically excited. These authors find that the stochastic modes are organized as regularly spaced patterns in the periodogram, which is stated to be signature of these modes. Regular spacing applies only in the asymptotic limit of high frequencies and occurs for both stochastic and self-excited modes. The claimed modes in V1449 Aql may well be stochastically excited, but unfortunately it cannot be proven at this stage. What lends credence to such an hypothesis, however, is that there is a prediction of where stochastic modes are expected to occur in the HR diagram among the B stars (Cantiello et al., 2009). It would certainly be important to search for wide structures in the periodograms of the Kepler B stars to determine if such stars conform to this prediction.
We visually examined the periodogram of CoRoT observations of V1449 Aql to familiarize ourselves with the broad structures. We then looked for similar structures in the periodograms of the pulsating stars shown in Fig. 6, but nothing resembling them could be found. All the stars have well-resolved peaks in the region 10–24 d-1. Moreover, the background noise level conforms to the relationship discussed in Section 4 except for KIC 3865742 and KIC 10960750 where it is about a factor of 3 or 4 higher than expected for the stellar magnitude and length of the time series. For both stars this is a result of the huge number of low frequencies. There are at least 600 signals with frequencies less than 6 d-1 in the Kepler light curves of these two stars.
KIC 5458880 has an effective temperature and luminosity very similar to V1449 Aql (T 24 500 K, 3.45, Morel & Aerts 2007). It has a strange double-wave light curve which we have interpreted as a proximity effect of a binary. The periodogram shows a noise level which increases towards low frequencies with no clear evidence of distinct frequencies, except at the binary period and its harmonic, down to a level of about 10 ppm. There is certainly no sign of broad structures. The peaks we examined have amplitudes of about 10 ppm, i.e., an order of magnitude smaller than those found in V1449 Aql.
Our conclusion is that the existence of stochastic modes in B stars is not yet proven and that the Kepler stars show no indication of the presence of these modes. If the modes do exist, this result may simply be due to the fact that the Kepler stars in which Cep pulsations are seen are too cool to have a sufficiently active convection zone. The occurrence of stochastic oscillations relies on the occurrence of convection in the iron opacity bump region. Since we cannot yet explain the occurrence of constant stars within the Cep instability strip, it is also possible that a star may not pulsate even if it is in a location in the HR diagram where stochastic driving is expected to be efficient.
8 Conclusion
Kepler observations of 48 main sequence B stars show that 15 of them pulsate with frequencies typical of SPB stars. Of these stars, seven show isolated, weak, high frequencies in the Cep range. The frequency spectra differ considerably from those seen in ground-based SPB/ Cep hybrids and can be understood if most of the low-frequency modes are of high spherical harmonic degree. Models show that low-frequency modes of high spherical harmonic degree, , up to 24 are excited in stars spanning practically the whole main sequence band in B stars. Since we expect to see far more modes of high in Kepler observations than in ground-based observations, this may explain why so many low-frequency modes are visible in the Kepler data. Although the presence of low- and high-frequency modes place these stars in the same class as the ground-based SPB/ Cep hybrids, it is not clear whether this classification is meaningful in the context of space observations. We call the hybrids observed by Kepler SPB/ Cep hybrids to emphasize the dominance of modes in the SPB region.
We also find that though nearly all 48 B stars in our sample are variable at some level, there are certainly stars within the SPB as well as the cooler side of the Cep instability strip which are not SPB stars by the usual definition of these stars. This indicates that there are mechanisms which restrict pulsations in B stars. Such mechanisms may be rotation (which appears to inhibit pulsations in SPB stars), magnetic fields and chemical stratification. It would be important to determine which (if any) of these factors are responsible for damping of pulsations by a comparative study of pulsating and non-pulsating stars. We may also conclude from these observations that the Cep instability strip is not pure, i.e., there are stars in the Cep instability strip that do not pulsate at all (KIC 5458880 and 10130954). This conclusion is strengthened by the B0.5 IV star HD 51756 for which the variations observed in the CoRoT light curve are interpreted as due to rotational modulation (Papícs et al., submitted). There are also many stars within the SPB instability strip which do not seem to pulsate.
We have not found any indication of pulsating star situated between the hot end of the Sct instability strip and the cool end of the SPB instability strip. This conclusion is not only a result of the study of B stars reported here, but also follows from a study of main sequence A stars in the Kepler field not reported here. Degroote et al. (2009a) found a number of such stars. One star that show clear high-amplitude Sct pulsations, KIC 11973705, is almost certainly a B star with a Sct companion.
We have identified a group of stars which show a structure in the periodogram consisting of unresolved frequency groupings which may or may not be due to pulsation. The light curve shows a period corresponding to the mean frequency of the first broad peak (not counting the lowest frequencies) with a strongly modulated amplitude. The structure of the periodogram in many cases resembles that of Be stars, but those stars with spectra show that they are not Be stars. Moreover, a similar structure is found among Kepler A and F stars as well. The HFS is a valuable tool in studying such structures and may possibly be applied in other cases as well. However, the physical meaning of these structures is not presently understood, and without further study it does not seem worthwhile to pursue this line of investigation.
We have looked for the broad structures seen in CoRoT observations of the Cep star V1449 Aql and the young O-type binary HD 46149. They were interpreted as solar-like stochastic modes by Belkacem et al. (2009) and Belkacem et al. (2010), respectively. We are unable to find such structures in the Kepler stars, but this may be because they are too cool. A problem is that it is not really possible to distinguish between quasi-periodic (non-pulsational) variations, stochastic oscillations and closely-spaced unresolved self-excited oscillations. A conclusive demonstration that stochastic modes are present in B stars is not possible in principle with existing data. However, it is possible to test the hypothesis that convectively-driven stochastic modes occur within a certain region in the HR diagram by comparing the location of stars with broad features in the HR diagram to the predictions. If the comparison supports the hypothesis, then the concept of stochastic pulsations in B stars would certainly become more acceptable. At this stage, such a comparison is not possible with Kepler data.
It will be very difficult to use the observed frequencies on their own for asteroseismological modelling without mode identification for at least some frequencies. Because of the low amplitudes, mode identification requires multicolour space observations which will not be available in the foreseeable future. Some progress might be possible if systems of equally spaced frequencies or periods can be found. A preliminary investigation suggests that this might be possible in one or two stars. If this can be confirmed, it might tell us something about the rotational splitting or perhaps even lead to an estimate of the large separation.
Finally, we have detected variability in many stars which we suspect may be proximity effects due to binarity. In other stars, the modulated light curves are more easily explained in terms of migrating star spots. We have also detected periodic light variations in two chemically peculiar stars. Kepler observations of B-type stars have produced some surprises as well as new opportunities for a better understanding of these stars.
Acknowledgments
The authors wish to thank the Kepler team for their generosity in allowing the data to be released to the Kepler Asteroseismic Science Consortium (KASC) ahead of public release and for their outstanding efforts which have made these results possible. Funding for the Kepler mission is provided by NASA’s Science Mission Directorate. We particularly thank Ron Gilliland for his tireless work on behalf of KASC.
LAB wishes to thank the South African Astronomical Observatory for financial support. AP acknowledges the financial support from the MNiSzW grant N N203 302635. MB is a Postdoctoral Fellow of the Fund for Scientific Research of Flanders (FWO), Belgium. JN and RSz acknowledge the support by the National Office for Research and Technology through the Hungarian Space Office Grant No. URK09350 and the ‘Lendület’ programme of the Hungarian Academy of Sciences.
The GALEX data presented in this paper were obtained from the Multimission Archive at the Space Telescope Science Institute (MAST). STScI is operated by the Association of Universities for Research in Astronomy, Inc., under NASA contract NAS5-26555. Support for MAST for non-HST data is provided by the NASA Office of Space Science via grant NNX09AF08G and by other grants and contracts.
References
- Abt et al. (1972) Abt H. A., Chaffee F. H., Suffolk G., 1972, ApJ, 175, 779
- Alecian et al. (2009) Alecian G., Gebran M., Auvergne M., Richard O., Samadi R., Weiss W. W., Baglin A., 2009, A&A, 506, 69
- Asplund et al. (2009) Asplund M., Grevesse N., Sauval A. J., Scott P., 2009, ARA&A, 47, 481
- Aurière et al. (2010) Aurière M., Wade G. A., Lignières F., Hui-Bon-Hoa A., Landstreet J. D., Iliev I., Donati J., Petit P., Roudier T., Theado S., 2010, ArXiv e-prints
- Balona (1994) Balona L. A., 1994, MNRAS, 268, 119
- Balona (2009) —, 2009, in American Institute of Physics Conference Series, Vol. 1170, American Institute of Physics Conference Series, J. A. Guzik & P. A. Bradley, ed., pp. 339–350
- Balona & Dziembowski (1999) Balona L. A., Dziembowski W. A., 1999, MNRAS, 309, 221
- Bartaya (1983) Bartaya R. A., 1983, Bulletin d’Information du Centre de Donnees Stellaires, 93
- Batalha et al. (2010) Batalha N. M., Borucki W. J., Koch D. G., Bryson S. T., Haas M. R., Brown T. M., Caldwell D. A., Hall J. R., Gilliland R. L., Latham D. W., Meibom S., Monet D. G., 2010, ApJ, 713, L109
- Becker (1947) Becker W., 1947, Astronomische Nachrichten, 275, 229
- Belkacem et al. (2010) Belkacem K., Dupret M. A., Noels A., 2010, A&A, 510, A6
- Belkacem et al. (2009) Belkacem K., Samadi R., Goupil M., Lefèvre L., Baudin F., Deheuvels S., Dupret M., Appourchaux T., Scuflaire R., Auvergne M., Catala C., Michel E., Miglio A., Montalban J., Thoul A., Talon S., Baglin A., Noels A., 2009, Science, 324, 1540
- Bianchi et al. (2007) Bianchi L., Rodriguez-Merino L., Viton M., Laget M., Efremova B., Herald J., Conti A., Shiao B., Gil de Paz A., Salim S., Thakar A., Friedman P. G., Rey S., Thilker D., Barlow T. A., Budavári T., Donas J., Forster K., Heckman T. M., Lee Y., Madore B. F., Martin D. C., Milliard B., Morrissey P., Neff S. G., Rich R. M., Schiminovich D., Seibert M., Small T., Szalay A. S., Wyder T. K., Welsh B. Y., Yi S. K., 2007, ApJS, 173, 659
- Briquet et al. (2010) Briquet M., Korhonen H., González J. F., Hubrig S., Hackman T., 2010, A&A, 511, A71+
- Cameron et al. (2008) Cameron C., Saio H., Kuschnig R., Walker G. A. H., Matthews J. M., Guenther D. B., Moffat A. F. J., Rucinski S. M., Sasselov D., Weiss W. W., 2008, ApJ, 685, 489
- Cantiello et al. (2009) Cantiello M., Langer N., Brott I., de Koter A., Shore S. N., Vink J. S., Voegler A., Lennon D. J., Yoon S., 2009, A&A, 499, 279
- Cardelli et al. (1989) Cardelli J. A., Clayton G. C., Mathis J. S., 1989, ApJ, 345, 245
- Castelli & Kurucz (1994) Castelli F., Kurucz R. L., 1994, A&A, 281, 817
- Catanzaro et al. (2010) Catanzaro G., Frasca A., Molenda-Żakowicz J., Marilli E., 2010, A&A, 517, 3
- Chapellier et al. (2006) Chapellier E., Le Contel D., Le Contel J. M., Mathias P., Valtier J.-C., 2006, A&A, 448, 697
- Cohen et al. (2003) Cohen M., Wheaton W. A., Megeath S. T., 2003, AJ, 126, 1090
- Cox et al. (1992) Cox A. N., Morgan S. M., Rogers F. J., Iglesias C. A., 1992, ApJ, 393, 272
- De Cat et al. (2007) De Cat P., Briquet M., Aerts C., Goossens K., Saesen S., Cuypers J., Yakut K., Scuflaire R., Dupret M., Uytterhoeven K., van Winckel H., Raskin G., Davignon G., Le Guillou L., van Malderen R., Reyniers M., Acke B., De Meester W., Vanautgaerden J., Vandenbussche B., Verhoelst T., Waelkens C., Deroo P., Reyniers K., Ausseloos M., Broeders E., Daszyńska-Daszkiewicz J., Debosscher J., De Ruyter S., Lefever K., Decin G., Kolenberg K., Mazumdar A., van Kerckhoven C., De Ridder J., Drummond R., Barban C., Vanhollebeke E., Maas T., Decin L., 2007, A&A, 463, 243
- Degroote et al. (2009a) Degroote P., Aerts C., Ollivier M., Miglio A., Debosscher J., Cuypers J., Briquet M., Montalbán J., Thoul A., Noels A., De Cat P., Balaguer-Núñez L., Maceroni C., Ribas I., Auvergne M., Baglin A., Deleuil M., Weiss W. W., Jorda L., Baudin F., Samadi R., 2009a, A&A, 506, 471
- Degroote et al. (2010) Degroote P., Briquet M., Auvergne M., Simón-Díaz S., Aerts C., Noels A., Rainer M., Hareter M., Poretti E., Mahy L., Oreiro R., Vučković M., Smolders K., Baglin A., Baudin F., Catala C., Michel E., Samadi R., 2010, A&A, 519, A38+
- Degroote et al. (2009b) Degroote P., Briquet M., Catala C., Uytterhoeven K., Lefever K., Morel T., Aerts C., Carrier F., Auvergne M., Baglin A., Michel E., 2009b, A&A, 506, 111
- Diago et al. (2009) Diago P. D., Gutiérrez-Soto J., Auvergne M., Fabregat J., Hubert A., Floquet M., Frémat Y., Garrido R., Andrade L., de Batz B., Emilio M., Espinosa Lara F., Huat A., Janot-Pacheco E., Leroy B., Martayan C., Neiner C., Semaan T., Suso J., Catala C., Poretti E., Rainer M., Uytterhoeven K., Michel E., Samadi R., 2009, A&A, 506, 125
- Downes & Keyes (1988) Downes R. A., Keyes C. D., 1988, AJ, 96, 777
- Droege et al. (2006) Droege T. F., Richmond M. W., Sallman M. P., Creager R. P., 2006, PASP, 118, 1666
- Dworetsky et al. (1982) Dworetsky M. M., Whitelock P. A., Carnochan D. J., 1982, MNRAS, 201, 901
- Dziembowski et al. (2007) Dziembowski W. A., Daszyńska-Daszkiewicz J., Pamyatnykh A. A., 2007, Communications in Asteroseismology, 150, 213
- Dziembowski et al. (1993) Dziembowski W. A., Moskalik P., Pamyatnykh A. A., 1993, MNRAS, 265, 588
- Dziembowski & Pamyatnykh (1993) Dziembowski W. A., Pamyatnykh A. A., 1993, MNRAS, 262, 204
- Dziembowski & Pamyatnykh (2008) Dziembowski W. A., Pamyatnykh A. A., 2008, MNRAS, 385, 2061
- Elias et al. (2009) Elias F., Alfaro E. J., Cabrera-Caño J., 2009, MNRAS, 397, 2
- Frescura et al. (2008) Frescura F. A. M., Engelbrecht C. A., Frank B. S., 2008, MNRAS, 388, 1693
- Gilliland et al. (2010) Gilliland R. L., Jenkins J. M., Borucki W. J., Bryson S. T., Caldwell D. A., Clarke B. D., Dotson J. L., Haas M. R., Hall J., Klaus T., Koch D., McCauliff S., Quintana E. V., Twicken J. D., van Cleve J. E., 2010, ApJ, 713, L160
- Gray (1982) Gray D. F., 1982, ApJ, 255, 200
- Grenier et al. (1999) Grenier S., Baylac M., Rolland L., Burnage R., Arenou F., Briot D., Delmas F., Duflot M., Genty V., Gómez A. E., Halbwachs J., Marouard M., Oblak E., Sellier A., 1999, A&AS, 137, 451
- Guetter (1968) Guetter H. H., 1968, PASP, 80, 197
- Gutiérrez-Soto et al. (2010) Gutiérrez-Soto J., Semaan T., Garrido R., Baudin F., Hubert A., Neiner C., 2010, ArXiv e-prints
- Handler (2009) Handler G., 2009, MNRAS, 398, 1339
- Hardorp et al. (1964) Hardorp J., Theile I., Voigt H. H., 1964, Hamburger Sternw. Warner & Swasey Obs., 3
- Heber et al. (2000) Heber U., Reid I. N., Werner K., 2000, A&A, 363, 198
- Hill & Lynas-Gray (1977) Hill P. W., Lynas-Gray A. E., 1977, MNRAS, 180, 691
- Huat et al. (2009) Huat A., Hubert A., Baudin F., Floquet M., Neiner C., Frémat Y., Gutiérrez-Soto J., Andrade L., de Batz B., Diago P. D., Emilio M., Espinosa Lara F., Fabregat J., Janot-Pacheco E., Leroy B., Martayan C., Semaan T., Suso J., Auvergne M., Catala C., Michel E., Samadi R., 2009, A&A, 506, 95
- Hubrig et al. (2008) Hubrig S., Cowley C. R., González F., Castelli F., 2008, in Precision Spectroscopy in Astrophysics, N. C. Santos, L. Pasquini, A. C. M. Correia, & M. Romaniello , ed., pp. 19–20
- Hubrig et al. (2010) Hubrig S., Savanov I., Ilyin I., González J. F., Korhonen H., Lehmann H., Schöller M., Granzer T., Weber M., Strassmeier K. G., Hartmann M., Tkachenko A., 2010, MNRAS, 408, L61
- Jenkins et al. (2010a) Jenkins J. M., Caldwell D. A., Chandrasekaran H., Twicken J. D., Bryson S. T., Quintana E. V., Clarke B. D., Li J., Allen C., Tenenbaum P., Wu H., Klaus T. C., Middour C. K., Cote M. T., McCauliff S., Girouard F. R., Gunter J. P., Wohler B., Sommers J., Hall J. R., Uddin A. K., Wu M. S., Bhavsar P. A., Van Cleve J., Pletcher D. L., Dotson J. A., Haas M. R., Gilliland R. L., Koch D. G., Borucki W. J., 2010a, ApJ, 713, L87
- Jenkins et al. (2010b) Jenkins J. M., Caldwell D. A., Chandrasekaran H., Twicken J. D., Bryson S. T., Quintana E. V., Clarke B. D., Li J., Allen C., Tenenbaum P., Wu H., Klaus T. C., Van Cleve J., Dotson J. A., Haas M. R., Gilliland R. L., Koch D. G., Borucki W. J., 2010b, ApJ, 713, L120
- Kharchenko et al. (2003) Kharchenko N. V., Pakulyak L. K., Piskunov A. E., 2003, Astronomy Reports, 47, 263
- Koch et al. (2010) Koch D. G., Borucki W. J., Basri G., Batalha N. M., Brown T. M., Caldwell D., Christensen-Dalsgaard J., Cochran W. D., DeVore E., Dunham E. W., Gautier T. N., Geary J. C., Gilliland R. L., Gould A., Jenkins J., Kondo Y., Latham D. W., Lissauer J. J., Marcy G., Monet D., Sasselov D., Boss A., Brownlee D., Caldwell J., Dupree A. K., Howell S. B., Kjeldsen H., Meibom S., Morrison D., Owen T., Reitsema H., Tarter J., Bryson S. T., Dotson J. L., Gazis P., Haas M. R., Kolodziejczak J., Rowe J. F., Van Cleve J. E., Allen C., Chandrasekaran H., Clarke B. D., Li J., Quintana E. V., Tenenbaum P., Twicken J. D., Wu H., 2010, ApJ, 713, L79
- Kohoutek & Wehmeyer (1997) Kohoutek L., Wehmeyer R., 1997, Abhandlungen aus der Hamburger Sternwarte, 11
- Kurucz (1993) Kurucz R. L., 1993, VizieR Online Data Catalog, 6039, 0
- Le Contel et al. (2001) Le Contel J.-M., Mathias P., Chapellier E., Valtier J.-C., 2001, A&A, 380, 277
- Lehmann et al. (2010) Lehmann H., Tkachenko A., Semaan T., Gutiérrez-Soto J., Bmalley B., Briquet M., Shulyak D., Tsymbal V., De Cat P., 2010, A&A, submitted, arXiv:1009.4316v1
- Levato & Grosso (2004) Levato H., Grosso M., 2004, in IAU Symposium, Vol. 215, Stellar Rotation, A. Maeder & P. Eenens, ed., pp. 51–+
- Lindoff (1972) Lindoff U., 1972, A&A, 16, 315
- MacRae (1952) MacRae D. A., 1952, ApJ, 116, 592
- Mamajek (2010) Mamajek E., 2010, A Modern Dwarf Stellar Effective Temperature Scale Based on 17,842 Teff and MK Spectral Type Pairs. http://www.pas.rochester.edu/emamajek/Teff_SpT_table.txt
- Martin et al. (2005) Martin D. C., Fanson J., Schiminovich D., Morrissey P., Friedman P. G., Barlow T. A., Conrow T., Grange R., Jelinsky P. N., Milliard B., Siegmund O. H. W., Bianchi L., Byun Y., Donas J., Forster K., Heckman T. M., Lee Y., Madore B. F., Malina R. F., Neff S. G., Rich R. M., Small T., Surber F., Szalay A. S., Welsh B., Wyder T. K., 2005, ApJ, 619, L1
- Miglio et al. (2007) Miglio A., Montalbán J., Dupret M., 2007, Communications in Asteroseismology, 151, 48
- Molenda-Żakowicz et al. (2010) Molenda-Żakowicz J., Jerzykiewicz M., Frasca A., Catanzaro G., Kopacki G., Latham D. W., 2010, Astronomische Nachrichten, 9-10, 981
- Morel & Aerts (2007) Morel T., Aerts C., 2007, Communications in Asteroseismology, 150, 201
- Neiner et al. (2009) Neiner C., Gutiérrez-Soto J., Baudin F., de Batz B., Frémat Y., Huat A. L., Floquet M., Hubert A., Leroy B., Diago P. D., Poretti E., Carrier F., Rainer M., Catala C., Thizy O., Buil C., Ribeiro J., Andrade L., Emilio M., Espinosa Lara F., Fabregat J., Janot-Pacheco E., Martayan C., Semaan T., Suso J., Baglin A., Michel E., Samadi R., 2009, A&A, 506, 143
- Ofek (2008) Ofek E. O., 2008, PASP, 120, 1128
- Østensen et al. (2010) Østensen R. H., Silvotti R., Charpinet S., Oreiro R., Handler G., Green E. M., Bloemen S., Heber U., Gänsicke B. T., Marsh T. R., Kurtz D. W., Telting J. H., Reed M. D., Kawaler S. D., Aerts C., Rodríguez-López C., Vučković M., Ottosen T. A., Liimets T., Quint A. C., Van Grootel V., Randall S. K., Gilliland R. L., Kjeldsen H., Christensen-Dalsgaard J., Borucki W. J., Koch D., Quintana E. V., 2010, ArXiv e-prints
- Pamyatnykh et al. (2004) Pamyatnykh A. A., Handler G., Dziembowski W. A., 2004, MNRAS, 350, 1022
- Pigulski & Pojmański (2008a) Pigulski A., Pojmański G., 2008a, A&A, 477, 907
- Pigulski & Pojmański (2008b) —, 2008b, A&A, 477, 917
- Saio et al. (2007) Saio H., Cameron C., Kuschnig R., Walker G. A. H., Matthews J. M., Rowe J. F., Lee U., Huber D., Weiss W. W., Guenther D. B., Moffat A. F. J., Rucinski S. M., Sasselov D., 2007, ApJ, 654, 544
- Sato & Kuji (1990) Sato K., Kuji S., 1990, A&AS, 85, 1069
- Scargle (1982) Scargle J. D., 1982, ApJ, 263, 835
- Seaton (1999) Seaton M. J., 1999, MNRAS, 307, 1008
- Simón-Díaz & Herrero (2007) Simón-Díaz S., Herrero A., 2007, A&A, 468, 1063
- Stephenson (1986) Stephenson C. B., 1986, ApJ, 300, 779
- Stothers & Chin (1993) Stothers R. B., Chin C., 1993, ApJ, 408, L85
- Svolopoulos (1969) Svolopoulos S. N., 1969, Astronomische Nachrichten, 291, 129
- Thompson et al. (1978) Thompson G. I., Nandy K., Jamar C., Monfils A., Houziaux L., Carnochan D. J., Wilson R., 1978, Catalogue of stellar ultraviolet fluxes. A compilation of absolute stellar fluxes measured by the Sky Survey Telescope (S2/68) aboard the ESRO satellite TD-1
- Torres et al. (2010) Torres G., Andersen J., Giménez A., 2010, A&A Rev., 18, 67
- Walker et al. (2005) Walker G. A. H., Kuschnig R., Matthews J. M., Cameron C., Saio H., Lee U., Kambe E., Masuda S., Guenther D. B., Moffat A. F. J., Rucinski S. M., Sasselov D., Weiss W. W., 2005, ApJ, 635, L77
- Zacharias et al. (2009) Zacharias N., Finch C., Girard T., Hambly N., Wycoff G., Zacharias M. I., Castillo D., Corbin T., Divittorio M., Dutta S., Gaume R., Gauss S., Germain M., Hall D., Hartkopf W., Hsu D., Holdenried E., Makarov V., Martines M., Mason B., Monet D., Rafferty T., Rhodes A., Siemers T., Smith D., Tilleman T., Urban S., Wieder G., Winter L., Young A., 2009, VizieR Online Data Catalog, 1315, 0
- Zdravkov & Pamyatnykh (2008) Zdravkov T., Pamyatnykh A. A., 2008, Communications in Asteroseismology, 157, 385
- Zirin (1951) Zirin H., 1951, Harvard College Observatory Bulletin, 920, 38
- Zucker et al. (2007) Zucker S., Mazeh T., Alexander T., 2007, ApJ, 670, 1326