Quantum Phases of Ultracold Bosonic Atoms in a One Dimensional Optical Superlattice
Abstract
We analyze various quantum phases of ultracold bosonic atoms in a periodic one dimensional optical superlattice. Our studies have been performed using the finite size density matrix renormalization group (FS-DMRG) method in the framework of the Bose-Hubbard model. Calculations have been carried out for a wide range of densities and the energy shifts due to the superlattice potential. At commensurate fillings, we find the Mott insulator and the superfluid phases as well as Mott insulators induced by the superlattice. At a particular incommensurate density, the system is found to be in the superfluid phase coexisting with density oscillations for a certain range of parameters of the system.
pacs:
03.75.Nt, 05.10.Cc, 05.30.Jp,73.43NqI INTRODUCTION
In a seminal paper in 1998, Jaksch et al. jaksch extended the work of Fisher et al. fisher and predicted the superfluid (SF) - Mott insulator (MI) transition in ultracold bosonic atoms in an optical lattice. The observation of this transition in an optical lattice marked the beginning of the experimental studies of quantum phase transitions in ultracold atoms arising from strong correlations greiner . It also highlighted the possibility for detailed investigations of various kinds of strongly correlated quantum systems in optical lattices where the different parameters of these systems can be exquisitely controlled lewenstein ; bloch ; dalibard .
In this paper, we analyse the various quantum phases exhibited by ultracold bosonic atoms in a periodic one dimensional optical superlattice using the finite-size density matrix renormalisation group (FS-DMRG) method for certain parameters of the system. Previously, it has been shown using the exact diagonalization, quantum Monte Carlo and the mean-field decoupling approximation methods that ultracold bosonic atoms in optical superlattices exhibit different phases, with various charge-density-wave orders apart from the usual SF and MI phases rousseau ; rothpra ; shuchen . In the presence of a disordered and quasiperiodic potential, it has been shown that the system exhibits apart from SF and MI phases, the quasi-Bose glass and the incommensurate charge-density wave phases roth ; giamarchi . In our present work, we vary the densities of the bosonic atoms from commensurate to incommensurate values for a relatively large value of the onsite interaction. The purpose of this investigation is to predict quantum phases that arise due to the influence of the superlattice in the parameter space that we have considered.
The paper is arranged in the following manner. The remainder of this section describes the model for bosonic atoms in a one dimensional optical superlattice that we have chosen in our work. In Section II, the FS-DMRG method and the quantities that we have calculated are briefly discussed. The results are presented in Section III and our conclusions are summarized in Section IV.
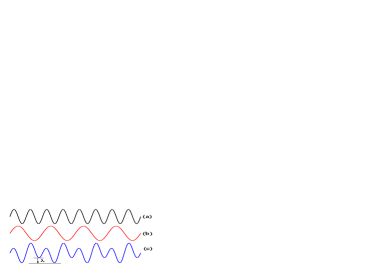
An optical superlattice is formed by the superposition of two optical lattices of different frequencies [Fig. (1)]. Ultracold atoms in an optical superlattice can be described by a modified Bose-Hubbard model where the superlattice potential is explicitly included.
| (1) |
In the above equation, denotes the shift in the energy levels for each site due to the superlattice potential. For our work, we have considered an optical superlattice with the frequency of one optical lattice being double that of the other. Hence, the unit cell comprises of two adjacent lattice sites as depicted in Fig. (1). As a result, ; odd integers and ; even integers. In the first term of Eq. (1), denotes pair of nearest neighbor sites and , denotes the hopping amplitude between them with () being the creation (annihilation) operator which creates (destroys) an atom at site . In the second term of Eq. (1), represents the on-site inter-atomic interaction and is the number operator. The Hamiltonian is re-scaled in units of hopping amplitude by setting so that all the quantities becomes dimensionless.
In the absence of the superlattice potential, the model given in Eq. (1) reduces to the well studied Bose-Hubbard model which exhibits a transition from the gapless, compressible superfluid (SF) phase to the gapped, incompressible Mott insulator (MI) phase at integer densities fisher . However, for non-integer densities, the system remains in the superfluid phase.
The effect of the superlattice potential is to break the translational symmetry of the system. This leads to a change in the local (on site) chemical potential. In the present case, the local chemical potential changes at alternate sites in a periodic manner. The SF-MI transition has been predicted for such a system at interger fillings shuchen . Apart from the SF phase, MI phases with various fillings at integer and half-integer densities have been predicted depending on the relative values of the different parameters of the system shuchen ; roth . The MI phase is characterized by a fixed number of atoms in a particular site or more specifically in a unit cell, and it occurs due to the strong onsite interaction between the atoms. In the two-period superlattice that we have considered, it is possible to have a new class of insulators in which alternate lattice sites occupy a fixed number of atoms. However unlike the MI phase which is due to strong interatomic interactions, these insulators arise because of the superlattice potential. We therefore refer to these insulators as superlattice induced Mott insulators (SLMI). If odd sites are occupied by one atom and none in the even ones, then we call it as the SLMI-I phase whereas, if odd sites are occupied by 2 atoms with none in the even, then it is called the SLMI-II phase.
II METHOD OF CALCULATION
To obtain the ground state wave function and the energy eigenvalues corresponding to model (1) for a system of bosons in a lattice of length , with on-site interactions and tunnelling as well as the energy shift in alternate lattice sites due to the superlattice potential, we use the FS-DMRG method with open boundary conditions white ; schollwock . This method is best suited for one-dimensional problems and has been successfully used to study the Bose-Hubbard model kuhner ; pai ; monien ; schollwock ; urba . In our computations, we have considered four bosonic states per lattice site and the weights of the states neglected in the density matrix formed from the left or the right blocks are less than pai . In order to improve the convergence, at the end of each DMRG step, we use the finite-size sweeping procedure given in white ; pai . To obtain the ground state wave-function , and the corresponding energy for densities ranging from to , we start with sites and atoms in the FS-DMRG and increase both of them by two at each iteration, till we have atoms. Then we do not increase the number of atoms, but increase the number of lattice sites to by adding two sites in each DMRG iteration. After each step of the iteration, sweeping was done from left to right and also right to left across the entire lattice. This process is continued till the energy converges. The superlattice potential breaks the symmetry between the system and the environment. Therefore it is necessary to perform the calculations on the system and the environment blocks separately at each DMRG iteration. Once the length is reached, we keep it fixed and then increase the number of atoms by adding one at a time and perform a complete DMRG sweep for the convergence of the energy. This iterative procedure is continued till the number of bosons is equal to . By this process we obtain the wavefunctions and the corresponding energies of model( 1) for densities ranging from to . We have carried out the calculations for a range of values of starting from to , with and fixed at and respectively.
Using the ground state wave-function , and the corresponding energy , the following quantities are calculated to identify the various phases exhibited by the system. Firstly the chemical potential of a system for the density is defined as follows:
| (2) |
The gapped and gapless phases are distinguished from the behavior of as a function of ramanan . To get information about the on-site density distribution in various phases exhibited by the system, we calculate the on-site density, , defined as,
| (3) |
The momentum distribution and the structure function are defined as the Fourier transform of the single particle density matrix and the density-density correlation function , respectively:
| (4) |
| (5) |
The momentum distribution, will indicate the presence of SF phase in the system. The structure function will give information about the presence of any density wave order in the system, and also the effect of superlattice potential on the Brillouin zone boundaries.
To get an idea of the various gapped and gapless phases in the system, we plot the density, vs the average chemical potential, . However to draw the phase diagram, we need accurate values of the chemical potential, and hence we calculate the chemical potential (both and ) in the thermodynamic limit . is defined as the difference in the energy of the system of length if one atom is added to the system, whereas is the energy cost when one atom is removed from the system, i.e., and . We plot these chemical potential values versus the reciprocal of the length (), and then extrapolate to length tending to infinity () to get the values of the chemical potential in the thermodynamic limit. We plot these chemical potential values for both density half and one for different superlattice potential to get the phase diagram.
III RESULTS AND DISCUSSION
Before we discuss the details of our results, we first summarize the main features of the phase diagram. It is well established that bosons in a normal optical lattice, described by the Bose-Hubbard model fisher , exhibit the superfluid to Mott insulator quantum phase transition at some critical value of for integer densities. (For example, for this transition occurs at the critical on-site interaction kuhner ; pai in one-dimension). For non-integer densities, only the superfluid phase exists in the ground state. The Mott insulator phase has a finite gap and is incompressible. On the other hand, the superfluid phase is gapless and compressible. When we include the superlattice potential, the energy levels at each site is shifted by and this leads to the additional incompressible, gapped SLMI phase. In model (1), the SLMI phase occurs at commensurate densities, i.e., when is equal to an integer or an half-integer, because the superlattice we have considered in our calculations has a periodicity of two lattice sites. For , we observe a SF to SLMI-I phase transition as the strength of the superlattice potential is increased. However, for we get the MI and the SLMI-II phases along with a SF phase sandwiched between them. Such a transition at had already been predicted in an optical superlattice rousseau using a quantum Monte Carlo approach. However this SF phase at is not the usual SF phase which arises due to a large value of /. In fact, in our present case, the ratio is very small (). This SF phase is a result of the competition between the superlattice potential, and the on-site repulsive interaction potential, . Moreover, because of the superlattice potential, this SF phase will have finite density modulations.
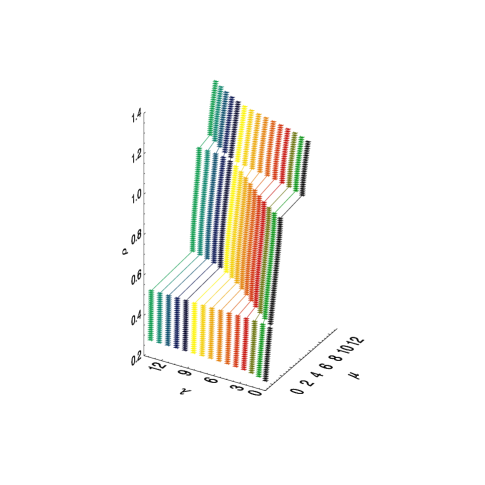
We first discuss the results for commensurate densities and then for incommensurate densities. In the Fig. (2) we plot versus , defined by Eq. (2), for a fixed value of , but varying from to . The gapped phases show up in this type of plots as plateaus with the gap equal to the width of the plateau, i.e., , where and are the values of the chemical potential at the upper and lower knees of the plateau, respectively.
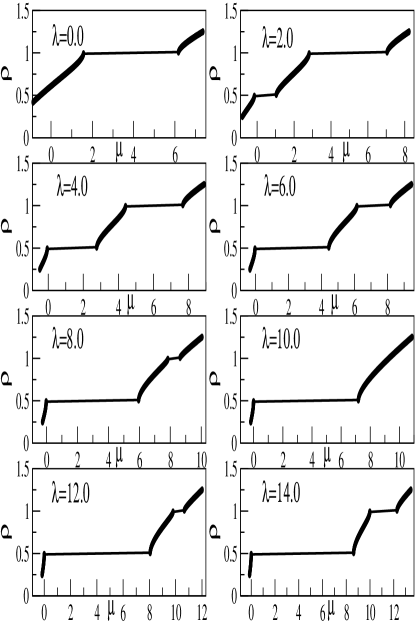
In Fig. 2 we see for , there exists only one plateau at correponding to the MI phase, which is expected since the value of is very large compared to pai . This MI phase survives for small values of . As the strength of increases, two interesting features appear in the plots: (i) a new plateau appears at and (ii) the width of the plateau at decreases. This can be clearly seen in the plots of versus for various values as shown in Fig. (3). For , the gapped phase exists only at [Fig. (3)] and is gapless at . As is increased beyond , two gapped phases appear, at and , respectively. The gapped phase at occurs due to the transition from the SF to the SLMI-I phase with one atom per unit cell, occupying alternate sites.
For values between and , the system exhibits two gapped regions, one at and the other at . The gap at increases steadily as increases and remains finite. On the other hand, for values of , the gap at decreases continuously and ultimately vanishes at around . This kind of behavior for is due to the competition between the superlattice potential, and on-site repulsive interaction, . The on-site interaction tries to impose the MI phase in the system whereas tends to introduce the SLMI-II phase. As long as is greater than , the MI phase is energetically favorable for resulting in a finite gap. As becomes comparable to the value of (here in this calculation we have fixed ), neither the MI phase, with one boson at every site nor the SLMI-II phase, with two bosons at every alternate site is energetically favorable. This leads to vanishing of the energy gap and the system becomes a SF.
When is larger than the value of , the superlattice potential dominates over the on-site interaction. As a result, the gap at opens up again, which can be seen clearly from Fig. (2) and (3). This gap is due to the system being in the SLMI-II phase. The regions other than commensurate densities, i.e. and remain in the gapless SF phase for all values of .
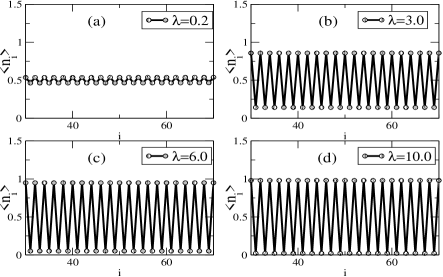
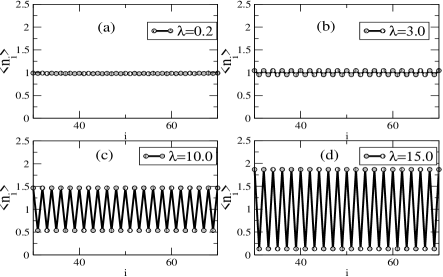
To confirm the above findings concerning the existence of the MI and the SLMI phases, we plot the on-site average number density with respect to the site index as shown in Fig. (4) and (5), for and , respectively. For values of less than , there are no oscillations at density equal to half. However, as the value of is increased, the density oscillations begin to set in the system, and at higher values of , a clear occupancy configuration can be seen confirming the presence of SLMI-I phase [Fig. (4)]. At , for low values of , the plot [Fig. (5)] shows a constant number density equal to implying the MI phase. As is increased, but less than , the superlattice potential induces some oscillations, but the system is still in the MI phase. Even at , the oscillations vary from (maximum) to (minimum), significantly different from the SLMI-II configuration of . Once becomes much larger than , the SLMI-II configuration is observed. For example, at values of , the number occupancy in the sites look very similar to the SLMI-II configuration as can be seen from figure [Fig. (5)].
The momentum distribution is then calculated using the Eq.(4). The value of at is plotted against for three different values of (, and ). A finite value of at is a signature of the SF phase in the system. These plots are compared with the chemical potential versus plots, Fig. (2), to confirm the gapped and gapless phases. In the Fig. (6), for , has a very high value when is smaller than , which signifies the SF phase. As increases beyond , falls off to values very close to zero, implying certain phase transition from the SF phase to an insulating phase. This insulating phase is the SLMI-I as confirmed from the plots [Fig.(4)]. For , starts with values very close to zero [Fig.(6)]. Due to the very high value of , the system resides in the MI state. As becomes comparable to , attains a finite peak value, thus implying the transition from the MI to SF phase. This result is in agreement with the ones obtained from the chemical potential plots [Figs.(2) and (3)]. As is increased further, again drops to values very close to zero implying another phase transition, but this time the transition being from SF to SLMI-II. Hence it can be said that this SF is not the usual SF which comes due to / ratio, but a consequence of the competition between the parameter and . At the incommensurate densities, for example, [Fig(6)], it is observed that stays finite for all values of , without any signs of it vanishing, showing the presence of SF phase throughout the values of considered in this work.
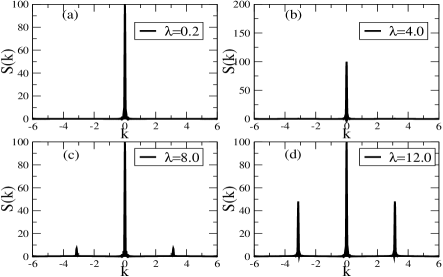
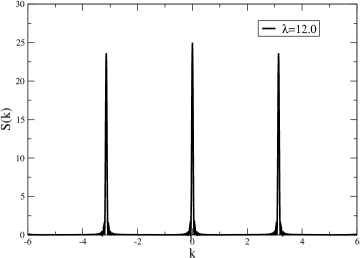
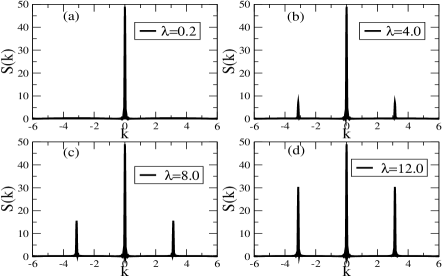
Figs. (7 - 9) gives the structure function as a function of for various values of density (, and , respectively). In the normal optical lattice, the periodicity is one lattice site. So for a MI phase, the structure function peaks at scarola . However in an optical superlattice, the periodicity is doubled. As a result, the Brillouin zone is halved. Hence in the MI phase for an optical superlattice, we expect to observe the peaks of at . It can also be observed that for , the peaks do not appear for lower values of [Fig. (8)]. The onset of the peaks actually signify the effects of the superlattice potential, , in the system rousseau , and thus changing the Brillouin zone boundaries. From Fig. (7), we see two well defined peaks at for at a very large value of implying the presence of SLMI-I phase. At , we see two peaks at , for more than . This is a consequence of some density oscillations induced in the system by the superlattice potential.
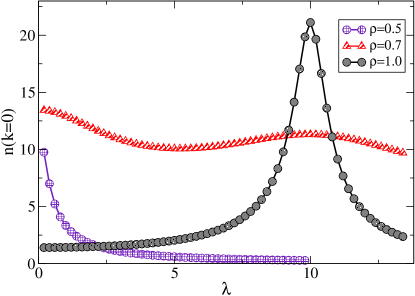
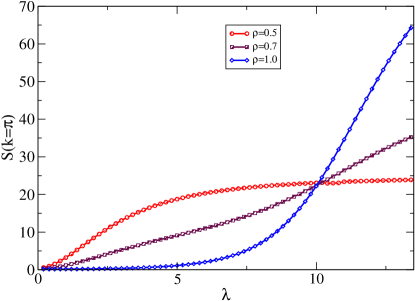
The value of structure function at is plotted in Fig. (10) for some fixed densities against to see how the effect of superlattice potential evolves in the system. For , starts from very close to zero, increases steadily and then becomes almost constant. For , initially there is no peak in the plot at . As is increased, even in the MI phase, we see a finite value of the structure function at , indicating the onset of the effect of the superlattice potential. Once the overcomes , the value of increases rapidly, showing the onset of the SLMI-II phase. It is also noted that at , is finite, showing some density modulations in the system. As seen earlier, at the above value of , the system undergoes a transition from MI to SF phase. Thus the SF at coexists with a finite density oscilallation in the system. For , is very close to zero for low values of , and then increases as is greater than some value, and then goes on increasing implying the setting in of some density modulations in the system. Hence finite peaks of at [Fig. (9)] for implies the effect of superlattice potential in the system bringing about density modulation, although the system is in superfluid phase as indicated from plot [Fig. (6)] for all values of . So we see a coexistence of SF and some sort of density oscillations in the system at the incommensurate density of .
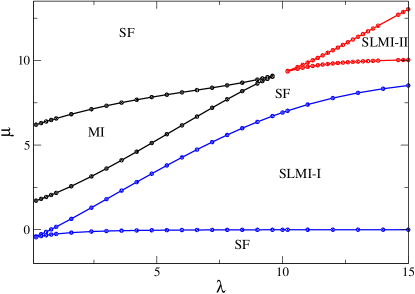
The phase diagram in the - plane for is presented in Fig. (11). The phase diagram consists of SF, MI, SLMI-I and SLMI-II phases depending on the density and the superlattice potential.
IV CONCLUSION
We have analyzed the various phases exhibited by a system of bosons in an optical superlattice with an unit cell consisting of two lattice sites, using the FS-DMRG method for a large value of the on-site interaction, . We find that at density, , the system is initially in the gapless superfluid phase. But as the value of the superlattice potential, is increased, a finite gap arises, which corresponds to the SLMI-I phase corresponding to the configuration [1 0 1 0 …]. At integer density, , the system is initially in the gapped MI phase because of the large value of . But as the superlattice potential value is increased, the gap keeps on decreasing, and ultimately shrinks to zero when . This gapless SF phase coexists with a finite in the system implying density oscillations. As the value of is further increased, the gap reopens, corresponding to the SLMI-II phase, with a configuration [2 0 2 0 …]. At the incommensurate density, , we find the simultaneous existence of the SF phase along with density oscillations in the system.
V Acknowledgement
R. V. P. acknowledges financial support from CSIR and DST, India. We are grateful to William Phillips,Yoshiro Takahashi, Mikhail Baranov, Gora Shlyapnikov and Arun Paramekanti for stimulating discussions.
References
- (1) D. Jaksch, C. Bruder, J. I. Cirac, C. W. Gardiner and P. Zoller, Phys. Rev. Lett. 81, 3108 (1998).
- (2) M.P.A. Fisher, P.B. Weichmann, G. Grinstein and D.S. Fisher, Phys. Rev. B 40, 546 (1989).
- (3) M Greiner, O. Mandel, T. Esslinger, T. W. Hansch and I. Bloch, Nature 415, 39 (2002).
- (4) M. Lewenstein, A. Sanpera, V. Ahufinger, B. Damski, A. Sen(De) and U. Sen, Advances in Physics, 56, 243 (2007).
- (5) I. Bloch, Nature 453, 1016 (2008).
- (6) I. Bloch, J. Dalibard, and W. Zwerger, Rev. Mod.Phys.80,885 (2008).
- (7) V. G. Rousseau, D. P. Arovas, M. Rigol, F. Hebert, G. G. Batrouni and R. T. Scalettar, Phys. Rev. B 73, 174516 (2006).
- (8) R. Roth, K. Burnett, Phys. Rev. A 68, 023604 (2003).
- (9) Bo-Lun Chen, Su-Peng Kou, Yunbo Zhang, and Shu Chen, Phys. Rev. A 81, 053608 (2010).
- (10) Felix Schmitt, markus Hild, and Robert Roth, arXiv:1005.3129v1 [cond-mat.quant-gas].
- (11) G. Roux, T. Barthel, I. P. McCulloch, C. Kollath, U. Schollwöck and T. Giamarchi, Phys. Rev. A 78, 023628 (2008).
- (12) S. R. White, Phys. Rev. Lett. 69, 2863 (1992); Phys Rev. B 48, 10345 (1993).
- (13) U. Schollwöck, Rev. Mod. Phys. 77, 259 (2005).
- (14) T. D. Kuhner and H. Monien, Phys. Rev. B 58, R14741 (1998).
- (15) R. V. Pai and R. Pandit, Phys. Rev. B 71, 104508 (2005).
- (16) T. D. Kuhner, S. R. White and H. Monien, Phys. Rev. B 61, 12474 (2000).
- (17) L. Urba et al., J. Physics B 39, 5187 (2006).
- (18) S. Ramanan, T. Mishra, M. S. Luthra, R. V. Pai and B. P. Das, Phys. Rev. A 79, 013625 (2009).
- (19) V. W. Scarola, E. Demler, and S. Das Sarma, Phys. Rev. A 73, 051601(R) (2006).