Anomalous Hall effect in NiPt thin films
Abstract
We study Hall effect in sputtered NixPt1-x thin films with different Ni concentrations. Temperature, magnetic field and angular dependencies are analyzed and the phase diagram of NiPt thin films is obtained. It is found that films with sub-critical Ni concentration exhibit cluster-glass behavior at low temperatures with a perpendicular magnetic anisotropy below the freezing temperature. Films with over-critical Ni concentration are ferromagnetic with parallel anisotropy. At the critical concentration the state of the film is strongly frustrated. Such films demonstrate canted magnetization with the easy axis rotating as a function of temperature. The magnetism appears via consecutive paramagnetic - cluster glass - ferromagnetic transitions, rather than a single second-order phase transition. But most remarkably, the extraordinary Hall effect changes sign at the critical concentration. We suggest that this is associated with a reconstruction of the electronic structure of the alloy at the normal metal - ferromagnet quantum phase transition.
pacs:
73.50.Jt, 75.70.Ak, 75.30.Kz, 73.43.NqI Introduction
NiPt is an interesting alloy both from fundamental and technological points of view, due to non-trivial magnetic and catalytic propertiescatalytic1 ; catalytic2 . Pt is characterized by the strong spin-orbit interaction resulting in the appearance of a large spin-Hall effect Vila ; Guo . When mixed with magnetic elements, like Ni or Fe, Pt provides a non-trivial host matrix leading to a variety of physical properties of binary alloys. Detailed understanding of those properties remains a serious theoretical challenge. It is further complicated by the existence of several ordered phases, showing different properties compared to disordered alloys Dahmani ; Ruban ; Olovsson ; Kumar(ordered) . Pt and Pd are the two known elements that can form solid solutions with Ni at arbitrary proportions Besnus ; Dahmani (all three belong to the same group-10 of the periodic table of elements). However, while NiPd becomes ferromagnetic at very low Ni concentration, the onset of zero temperature ferromagnetism in bulk NixPt1-x occurs at fairly large concentration at. of NiBesnus ; Kumar(ordered) ; Alberts , which makes it easier to control composition, material and magnetic properties. At the critical concentration, the transition between the normal metal and the ferromagnetic states occurs via a quantum phase transition Varma ; Vojta , i.e., a phase transition at , not driven by thermal fluctuation.
Magnetic moment distribution in bulk NiPt alloys was studied quite exhaustively by high field susceptibility Beille , magnetization Alberts and neutron scattering neutron experiments. It was observed that NiPt alloys indeed are spatially uniform, in contrast to other binary alloys of Ni and Fe, which are prone to segregation.Beille The bulk NiPt alloy can exist in two phases: a chemically disordered face centered cubic (fcc), with Pt and Ni atoms randomly distributed over the crystal lattice; and a chemically ordered state, either with face centered tetragonal (fct), or fcc structure Dahmani . Concentration dependencies of the magnetic moment and the Curie temperature are different for ordered and disordered alloys, especially at low Ni concentrations. Alberts ; Kumar(ordered) ; Kumar(disordered)
In this work we study magnetic properties of sputtered NixPt1-x thin films with different Ni concentration. The composition of the films is characterized by the energy-dispersive X-ray spectroscopy. Anomalous Hall effect is employed for analysis of magnetic properties of the films. Temperature, magnetic field and angular dependencies of the Hall resistance are analyzed and the magnetic phase diagram of NixPt1-x thin films is obtained. It is found that films with low, sub-critical, Ni concentration show cluster-glass (CG) behavior at low temperatures and exhibit perpendicular magnetic anisotropy below the freezing temperature. Films with over-critical Ni concentration are ferromagnetic (FM) with parallel anisotropy. At the critical concentration the state of the film is strongly frustrated: magnetization is canted and is rotating with temperature. Magnetism appears via a percolative paramagnet - cluster glass - ferromagnet transitions, rather than a single second order phase transition. But most remarkably, the extraordinary Hall coefficient changes sign from electron-like to hole-like at the critical concentration, while the ordinary Hall coefficient remains always electron-like. This indicates the “intrinsic” nature of the anomalous Hall effect in this case. We suggest that this phenomenon is a consequence of the quantum phase transition, and is associated with a reconstruction of the electronic structure upon transition to the spin-polarized FM state.
In recent years ferromagnetic thin films have attracted significant attention, due to a rapid development of novel spintronic applications Zutic . In particular, diluted ferromagnets are favorable for fabrication of hybrid superconductor/ferromagnet quantum devices, which may benefit both from spin polarization in FM and macroscopic phase coherence of superconductors Demler ; Buzdin ; Ryazanov ; Aprili ; Gu ; Krasnov ; Frolov ; Golod ; Feofanov . The uniformity of the FM alloy can become critical when designing small, mono-domain spin-valve type structures. Here NiPt may be the material of choice, among binary alloys, because of its inherent intrinsic homogeneity.
Magnetic properties of thin films can be quite different from those of bulk materials. For example, magnetic moment of transition metals is predicted to be higher at the surface than in the bulkFreeman . Magnetic properties of thin films may also depend on the mechanical stress, induced by the substrate. The magnetic moment can increase or decrease depending on whether the crystallographic unit cell of the film dilates or contracts, as a result of the lattice mismatch between the film and the substrate. The Curie temperature of thin films can also be different compared to the bulk materialmagnetism . Ferromagnetic thin films exhibit interesting anisotropy properties. The magnetic moment usually tends to orient itself in-plane, to minimize the magnetostatic energy. However, it was shown that thin films of rare-earth transition-metal alloys may have a perpendicular, out-of-plane anisotropy peprpendicular_anisotropy1 . A significant structural anisotropy is needed for overcoming the large shape anisotropy, inherent to thin films, in order to facilitate the out-of-plane easy axis direction of magnetization. Reorientation of magnetization from the in-plane to the out-of-plane as a function of film thickness or temperature was observed for a large number of thin films pa3 ; *pa4; pa5 ; pa6 ; pa7 ; pa8 ; pa9 ; pa10 . Films with perpendicular anisotropy can be used for high-density magnetic recording.
Magnetic thin films may exhibit superparamagnetic-type of cluster-glass behavior superparamegnetism1 ; superparamegnetism , which is not common for bulk materials. In the CG state the system behaves not like one single domain particle with all its moments aligned in one direction, but rather splits into multiple spin-clusters. The effective magnetic moment of the cluster can be large superparamegnetism Bohr magnetons . At high temperatures the direction of magnetization of each cluster fluctuates and eventually freezes at low . Below freezing temperature the system can exhibit a spontaneous magnetization and coercivity.
The anomalous Hall effect Hurd ; Nagaosa ; eheNifilms is the characteristic property of ferromagnetic materials caused by spin-orbit interactions. It may have both extrinsic and intrinsic contributions, arising respectively from spin-dependent impurity scattering, or finite effective magnetic flux, associated with the Berry phase of itinerant charge carriers with different spin polarization EHE ; Nagaosa . Hall voltage of thin films is described byHurd
| (1) |
where is the Hall voltage, is the Hall resistivity, is the magnetic field intensity, is the magnetization, is the applied current, is the film thickness, is the ordinary Hall effect (OHE) coefficient and is the extraordinary Hall effect (EHE) coefficient. Magnetic alloys, including Pt-based thin films, have been reported to show anomalously large EHE ehe1 ; ehe2 ; ehe3 ; PtEHE , which is up to two orders of magnitude larger than for magnetic elements such as Fe, Co and Ni Watanabe . The EHE provides a very simple way of studying magnetic properties of thin films, compared to other measurement techniques such as vibrating sample magnetometerVSM , superconducting quantum interference device magnetometerSQUID , optical optical_magnetometer and Hall probe magnetometer EHE . The reciprocal dependence of the measured Hall voltage on the film thickness, see Eq.(1), makes this technique preferential for analysis of thin films. The EHE allows us to study magnetic properties at all temperatures and magnetic fields.EHE_films
II Experimental
II.1 Thin film fabrication
NixPt1-x thin films were deposited by DC magnetron sputtering from 1.5 inch target on oxidized Si wafer at a power of 0.05 kW, base pressure mbar and processing Ar pressure mbar. The deposition time was about 5 minutes with deposition rate of 1.67 Å/sec. The thickness of all studied films is nm, as determined by surface profilometer measurements.
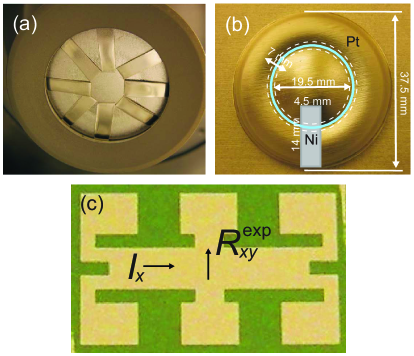
Due to the large cost of Pt, preparation of separate NiPt sputter targets for different Ni concentrations is impractical. Therefore, deposition targets were made from a single pure Pt target, on top of which a selected number of rectangular shaped Ni segments were symmetrically attached, similar to that in Ref. Sato, . The number of segments was adjusted to control the composition of the studied NixPt1-x thin films. Figure 1(a) shows the target with eight attached Ni segments. Each rectangle covers of the effective sputtering area, confined within the erosion track with the diameter of 19.5 mm and the width 7 mm, as shown in Fig. 1(b). The deposited NixPt1-x films were patterned using photolithography and Ar ion milling to form a bridge with both Hall and longitudinal contacts, as shown in Fig. 1(c).
II.2 Analysis of thin films composition by energy dispersive X-ray spectroscopy
To determine the actual Ni concentration in our NiPt thin films, we used the energy dispersive X-ray spectroscopy (EDS). Electron probe microanalysis showed uniform composition of the film with the spatial resolution . Both K and L shell X-ray series were analyzed Golod1 . Analysis of thin film composition by EDS is non-trivial because incident electrons can shoot through the film and cause a parasitic X-ray signal from the substrate EDS1 ; EDS2 . This may cause an error due to secondary fluorescence of the film material after reabsorption of X-rays produced in the substrate. Furthermore, the film/substrate interface leads to backscattering of electrons into the film, which causes additional X-ray emission and overestimation of concentration of elements in the film. Depending on the electron beam energy, the interaction volume can be confined either in the film or in the substrate, resulting in different measured X-ray signals. Thus, the conventional quantitative EDS correction, used for bulk specimens, can give errors when applied to thin films.
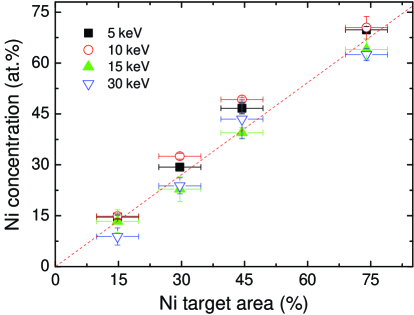
To check the influence of the interaction volume on the EDS signal, we varied electron beams energies. Figure 2 shows obtained Ni concentrations as a function of the relative area of Ni in the combined Pt/Ni target for electron beam energies of 5, 10, 15 and 30 keV. The effective target area was calculated taking into account the actual profile of the erosion track on the target, shown in Fig. 1(b). It is seen that the measured Ni concentration is correlated with the relative Ni target area. However, EDS measurements at different E-beam energies provide slightly different estimations of Ni concentration. The largest value of Ni concentration is obtained at 10 keV energy for films at SiO2 substrates.
For lower electron beam energy of 5 keV the interaction volume is mostly confined in the film, consequently the number of backscattered electrons at the film/substrate interface is small. At high electron beam energies 15 and 30 keV, the number of backscattered electrons from the interface is also small because the peach-form interaction volume is confined mostly in the substrate and the probability for high energy incident electrons to be reflected at the film/substrate interface is low. However, at the intermediate electron beam energy of 10 keV, the extremum of the interaction volume cross-section is close to the film/substrate interface. The energy of incident electrons in this case is low enough for having a large probability of backscattering at the film/substrate interface, simultaneously backscattered electrons have sufficiently high energy for excitation of L-series X-rays of Ni, which are used for EDS analysis at this beam energy. This can lead to a particularly large overestimation of Ni concentration at 10 keV E-beam energy.
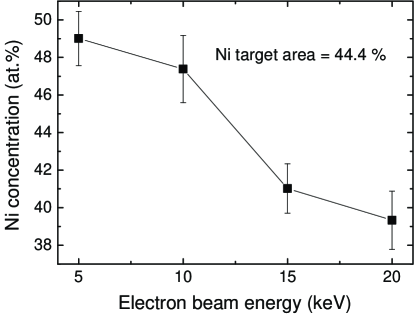
In order to eliminate the effect of the substrate, we performed EDS analysis on free standing NiPt flakes, spread on a carbon substrate. Figure 3 shows the average value of Ni concentration for several NiPt flakes, as a function of the electron beam energy. The film was deposited from the Pt/Ni target with the relative Ni area of 44.4 . It is seen that in this case the estimated Ni concentration decreases monotonously with increasing the electron beam energy. This can not be attributed to backscattering from the substrate but rather can be explained by the error in correction of Ni X-ray absorption in the film EDS2 or/and by the error in the correction of the secondary fluorescence of Ni by Pt. At low electron beam energies, the light L-series are used for determination of Ni concentrations, while high energy K-series are used at high electron beam energies. The absorption is very difficult to correct when working with light elements. It is also more difficult to correctly compensate the secondary fluorescence of very light Ni L-series by Pt. Hence, Ni concentrations are obtained from the linear fit to EDS data at electron beam energies of 5, 10, 15 and 30 keV but with lower weight for 10 keV and larger weight for 15 and 30 keV (the dashed line in Fig. 2). In what follows, we will use this fit for notation of Ni concentration. The accuracy of such determination is verified below by comparison of the Curie temperature at high 67% Ni concentration with that for bulk alloys.
II.3 Measurement setup
Measurements were carried out in a cryogen-free magnet system with a flowing gas insert, in a temperature range from 1.8 K to 300 K and fields up to 10 T. The sample was mounted on a rotatable sample holder. Resistances were measured both in transverse () and longitudinal directions () simultaneously at constant current bias in longitudinal direction (), as shown in Fig. 1(c). The possibility to rotate the platform makes it possible to apply magnetic field at any angle with respect to the film surface. All studied films have about the same thickness and the same Hall-bridge geometry. Therefore, presented data for films with different Ni concentrations can be compared explicitly without the need of additional geometrical normalization factors.
Due to the specific geometry of the experiment, see Fig. 1(c), the measured is sensitive only to the perpendicular component of the magnetic induction in the film. For the out-of-plane orientation of the easy axis, magnetization in the perpendicular field will have a hysteresis/coercivity and so will . However, for the in-plane orientation of the easy axis, the magnetization of the film in perpendicular magnetic field will have zero coercivity, because in this case only rotation of magnetization takes place without translational movement of magnetic domain walls.film_anisotropy
III Results and discussion
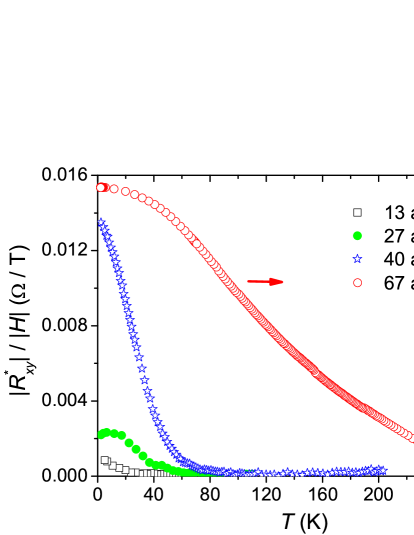
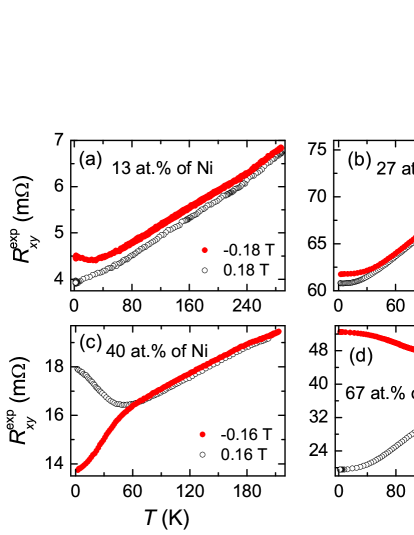
Figure 4 shows temperature dependencies of measured transverse resistances for films with Ni concentrations of 13, 27, 40 and 67 at. and for two opposite field directions perpendicular to the film. contains both longitudinal and Hall contributions. It is seen that at high the measured is independent of the field direction, indicating that it is dominated by the even-in-field longitudinal resistance. However, at lower magnetic correlations become significant and the corresponding odd-in-field Hall contribution appears in . To extract the pure Hall contribution, we took the difference of for positive and negative field directions:
| (2) |
This way the contribution from the even in field longitudinal resistance is cancelled out. Alternatively, we explicitly subtract the longitudinal resistance , measured simultaneously:
| (3) | |||
| (4) |
The advantage of such definition is that it provides Hall resistances for both field directions, while Eq.(2) gives only for the absolute value of the field.
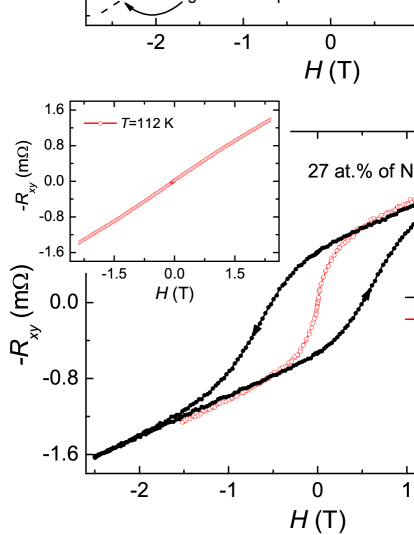
Figure 5 shows dependencies of absolute values of , for the data from Fig. 4. An onset of with decreasing temperature is seen for all studied films. The has strong dependence and increases rapidly with increasing Ni concentration. At K, differs by more than two orders of magnitude between films with the largest (67 at.) and the smallest (13 at.) Ni concentrations.
III.1 Films with low Ni concentration
Main panels of Fig. 6 show at low for films with (a) 13 at. and (b) 27 at. of Ni. Both films show a hysteresis at the lowest (solid circles) with significant coercivity of 0.16 T and 0.6 T, respectively, indicating the out-of-plane magnetic anisotropy. It is seen, however, that continues to grow at large fields. This is due to a weak magnetism in those strongly diluted, sub-critical NiPt films. In this case the saturable EHE is of the same order as the non-saturable OHE contribution.OHEoverEHE With increasing temperature, the coercivity rapidly decreases and vanishes at K for the film with 13 at. of Ni and K for 27 at. of Ni. However, remains nonlinear, see curves with open circles in the main panels of Fig. 6, indicating presence of the residual cluster magnetism in the films. Therefore, represents the CG freezing temperature.
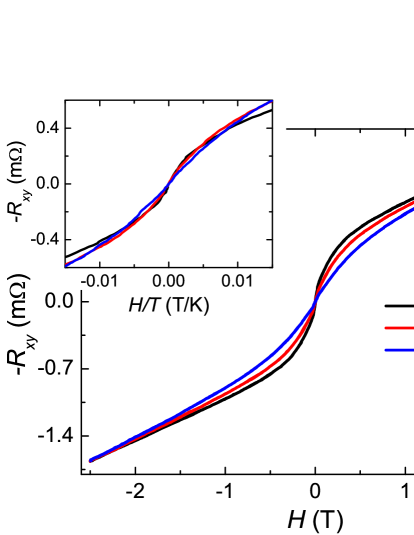
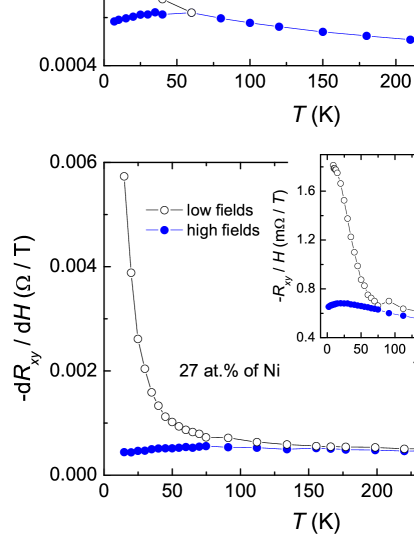
Figure 7 shows as a function of temperature for the same films at low fields (open circles) and above the saturation field at =2 T (solid circles). According to Eq. (1), the latter represents the OHE. The difference of at low and high fields provides an accurate measure of nonlinearity of the Hall effect. From Fig. 7 it is seen that at low temperatures, the zero-field slope has a strong dependence. It rapidly decreases with increasing temperature and becomes equal to the high field slope at K for the film with 13 at. Ni and K for 27 at. Ni. Those temperatures represent the cluster glass-to-paramagnetic transition in the films. At higher temperatures becomes linear and is almost independent, typical for the ordinary Hall effect in the paramagnetic state of thin films.
Cluster glass state is often accompanied by superparamagnetic-type behavior. It is described by the Langevin functionsuperparamegnetism1 :
| (5) |
Here is the magnetic moment of an individual cluster.
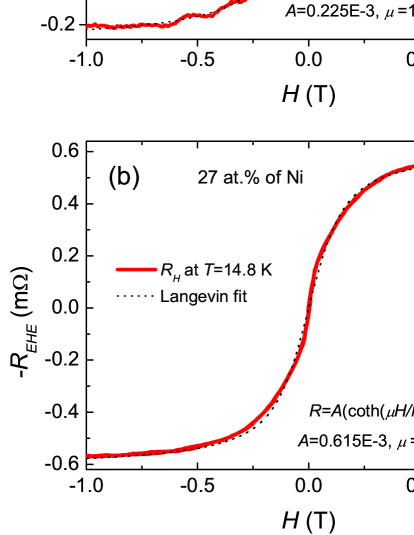
The main panel of Fig. 8 shows -evolution of for the film with 27 at. Ni in the CG state at . It is seen that in the low field range from -0.3 T to 0.3 T, is strongly nonlinear and, therefore, has a dominant EHE contribution, proportional to the magnetic moment of individual magnetic clusters averaged over the volume of the sampleEHE_films . To check the superparamagnetic scalingsuperparamegnetism , in the inset of Fig. 8 we plot as a function of in the low field range. It is seen that the scaling is fairly good.
Figure 9 shows the EHE part of resistance, , for films with (a) 13 at. and (b) 27 at. of Ni, at . is obtained by subtracting a linear OHE contribution, , clearly seen at large : . Data are fitted with Eq. (5), , using and as fitting parameters (dotted lines). From the fits we obtain an average magnetization Am2 and Am2 for the films with 13 at. and 27 at. of Ni, respectively. Therefore, magnetic clusters are composed of about 128 and 356 for films with 13 and 27 at. of Ni, correspondingly. However, in contrast to fixed-size (structural) superparamagnetic particles, in NiPt films is not constant, but is gradually decreasing with increasing temperature, which typical for the cluster glass state with variable-size spin clusters.
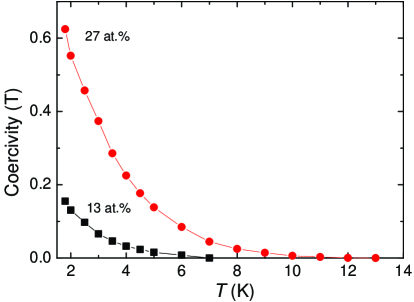
Figure 10 summarizes dependencies of the coercivity for films with low Ni concentrations. The coercivity turns to zero at the CG freezing temperature. This allows an accurate estimation of 7 and 13 K for the films with 13 and 27 at. Ni respectively.
III.2 Films with high Ni concentration
NiPt films with over-critical Ni concentration show distinctly different behavior. In Fig. 11 we show at different , for the film containing 40 at. of Ni, which is close to the critical concentration for the appearance of ferromagnetism. At low the curves decrease with increasing field, opposite to that for sub-critical concentrations, see Fig. 6. This means that the EHE coefficient changes sign from electron-type (negative) at sub-critical, to hole-type (positive) at the critical concentration. The EHE is dominant up to T. At higher fields the non-saturable OHE contribution becomes visible. The OHE coefficient is remaining electron-type, as in sub-critical films. Different signs of and lead to backbending of curves at high fields (see at K in Fig. 11).
A new characteristic feature is seen at the lowest =2.2 K: a pronounced peak appears in at 0.35 T. The peak is hysteretic, i.e. depends on the field sweep direction. For example, when the field is swept down from positive to negative field, the peak appears at T, but not at T. Such non-monotonic behavior of is attributed to obliquely canted magnetizationOkamoto_oblique1 ; Okamoto_oblique2 . The peak is smeared out already at =3.8 K, and the hysteresis vanishes at =10.8 K. The hysteresis-free curves indicate an in-plane easy axis of magnetization. At =14.8 K, another “flat” hysteresis in the reverse, clockwise direction, appears in the low field region (see the inset in Fig. 11). Such behavior is similar to observations in Ref. Okamoto_oblique1, , and is associated with restoration of the canted magnetization, with the easy axis flipping to the opposite side of the film, compared to the low- case. The hysteresis disappears at K. At K, the EHE coefficient changes sign to electron-type. At K the film becomes paramagnetic with linear .
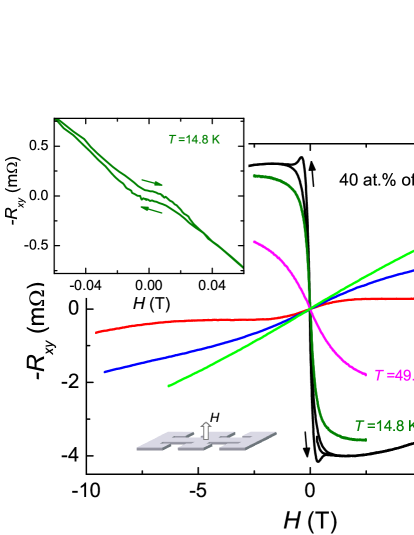
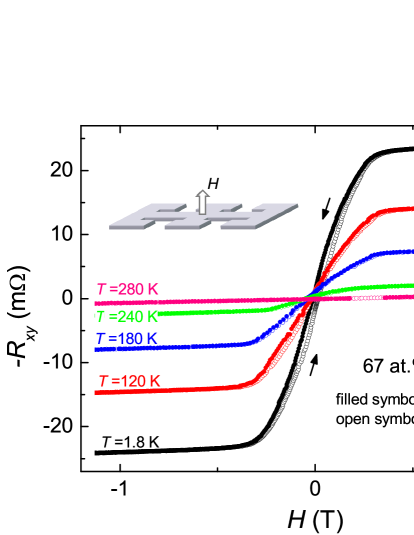
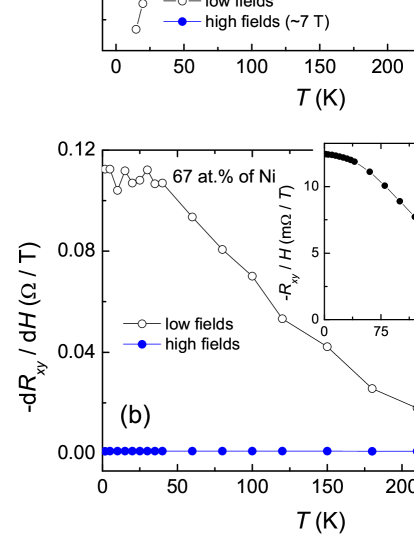
Figure 12 shows at different temperatures for the film with the highest studied Ni concentration of 67 at.. The curves show almost no hysteresis and a clear saturation. In contrast to the film with 40 at. of Ni, both the EHE and the OHE has the same electron-type sign at all temperatures. The saturation value of at the lowest is seven times larger than for the film with 40 at. of Ni, shown in Fig. 11. The EHE contribution is dominant over the full range of the applied magnetic field. This results in a relatively small at high fields [solid circles in Fig. 13 (b)] and strong temperature dependence of the saturation [see the inset of Fig. 13 (b)]. The low field slope decreases with , and dependence becomes linear at the Curie temperature K.
The main panels in Fig. 13 show dependencies of for films with (a) 40 and (b) 67 at. of Ni, at small (open symbols) and large (closed symbols) fields. At low temperatures, is strongly nonlinear, saturates at relatively low fields, and is predominantly due to the EHE. Consequently, is large (positive for the film with 40 at. of Ni and negative for the film with 67 at. of Ni) at low fields. The high-field slopes represent the OHE coefficient . It is small and negative in all cases. With increasing , the saturation magnetic field increases. As a result, the absolute value of decreases at low fields, but starts to increase with increasing at high fields. The insets in Fig. 13 show values of at high fields. They have strong temperature dependencies, as do low-field shown in Fig. 5. This is in contrast to films with low Ni concentration, for which only low-field Hall effect had strong dependence, while large field was only weakly dependent because it was dominated by the OHE. Clearly, for NiPt thin films with high Ni concentrations, the contribution from the EHE is substantial in the whole field range.
III.3 Angular dependence of the anomalous Hall effect
From Figs. 11 and 12 it is seen that although films with high Ni concentration are ferromagnetic and is dominated by the extraordinary contribution , the observed coercivity remains very small. As mentioned in Sec. II C, such the behavior is expected for films with the in-plane orientation of the easy axis of magnetization.
To better understand the orientation of magnetic anisotropy, we study angular dependence of the Hall effect. Figure 14 shows curves at 2 K for films with (a, b) 13, (c, d) 27, and (e, f) 40 at. of Ni at angles (a, c, e) 90∘ (field perpendicular to the film) and (b, d, f) 5∘ between the field and the film surface. In all cases saturation values of the Hall resistance decrease with decreasing angle because the measured signal is proportional to the out-of-plain component of the magnetic moment, which scales as the sine of angle. Similarly, the saturation occurs at approximately the same perpendicular component of the field. This leads to the seeming stretching of the curves along the -axis, inversely proportional to the sine of the angle. The curves in diluted films, shown in Fig. 14, vary continuously with the angle until they practically collapse to at 0∘, field parallel to the film.
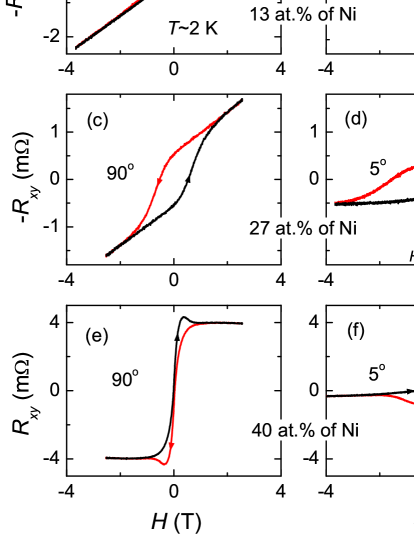
Figure 15 shows curves at =1.8 K for the film with 67 at. of Ni at different angles between the field and the film surface from (a) 90∘ (field perpendicular to the film) to (f) (field parallel to the film). Orientation of the field is sketched in panels (a) and (f). At the angle of an abrupt switching of Hall resistance appears in the low field region [see Fig. 15(d)]. As the angle decreases further, the values of between switchings slightly increase and reaches maximum at [see Fig. 15(f)]. For parallel field orientation the saturation at large fields becomes almost zero. In this case, the magnetic moment is oriented in-plane and does not produce a measurable Hall voltage. The switching of at small fields is associated with the planar Hall effect (PHE) Lu ; Lu1 . The PHE appears when there is a component of magnetization in the film plane. The contribution from the PHE is zero when the magnetization is parallel or perpendicular to the current Stinson . That is why it is zero at high fields when the sample is magnetized perpendicular to the current flow direction [see Fig. 15(f)]. Note that a similar non-monotonous is observed for the film with 40 at. of Ni, but not observed for more diluted films with 13 and 27 at. of Ni, as seen from Fig. 14. This again demonstrates different behavior of films with low and high Ni concentrations.
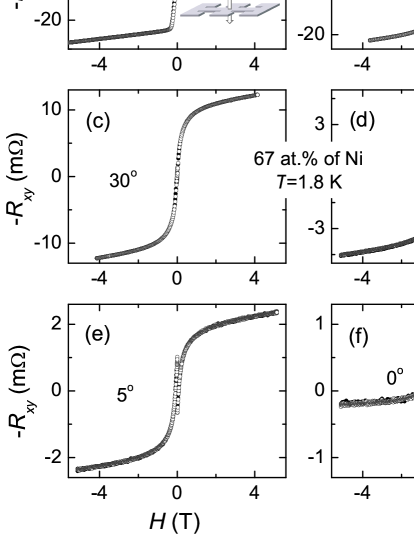
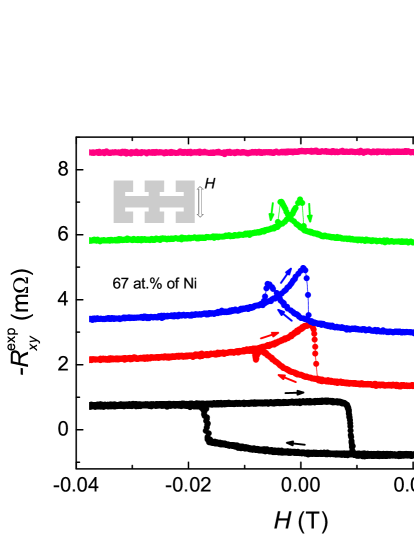
Figure 16 represents a detailed view of the switching process at different temperatures for the film with 67 at. of Ni. It shows of the same film for small in-plane magnetic fields. The curves at different are offset for clarity. The measured resistance contains both the even-in-field PHE and the odd-in-field EHE contributions. The PHE is related to the anisotropic magnetoresistance Stinson ; Hurd , which is even with respect to the field direction. It is seen that the PHE contribution is dominant at high . However, at low there is a clear odd-in-field EHE contribution. We remind that the measured EHE signal is proportional to the out-of-plane moment. We attribute EHE in nominally parallel fields to finite out-of-plane stray fields appearing upon re-orientation of in-plane domains. As temperature increases the becomes more symmetrical indicating the decrease of the EHE contribution.
III.4 The phase diagram
In Table 1 we summarize magnetic properties of our films: the Curie temperature , the cluster-glass freezing temperature , cluster glass - to - paramagnet (PM) transition temperature , the saturated extraordinary Hall resistivity measured at K and T, the longitudinal resistivity xx at K and T and the ordinary Hall coefficient at K and 300 K, obtained from at high fields. It is seen that , , and increase rapidly (almost exponentially) with increasing Ni concentration. However the coercivity of films with high Ni concentration is much smaller than that for films with low Ni concentration. This is caused by reorientation of magnetic anisotropy from the out-of-plane to the in-plane with increasing Ni concentration.
| Ni concentration | 1 | xx | (2 K) | (300 K) | |||
|---|---|---|---|---|---|---|---|
| (at.) | (K) | (K) | (K) | () | () | () | () |
| 13 | 7 | 60 | -0.9 | 15.46 | -2.94 | -2.38 | |
| 27 | 13 | 112 | -2.7 | 27.31 | -2.16 | -2.26 | |
| 40 | 3.8111Due to the coexistence of CG and FM at this concentration it is difficult to assess the true from the measured data. | 24.8 | 242.5 | 19.45 | 35.56 | -1.14 | -1.55 |
| 67 | 280 | -139.5 | 31.37 | -4.91 | -4.04 |
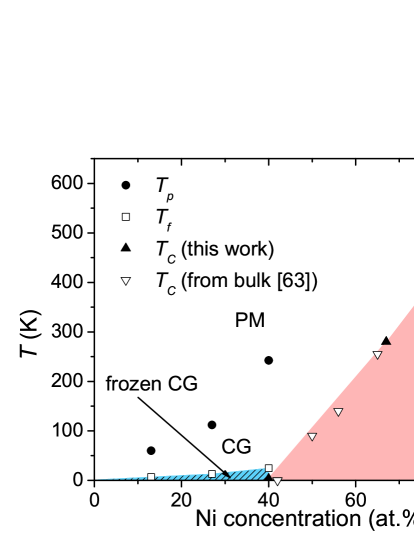
In Fig. 17 we present the magnetic phase diagram of NiPt films. Ferromagnetism in the film with high 67 at. Ni concentration appears in a conventional manner through the second-order PM-FM phase transition at the Curie temperature . At finite magnetization rapidly starts to appear and there is no signature of the CG state above . The values of for the film with 67 at. of Ni are compared to of bulk NiPt alloys from Ref. Tc, . Good agreement verifies the accuracy of determination of Ni concentration using the EDS technique.
Diluted NiPt thin films demonstrate non-trivial properties. In sub-critical films with 13 and 27 at. of Ni with decreasing temperature first a crossover from the PM to the CG state occurs at . In the CG state the saturation magnetization becomes finite, however, the coercivity remains zero, as shown in Figs. 8 and 9. At the CG state freezes which leads to appearence of finite coercivity and remanent magnetization at the time scale of the experiment, see Fig. 6.
Appearance of magnetism in the film with Ni requires one more step. First a PM-to-CG crossover takes place at 240 K. The CG freezes at 24.8 K, which leads to appearance of a finite coercivity, as shown in the inset of Fig. 11. With further decrease of below 3.8 K the Hall resistance starts to show a much larger hysteresis with a non-monotonous peak, see the curve at K in Fig. 11. The angular dependence of the peak is resembling that for the ferromagnetic film with 67 at. of Ni, see Fig. 15 (f), indicative for the in-plane anisotropy and the finite contribution from the planar Hall effect due to appearance of ferromagnetic domain walls. Therefore we ascribe the appearance of such distinctly different behavior at low to transition of the film in the ferromagnetic state at K. It is likely that the observed sequential PM-CG-FM appearance of magnetism in this films has a percolative mechanism Percolation . In this case spin clusters appear at 240 K, grow in size with lowering temperature and finally form an infinite ferromagnetic cluster at K, which is, however, coexisting with the cluster glass state in the remaining finite-size clusters.
From Fig. 17 it is seen that the ferromagnetism disappears at the critical concentration . Therefore, at this concentration the transition from the normal (PM) to the ferromagnetic state occurs at . This is the quantum phase transition (QPT), which is driven by quantum, rather than thermal fluctuations Varma ; Vojta . The QPT can be viewed as a consequence of competition between qualitatively distinct ground states Senthil . The competition leads to enhanced fluctuations around the critical point, which is reflected in the maximum of the longitudinal resistivity for the 40% Ni concentration, as seen from Table 1. However, from the diagram in Fig. 17 it is seen that the QPT in NiPt films is not ideal: the observed cluster-glass behavior in the sub-critical films indicates local magnetic phase separation. Even though we can not exclude the influence of random Ni disorder on formation of magnetic clusters in our films, the commonality of such phase coexistence for various types of magnetic QPT suggests that phase-separation may be generic to QPT Vojta . For example, the phenomenon is also discussed in the context of the so-called pseudogap, coexisting with high temperature superconductivity in cuprates Senthil .
As reported above, properties of NiPt thin films change significantly at the critical point. Most remarkably, the extraordinary Hall coefficient is changing sign. At low and high Ni concentrations is electron-type which is characteristic both for pure Ni and Pt. However, at the critical concentration becomes hole-type (positive). The sign change of the EHE indicates that it is not due to scattering, i.e., not extrinsic, but has an intrinsic origin, related to the Berry phase and electron structure of spin-polarized itinerant charge carriers Nagaosa . The presence of the hole-type contribution is also reflected in the OHE. From Table 1 it is seen that the value of has a minimum at the critical concentration . Therefore, we suppose that the observed sign change of the EHE at the critical Ni concentration is connected with the quantum phase transition and is associated with reconstruction of the electronic structure in the spin-polarization state of the alloy.
IV Conclusions
In conclusions, magnetic properties of sputtered NiPt thin films with different Ni concentration were studied. Temperature, magnetic field and angular dependencies of the Hall resistance were analyzed. It was found that NiPt thin films with low, sub-critical, Ni concentration show cluster-glass behavior at low temperatures and exhibit perpendicular magnetic anisotropy below the freezing temperature. Films with over-critical Ni concentration are ferromagnetic with parallel anisotropy. At the critical concentration the state of the film is strongly frustrated: with decreasing temperature, the anisotropy rotates from out-of-plane to in-plane and again out-of-plane and the magnetism appears via consecutive percolation-type paramagnet - cluster glass - ferromagnet transitions, rather than a single second order phase transition. Most remarkably, the extraordinary Hall effect changes sign at the critical concentration, while the ordinary Hall effect does not. We suggest that this may be a consequence of the quantum phase transition at , associated with reconstruction of the electronic structure in the spin-polarization state of the alloy.
V Acknowledgments
We are grateful to H. Frederiksen for help with thin film deposition and to K. Jansson and O. Terasaki for assistance with EDS characterization. Financial support from the Swedish Research Council, the K.&A. Wallenberg foundation and the SU-core facility in nanotechnology is gratefully acknowledged.
References
- (1) Y. Jugnet, J. C. Bertolini, J. Massardier, B. Tardy, T. M. Duc, and J. C. Vedrine, Surf. Sci. 107, L320 (1981).
- (2) J. Sedlácek, L. Hilaire, P. Légaré, and G. Maire, Surf. Sci. 115, 541 (1982).
- (3) L. Vila, T. Kimura, and Y. C. Otani, Phys. Rev. Lett. 99, 226604 (2007).
- (4) G. Y. Guo, S. Murakami, T.-W. Chen, and N. Nagaosa, Phys. Rev. Lett. 100, 096401 (2008).
- (5) C. E. Dahmani, M. C. Cadeville, J. M. Sanchez, and J. L. Moran-Lopez, Phys. Rev. Lett. 55, 1208 (1985).
- (6) A. V. Ruban, I. A. Abrikosov, and H. L. Skriver, Phys. Rev. B 51, 12958 (1995).
- (7) W. Olovsson, C. Göransson, L. V. Pourovskii, B. Johansson, and I. A. Abrikosov, Phys. Rev. B 72, 064203 (2005).
- (8) U. Kumar, P. K. Mukhopadhyay, B. Sanyal, O. Eriksson, P. Nordblad, D. Paudyal, K. Tarafder, and A. Mookerjee, Phys. Rev. B 74, 064401 (2006).
- (9) M. J. Besnus and A. Herr, Phys. Lett. A 39, 83 (1972).
- (10) H. L. Alberts, J. Beille, D. Bloch, and E. P. Wohlfarth, Phys. Rev. B 9, 2233 (1974).
- (11) H. Maebashi, K. Miyake, and C. M. Varma, Phys. Rev. Lett. 88, 226403 (2002).
- (12) H. v. Löhneysen, A. Rosch, M. Vojta, and P. Wölfle, Rev. Mod. Phys. 79, 1015 (2007).
- (13) J. Beille, D. Bloch, and M. J. Besnus, J. Phys. F 4, 1275 (1974).
- (14) R. E. Parra and J. W. Cable, Phys. Rev. B 21, 5494 (1980).
- (15) U. Kumar, K. G. Padmalekha, P. K. Mukhopadhyay, D. Paudyal, and A. Mookerjee, J. Magn. Magn. Mater. 292, 234 (2005).
- (16) I. Z̆utić, J. Fabian, and S. D. Sarma, Rev. Mod. Phys. 76, 323 (2004).
- (17) E. A. Demler, G. B. Arnold, and M. R. Beasley, Phys. Rev. B 55, 15174 (1997).
- (18) A. I. Buzdin, Rev. Mod. Phys. 77, 935 (2005).
- (19) V. V. Ryazanov, V. A. Oboznov, A. Y. Rusanov, A. V. Veretennikov, A. A. Golubov, and J. Aarts, Phys. Rev. Lett. 86, 2427 (2001).
- (20) M. Aprili, T. Kontos, M. L. D. Rocca, J. Lesueur, W. Guichard, P. Gandit, A. Bauer, and C. Strunk, C. R. Physique 7, 116 (2006).
- (21) J. Y. Gu, C.-Y. You, J. S. Jiang, J. Pearson, Y. B. Bazaliy, and S. D. Bader, Phys. Rev. Lett. 89, 267001 (2002).
- (22) V. M. Krasnov, T. Golod, T. Bauch, and P. Delsing, Phys. Rev. B 76, 224517 (2007).
- (23) S. M. Frolov, M. J. A. Stoutimore, T. A. Crane, D. J. V. Harlingen, V. A. Oboznov, V. V. Ryazanov, A. Ruosi, C. Granata, and M. Russo, Nature Physics 4, 32 (2008).
- (24) T. Golod, A. Rydh, and V. M. Krasnov, Phys. Rev. Lett. 104, 227003 (2010).
- (25) A. K. Feofanov, V. A. Oboznov, V. V. Bol’ginov, J. Lisenfeld, S. Poletto, V. V. Ryazanov, A. N. Rossolenko, M. Khabipov, D. Balashov, A. B. Zorin, P. N. Dmitriev, V. P. Koshelets, and A. V. Ustinov, Nature Physics 6, 593 (2010).
- (26) A. J. Freeman and R. Wu, J. Magn. Magn. Mater. 100, 497 (1991).
- (27) Magnetism. Materials and Applications, edited by É. du Trémolet de Lacheisserie, D. Gignoux, and M. Schlenker (Springer, 2005).
- (28) P. Chaudhari, J. J. Cuomo, and R. J. Gambino, Appl. Phys. Lett. 22, 337 (1973).
- (29) Z. Q. Qiu, J. Pearson, and S. D. Bader, Phys. Rev. Lett. 70, 1006 (1993).
- (30) B. Schulz and K. Baberschke, Phys. Rev. B 50, 13467 (1994).
- (31) R. Allenspach and A. Bischof, Phys. Rev. Lett. 69, 3385 (1992).
- (32) D. Li, M. Freitag, J. Pearson, Z. Q. Qiu, and S. D. Bader, Phys. Rev. Lett. 72, 3112 (1994).
- (33) P. Xhonneux and E. Courtens, Phys. Rev. B 46, 556 (1992).
- (34) D. E. Fowler and J. V. Barth, Phys. Rev. B 53, 5563 (1996).
- (35) M.-T. Lin, J. Shen, W. Kuch, H. Jenniches, M. Klaua, C. M. Schneider, and J. Kirschner, Phys. Rev. B 55, 5886 (1996).
- (36) I. S. Veshchunov, V. A. Oboznov, A. N. Rossolenko, A. S. Prokofiev, L. Y. Vinnikov, A. Y. Rusanov, and D. V. Matveev, JETP Lett. 88, 758 (2008).
- (37) C. P. Bean and J. D. Livingston, J. Appl. Phys. 30, S120 (1959).
- (38) C. M. Hurd, Contemp. Phys. 23, 469 (1982).
- (39) C. M. Hurd, The Hall Effect in Metals and Alloys (Plenum Press, New York-London, 1972).
- (40) N. Nagaosa, J. Sinova, S. Onoda, A. H. MacDonald, and N. P. Ong, Rev. Mod. Phys. 82, 1539 (2010).
- (41) M. Aprili, P. Nédellec, and L. Dumoulin, Solid State Commun. 98, 221 (1996).
- (42) The Hall Effect and Its Applications, edited by C. L. Chien and C. R. Westgate (Plenum, New York, 1980).
- (43) K. Okamoto, T. Shirahawa, S. Matsushita, and Y. Sakurai, IEEE Trans. Magn. MAG-10, 799 (1974).
- (44) T. R. McGuire, R. J. Gambino, and R. C. Taylor, IEEE Trans. Magn. MAG-13, 1598 (1977).
- (45) C. L. Canedy, G. Q. Gong, J. Q. Wang, and G. Xiao, J. Appl. Phys. 79, 6126 (1996).
- (46) G. X. Miao and G. Xiao, Appl. Phys. Lett. 85, 73 (2004).
- (47) M. Watanabe and T. Masumoto, Thin Solid Films 405, 92 (2002).
- (48) S. Foner, Rev. Sci. Instrum. 30, 548 (1959).
- (49) A. H. Miklich, J. J. Kingston, F. C. Wellstood, J. Clarke, M. S. Colclough, K. Char, and G. Zaharchuk, Appl. Phys. Lett. 59, 988 (1991).
- (50) D. Budker and M. Romalis, Nature Physics 3, 227 (2007).
- (51) A. Gerber, A. Milner, M. Karpovsky, B. Lemke, H.-U. Habermeier, J. Tuaillon-Combes, M. Négrier, O. Boisron, P. Mélinon, and A. Perez, J. Magn. Magn. Mater. 242-245, 90 (2002).
- (52) Y. Sato, T. Ishibashi, K. Obara, S. Ichida, Y. Morishita, and K. Sato, Jpn. J. Appl. Phys. 46, L297 (2007).
- (53) T. Golod, Hybrid superconductor junctions with diluted PtNi ferromagnetic interlayer, Licentiate thesis, Stockholm University (2009), available at http://urn.kb.se/resolve?urn=urn:nbn:se:su:diva-54847.
- (54) T. M. Phung, J. M. Jensen, D. C. Johnson, J. J. Donovan, and B. G. McBurnett, X-Ray Spectrom. 37, 608 (2008).
- (55) M. Takakura, H. Takahashi, and T. Okumura, JEOL News 33, 15 (1998).
- (56) K. Okamoto, J. Magn. Magn. Mater. 35, 353 (1983).
- (57) V. N. Matveev, V. I. Levashov, O. V. Kononenko, and A. N. Chaika, Russian Microelectronics 35, 392 (2006).
- (58) I. Sakamoto, M. Sugiyama, Y. Takahashi, and T. Sato, J. Phys. Soc. Jpn. 55, 4367 (1986).
- (59) K. Okamoto, J. Appl. Phys. 53, 601 (1982).
- (60) K. Okamoto, IEEE Transl. J. Magn.Jpn. 5, 1053 (1990).
- (61) Z. Q. Lu, G. Pan, and Y. K. Zheng, J. Appl. Phys. 91, 2161 (2002).
- (62) Z. Q. Lu, G. Pan, W. Y. Lai, D. J. Mapps, and W. W. Clegg, J. Magn. Magn. Mater. 242-245, 525 (2002).
- (63) D. G. Stinson, A. C. Palumbo, B. Brandt, and M. Berger, J. Appl. Phys. 61, 3816 (1987).
- (64) D. K. Saha and K. Ohshima, Phys. Rev. B 51, 3587 (1995).
- (65) J. Burgy, E. Dagotto, and M. Mayr, Phys. Rev. B 67, 014410 (2003).
- (66) T. Senthil, A. Vishwanath, L. Balents, S. Sachdev, and M. P. A. Fisher, Science 303, 1490 (2004).