The ATLAS3D project – V. The CO Tully-Fisher relation of early-type galaxies
Abstract
We demonstrate here using both single-dish and interferometric observations that CO molecules are an excellent kinematic tracer, even in high-mass galaxies, allowing us to investigate for the first time the CO Tully-Fisher relation of early-type galaxies. We compare the Tully-Fisher relations produced using both single-dish and interferometric data and various inclination estimation methods, and evaluate the use of the velocity profile shape as a criterion for selecting galaxies in which the molecular gas extends beyond the peak of the rotation curve. We show that the gradient and zero-point of the best-fit relations are robust, independent of the velocity measure and inclination used, and agree with those of relations derived using stellar kinematics. We also show that the early-type CO Tully-Fisher (CO-TF) relation is offset from the CO-TF of spirals by 0.98 0.22 magnitude at -band, in line with other results. The intrinsic scatter of the relation is found to be 0.4 magnitudes, similar to the level found in the spiral galaxy population. Next generation facilities such as the Large Millimeter Telescope (LMT) and the Atacama Large Millimeter/Sub-millimeter Array (ALMA) should allow this technique to be used in higher-redshift systems, providing a simple new tool to trace the mass-to-light ratio evolution of the most massive galaxies over cosmic time.
keywords:
galaxies: elliptical and lenticular, cD – galaxies: evolution – galaxies: kinematics and dynamics – ISM: kinematics and dynamics – galaxies: spiral – galaxies: structure1 Introduction
The Tully-Fisher relation (TFR; Tully & Fisher, 1977) of spiral galaxies has proved itself to be one of the most important correlations in extragalactic astrophysics. For example, its use as a distance measure is vital in extending the cosmic distance ladder, allowing the scale of structures in the nearby universe to be determined and studied. The underlying cause of this relation between luminosity and rotational velocity is usually interpreted as the product of a relatively constant total (luminous plus dark) mass-to-light ratio (M/L) in the local spiral galaxy population (Gavazzi, 1993; Zwaan et al., 1995), and hence a strong coupling between dark and luminous mass. Studying the slope and zero-point of the TFR is thus also a powerful probe of the M/L evolution of galaxies (e.g. Phillipps, 1989; Sprayberry et al., 1995; Bell & de Jong, 2001).
The TFR as introduced by Tully & Fisher (1977) uses rotation velocities derived from HI line-widths in spiral galaxies, which should approximate the true projected circular velocity of the galaxies as long as the HI distributions are relaxed and reach into the flat parts of the galaxy rotation curves. Over the years, however, the TFR has gradually been recognised as denoting the empirical relationship between the luminosity and rotation velocity of galaxies (generally disc galaxies) as measured with a variety of kinematic tracers, using differing techniques at various wavelengths.
Studying the TFR in lenticular and elliptical galaxies (collectively referred to as early-type galaxies; ETGs) is problematic, as they do not all possess extended relaxed atomic gas distributions. Indeed, it has been shown that even where HI is present in early-type galaxies it can be disturbed, and hence the measured line-widths are in some cases unrelated to galaxy properties (e.g. Morganti et al., 2006; Williams et al., 2010). Although widespread, the ionised gas is generally faint, with significant pressure support; and is thus not ideal either (Bertola et al., 1995). The TFR of early-type galaxies is nevertheless important, as these galaxies are believed to have turbulent formation histories and the TFR may give clues about their assembly and evolution. For example, many authors have suggested that S0 galaxies have avoided violent interactions, and are the faded descendants of high-redshift spirals (e.g. Dressler, 1980; Dressler et al., 1997). In this scenario, S0 galaxies become dimmer whilst keeping the same dynamical mass, leading to an offset TFR.
Due to the problems listed above, stellar tracers of galactic rotation are generally used in ETGs. Due to the importance of pressure support in these systems, however, stellar dynamical modeling or an asymmetric drift correction is required to extract the true circular velocities. This adds additional systematic uncertainties to the already challenging stellar kinematic observations (which must reach sufficiently large radii). Recent analyses of ETGs have suggested that S0 galaxies do indeed have a measurable offset from the spiral TFR, of around 0.5 - 1.0 mag at -band (Neistein et al., 1999; Bedregal et al., 2006; Williams et al., 2010). Magorrian & Ballantyne (2001), Gerhard et al. (2001) and Rijcke et al. (2007) have all considered extending this approach to construct TFRs that include elliptical galaxies, and find that these are also offset from the spiral TFR, by 0.5 to 1.5 mag at optical wavelengths.
In this work we consider the use of carbon monoxide (CO) as a tracer of the circular velocity, of fast-rotating early-type galaxies. CO is thought to be free of many of the problems that beset HI in early-types. As part of the ATLAS3D survey of ETGs (Cappellari et al., 2011, hereafter Paper I) we have found that molecular gas is reasonably abundant in early-type galaxies (Young et al., 2011, hereafter Paper IV) , with 22% of early-type galaxies in the local volume (42 Mpc distant) containing a substantial molecular gas reservoir. The detection rate of molecular gas is also independent of galaxy luminosity and mass (the two most important TFR parameters), providing a direct and unbiased probe of the potential in high-mass galaxies, which are often HI poor (Serra et al., in preparation). The molecular gas is likely to be relaxed in most galaxies under study, even in clusters where HI may be undergoing ram-pressure stripping (Toribio & Solanes, 2009), due to the short dynamical timescales in the central parts of the galaxies, where it is usually found (e.g. Wrobel & Kenney, 1992; Young, 2002; Young et al., 2008; Crocker et al., 2008; Crocker et al., 2009; Crocker et al., 2010). Therefore CO provides a powerful, directly observable measure of the circular velocity of galaxies of all masses and morphological types, irrespective of enviroment. Additionally, the small beamsizes of the mm-wave single-dish telescopes used to detect CO eliminate source confusion, at least in nearby galaxies, while current interferometers routinely yield arcsecond angular resolutions.
The possibility of using CO line-widths to investigate the Tully-Fisher relation was first explored by Dickey & Kazes (1992), and this method has since been used by various authors to investigate the CO TFR of spiral and irregular galaxies (e.g. Schoniger & Sofue, 1994; Schoeniger & Sofue, 1997; Tutui & Sofue, 1997; Lavezzi & Dickey, 1998; Tutui et al., 2001) and quasars (Ho, 2007). In spiral galaxies, the CO velocity widths obtained are directly comparable to those found in HI (Lavezzi, 1997). Young et al. (2008) have also demonstrated that CO is a good tracer of the circular velocity in a small sample of ETGs, from a comparison with detailed dynamical modeling of the stellar kinematics, but this has yet to be demonstrated for a larger sample.
One possible complication introduced when using CO as a dynamical tracer is that the molecular gas in early-types is usually confined to the inner regions. This means that we are only able to probe the kinematics where dark matter does not yet play a significant role. This is the opposite of HI TF analyses, which are generally probing HI at large radii, in the dark matter-dominated part of the rotation curve. As such, a TFR measured in the central region could be considered more similar to the Faber-Jackson (central velocity dispersion - luminosity) relation (Faber & Jackson, 1976). The ETG CO TFR will therefore only be directly comparable to TF results from HI if the ‘disc-halo conspiracy’ , where dark matter flattens the rotation curve at a similar velocity to that found (from luminous material) in the inner regions, also holds for early-type galaxies (Kent, 1987; Sancisi, 2004; Gavazzi et al., 2007).
Some authors have suggested that there is a change in the slope of the TFR for high-mass disc galaxies, brighter than an absolute -band magnitude of -23.75 (Peletier & Willner, 1993; Verheijen, 2001; Noordermeer & Verheijen, 2007). A break in the TFR at a similar position is also found for elliptical galaxies (Gerhard et al., 2001; Rijcke et al., 2007) It has been suggested that this break occurs because many massive galaxies have declining circular velocity profiles, whereas low mass galaxies have relatively flat circular velocity curves. In other words, the aforementioned disc-halo conspiracy is not perfect in ETGs, and many have a local rotation velocity peak at small radii. The radius where one measures the velocity hence becomes important (see Noordermeer & Verheijen, 2007). Measures of maximal rotation produce a much larger break than measures of the asymptotic rotation velocity, supporting this interpretation. Clearly, the existence of a break in the TFR could lead to systematic biases when deriving distances or probing galaxy evolution. Fortunately, however, we show in this paper that our CO velocities are consistent with measures of the rotation beyond the peak of the galaxy circular velocity curves.
This work, to the best of the author’s knowledge, represents the first attempt to create a CO TFR for early-type galaxies. One can identify two major pitfalls that need to be overcome for this approach to be successful. Firstly, as discussed above, it has been shown that the CO in ETGs is often very centrally concentrated, and hence in some galaxies it may not reach beyond the peak of the rotation curve. Identifying such cases is critical to obtain a useful TFR. Secondly, it has been shown that the molecular gas in early-type galaxies is often misaligned with respect to the stars (e.g. Young 2002; Schinnerer & Scoville 2002; Young et al. 2008; Crocker et al. 2009a; Crocker et al. 2008b). In these cases the inclination of the stars is not useful, and we require an estimate of the inclination of the molecular gas itself in order to de-project its observed rotation velocity.
Our goal in this paper is therefore to explore and demonstrate that, despite the potential pitfalls highlighted above, ETGs do appear to follow a robust luminosity-rotational velocity relation, consistent with that measured using other tracers at the same radii. Although technical aspects will certainly be improved and the interpretation of this relation remains uncertain, an ETG CO TFR is a tantalising and promising tool for galaxy evolution studies, worthy of further consideration. In Section 2 of this paper we discuss the data used in this work, outlining the observations in Sections 2.3 and 2.4, the methods for estimating the inclination in Section 2.5, and our method for extracting the circular velocity from observed CO line-widths in Section 2.6. In Section 3 we compare these velocities with other measures such as circular velocities derived from dynamical models, and show that it is possible to use simple criteria to select galaxies where CO is a good tracer of the circular velocity beyond the peak of the galaxy rotation curve. In Section 4 we present our ETG CO TFRs, and explore how different data and inclination estimates affect the resulting relations. In Section 5 we more fully discuss our results and compare them with previous TFR results derived using other tracers. We summarise our conclusions in Section 6.
2 Data
2.1 Sample
The sample used here is composed of the galaxies detected in CO(1-0) emission in Paper IV. CO(1-0) and (2-1) were observed in all galaxies from the complete, volume-limited ATLAS3D sample of 260 lenticular and elliptical galaxies (see Paper I for full details). Upper limits for non-detections are typically in the range - , depending on the distance, assuming a standard CO-to-H2 conversion factor. The detected galaxies used here range in molecular gas masses from to , with molecular gas mass fractions between and /, where is the -band luminosity from the Two Micron All Sky Survey (2MASS) (Jarrett et al., 2000; Skrutskie et al., 2006). Only fast-rotating galaxies were detected.
Of the 52 detections by Paper IV, 4 are only detected in CO(2-1), and a further 8 had an insufficient signal to noise ratio to perform the analysis required here, leaving 40. In addition to these we include the ETGs IC2099, NGC 4292 and NGC 4309, which were detected in CO as part of the initial ATLAS3D survey, but were later removed from the sample because they are too faint at -band to meet the final sample selection criteria. This should not affect the TFR. This leaves a total of 43 galaxies, the properties of which are listed in Table 1.
2.2 Photometric data
The -band magnitudes used in this paper are from 2MASS (Jarrett et al., 2000; Skrutskie et al., 2006). These magnitudes are measured over large apertures, to include the total flux from the galaxy using the techniques developed in Kron (1980) and curves-of-growth (see Jarrett et al. 2000 for further details). They have been widely used in the astronomical community and are found to be robust to 0.1 mag (Noordermeer & Verheijen, 2007).
2.3 CO single-dish data
As reported in Paper IV, the Institut de Radioastronomie Millimétrique (IRAM) 30m telescope at Pico Veleta, Spain, was used for simultaneous observations of CO(1-0) and CO(2-1) in our galaxies. The primary beam FWHM is 23′′ and 12′′ for CO(1-0) and CO(2-1) respectively. The filterbank back-end gave an effective total bandwidth of 512 MHz (1330 km s-1) and a raw spectral resolution of 1 MHz (2.6 km s-1) for CO(1-0). The system temperatures ranged from 190 to 420 K for CO(1-0). The time on source was interactively adjusted so that the final, co-added CO(1-0) spectrum for each galaxy had a rms noise level of 3.0 mK T (19 mJy) per binned 31 km s-1 channel. For further details, see Paper IV.
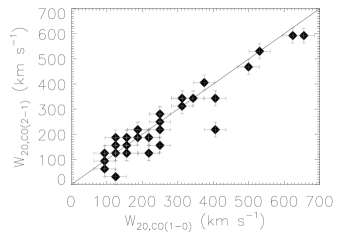
The CO(1-0) and CO(2-1) spectra for each detected galaxy, binned to 31 km s-1 channels, were analyzed to find the velocities at which the flux drops to 20% of the peak height. Each spectrum was read into a routine which, working outwards from the galaxy systemic velocity, locates the first channel where the velocity drops to 20% of the peak value. The measurements were inspected by eye to ensure noise peaks and troughs were not affecting the result. This is analogous to the method used by Tully & Fisher (1977) for measuring HI line-widths. The resulting velocity width is henceforth denoted W20. If the molecular gas is a good tracer of the circular velocity in our galaxies, then the line-width should approximate twice the projected rotational velocity, if the molecular gas distribution reaches beyond the peak of the galaxy rotation curve (Dickey & Kazes, 1992).
Figure 1 shows a comparison between W20 line-widths measured from CO(1-0) and CO(2-1) spectra. One might expect it to be easier to measure line-widths using CO(2-1), as Paper IV have shown that this transition is usually 1–4 times brighter than CO(1-0) (due to beam dilution and/or intrinstic effects), but Figure 1 shows that the agreement between the two measurements is generally good. However, almost all the scatter is below the 1:1 line. In these cases, the molecular gas likely extends further than the 12′′ FWHM of the CO(2-1) beam, and the CO(2-1) line-width measurements are systematically biased low. In Section 4.1.3, we in fact show that in some cases even the 23′′ CO(1-0) beam is not extended enough to retrieve the full velocity width. The number of galaxies for which this is a concern is small, however, and in the rest of this paper we will therefore use line-widths measured from the CO(1-0) spectra.
The instrumental dispersion is small compared to our 31 km s-1 channels, so we did not correct the line-widths for it. We also chose not to use corrections for turbulence or line-broadening, as these are generally derived by comparison with HI line-widths in spirals (Lavezzi & Dickey, 1998; Tully & Fouque, 1985; Tutui & Sofue, 1999) and hence may not be applicable to early-type galaxies. The velocity dispersion in the gas is expected to be small (e.g. Okuda et al., 2005). In Section 3.1 we attempt to quantify any biases introduced by ignoring these corrections. The derived W20 velocity widths are estimated to be robust to within half a channel width, 15 km s-1, and are listed in Table 1.
2.4 Interferometric data
As part of the ATLAS3D survey, all CO(1-0) detections with an integrated flux greater than about 19 Jy km s-1 that do not have interferometric maps available in the literature are to be observed with the Combined Array for Research in mm-wave Astronomy (CARMA; Bock et al., 2006). Full details of this ongoing interferometric survey can be found in Alatalo et al. (in preparation), but we summarize the observations here.
Observations of the sample galaxies have been ongoing since early 2008, mainly in the D-array configuration, providing a spatial resolution of 4-5′′. CO(1-0) has so far been observed using narrow-band correlator configurations, providing at least 3 raw channels per 10 km s-1 binned channel whilst ensuring adequate velocity coverage for all galaxies. Bright quasars were used to calibrate the antenna-based gains and for passband calibration. The data were calibrated and imaged using the ‘Multichannel Image Reconstruction, Image Analysis and Display’ (MIRIAD) software package (Sault et al., 1995). Total fluxes were compared with the IRAM 30m single-dish observations to ensure that large proportions of the fluxes were not being resolved out.
A total of 22 galaxies included in this work have been observed with CARMA so far (IC 0676, IC 719, IC 1024, NGC 1222, NGC 1266, NGC 2764, NGC 2824, NGC 3626, NGC 3665, NGC 4119, NGC 4292, NGC 4324, NGC 4429, NGC 4435, NGC 4694, NGC 4710, NGC 5379, NGC 6014, NGC 7465, PGC 058114, UGC 06176 and UGC 09519). We also include here the galaxies for which data is already available from the literature, mostly from SAURON survey (de Zeeuw et al., 2002) follow-ups. These are NGC 3032, NGC 4150, NGC 4459 and NGC 4526 (Young et al., 2008); NGC 2685 (Schinnerer & Scoville, 2002); NGC 2768 (Crocker et al., 2008); NGC 0524, NGC 3489, and NGC 4477 (Crocker et al., 2010). This makes for a total of 31 sample galaxies that have interferometric data.
The data cubes were summed spatially to measure total fluxes and revised values for W20, serving as consistency checks on the values derived from the single-dish data. The large primary beam of the arrays also allow us to make better measurements for the small subset of galaxies in which a substantial part of the CO distribution was missed by the 23′′ beam of the IRAM 30m telescope, such as in IC676, NGC 4324, NGC 4477, NGC 4710, NGC 7465 and PGC 058114. This can be due to pointing errors or molecular gas distributions that extend beyond the beam. The integration time for the single-dish CO observations was adjusted to obtain a fixed noise level- and as such galaxies which are only detected at 5 will have rather uncertain W20 line-widths. The interferometric observations in these cases (NGC 2685, NGC 2768, NGC 3489, NGC 4477) will provide a better constraint on the line-widths. The revised W20 values are listed in Table 1, but for consistency these velocities are only used in the TFRs presented in Sections 4.1.3 and 4.1.4.
2.5 Inclination correction
The measured quantity W20 is a projection of the gas velocity into the line-of-sight. If this is to be used for a TF analysis it must be deprojected. Many methods for inclination measurement are available. Starting with the simplest, we compare various method below in order of increasing complexity, to allow future CO TF surveys to select the optimum method for their needs. The methods presented in Sections 2.5.1 and 2.5.2 use only single-dish molecular data, whilst the method presented in Section 2.5.3 requires interferometric maps.
2.5.1 Galaxy axial ratio
A rough measurement of inclination can be obtained by estimating the axial ratio of the stellar distribution of the host galaxy from imaging data:
| (1) |
where is the ratio of the semi-minor () to the semi-major () axis of the galaxy, and is the intrinsic axial ratio when the galaxy is seen edge-on (). is often assumed to be 0.2 in disc galaxies (Tully & Fisher, 1977), but early-types can have large bulge-to-disc ratios leading to a large uncertainty in any assumed value of .
Various lines of enquiry suggest a mean value of 0.34 for the fast-rotators in the ATLAS3D sample (Weijmans et al., in preparation), which we adopt here. Intrinsic scatter around this value will introduce an artificial increase in the TFR scatter, but the effect is very small. Indeed, we stress that this -related inclination correction is only significant in highly inclined galaxies, where fortunately inclination errors have the smallest effect on the de-projected velocities and thus the derived TFR. For example, assuming for the current sample would only change the zero-point of the derived TFR by 0.02 dex along the velocity axis, and it does not change the gradient.
It is important to note that using this method to correct the CO velocity widths for a TF analysis implicitly assumes that the CO is distributed in the same plane as the galaxy major-axis. Recent work by Davis et al., (in preparation) however suggests that a sizable proportion of early-type galaxies have molecular gas misaligned with respect to the stellar kinematic axis, so in these cases one expects this method to introduce additional artificial scatter in the TFR.
The value of obtained by assuming =0.34 for each galaxy is listed in Table 1. These values were calculated using Equation 1 with the mean galaxy axial ratio reported in the NASA/IPAC Extragalactic Database (NED). These values are the mean of the measurements from the Sloan Digital Sky Survey (SDSS) in the band, 2MASS at band (Skrutskie et al., 2006), and blue and red filters from both the Third Reference Catalogue of Bright Galaxies (RC3; de Vaucouleurs et al., 1991), and the Uppsala General Catalogue of galaxies (UGC/POSS; Nilson, 1973) where available. The exceptions to this are NGC 3665, where the axial ratio is based only on the superior SDSS imaging, and PGC 058114, where the mean value of the axial ratio from the HyperLeda database (Paturel et al., 2003) has been used, due to a larger number of available measurements. When these inclinations are compared to those estimated from the axial ratios of Krajnović et al. (2010) (Paper II; derived by calculating the moments of inertia of the surface brightness distribution from the SDSS and INT r-band images) for the galaxies in the ATLAS3D sample they are found to agree well.
2.5.2 Dust axial ratio
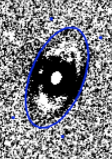
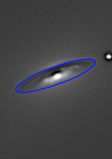
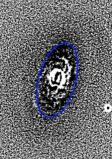
It should be possible to obtain more accurate inclination estimates from fitting ellipses to dust highlighted in unsharp-masked optical images of the galaxies. This method has several advantages over galaxy axial ratios. Dust distributions typically have very small vertical scale-heights, hence Equation 1 with =0 should yield a good estimate of their inclinations. It has also been shown that CO and dust in early-type galaxies are usually spatially coincident (Young et al., 2008; Crocker et al., 2008; Crocker et al., 2009; Crocker et al., 2010), hence the inclination of the dust () should trace the true inclination of the molecular gas. This is especially useful where the molecular gas and stars are misaligned.
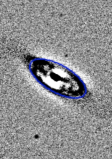
Unsharp-masked dust maps were created for all the galaxies in this work, preferentially from archival Hubble Space Telescope (HST) images, or where these were not available from SDSS -band (Adelman-McCarthy et al., 2008) or ATLAS3D Isaac Newton Telescope Wide Field Camera (INT-WFC) -band images (Scott et al., in preparation). Ellipses were then fitted by eye to the resulting maps and the inclination of the dust calculated from Equation 1 with =0. Four example galaxies are shown in Figure 2.
One of the galaxies (NGC 4753) is well studied in the literature, showing many thin filamentary dust features that are well fitted by a model featuring an inclined disc, twisted by differential precession, with an average =75 (Steiman-Cameron et al., 1992). We adopt this value here. A full list of values can be found in Table 1.
2.5.3 Molecular gas modeling
Tilted-ring analyses have been used to determine the geometric and kinematic parameters of neutral and molecular gas discs in interferometric data for many years (e.g. Rogstad et al., 1974; Christodoulou et al., 1988; Koribalski et al., 1993). In this work, we have made use of the Groningen Image Processing System (GIPSY) add-on package TiRiFiC, described in Józsa et al. (2007), to fit tilted-ring models to observed data cubes. Due to the small number of independent synthesized beams across our typical sources, an unwarped disc model was fitted where the inclination, position angle, systemic velocity and kinematic centre of the gas were varied globally, and only the velocity and surface brightness were allowed to vary radially (i.e. for each ring). Full details of the fits are reported in Davis et al., (in preparation) but the inclination measures () used in this work are listed in Table 1. The error quoted for each galaxy is the maximum inclination difference found if each side of the velocity distribution is supplied as an input to the fitting program separately.
We have attempted the analysis described above for all the mapped galaxies in our sample where with have adequate spatial resolution, with one exception where we felt the literature value was sufficient. NGC 2685 has dust lanes which look polar on the north-east side, and are coincident with HI, H and CO emission (Schinnerer & Scoville, 2002). This system has been revealed to feature a coherent, extremely warped disk (Józsa et al., 2009), for which we adopt the published average inclination value of =69 .
2.6 W20 linewidths
The velocity widths calculated as described in Sections 2.3 and 2.4 are an approximation to (twice) the maximum rotation velocity of the CO. To be useful, these CO measurements must reach beyond the peak of the galaxy rotation curves. Young et al. (2008) suggest that molecular gas in early-types is often centrally concentrated and hence this requirement is not trivially fulfilled.
One sign of a tracer having reached a flat part of a galaxy rotation curve is a classic ‘double-horned’ velocity profile. Lavezzi & Dickey (1997) discuss in detail the problem of recovering velocity widths from CO observations, given the variety of profile shapes typically seen in millimeter observations. They show that CO profile shapes are affected by the extent of the emitting gas, the beam size of the telescope, pointing errors and the optical depth of the molecular material. CO line-widths are shown to accurately retrieve Vflat in the majority of cases where the flaring parameter R2,5 (the ratio of the velocity widths measured at 20 and 50% of the peak) is less than 1.2 (Lavezzi & Dickey, 1997, 1998). This criterion effectively selects galaxies that show a boxcar, or double-horned, profile shape with sharp edges and rejects those with a more Gaussian profile. We follow this methodology in this work, exclusively using galaxies with double-horned/boxcar/sharp edged profiles, which we call ’boxy’ from here on in, assuming that in these systems the measured gas velocity width will approximate the velocity beyond the peak of the circular velocity curve.
The limited signal-to-noise ratio of the spectra we possess, however, means that the value of the flaring parameter discussed above is often rather uncertain. We performed several other tests, attempting to find a good automatic way of classifying boxy velocity profiles. These included fitting single gaussians and selecting those galaxies that shown significant structure in the residuals, and fitting Gauss-Hermite polynomials and looking for a significant kurtosis (h 0). Both of these methods worked well for wide lines and high signal to noise cases, but in the case of narrow lines, or low signal to noise the fits were not well constrained. In these cases the different methods often produced contradictory results, and/or did not agree with a careful classification by eye. In future surveys with better data quality, or large numbers of objects (so one can afford to remove low signal to noise detections) these methods will likely be highly useful, but in this current work, with a limited number of objects we prefer a careful classification by eye.
Even by eye, some cases are hard to classify, especially when the profiles are narrow as the galaxies are fairly face on, or if the signal-to-noise ratio is low. We cautiously use only those galaxies with clear boxy profiles here, flagging the 12 galaxies with uncertain profiles shapes.
Using this profile shape criterion is likely to introduce some uncertainties, for example galaxies with a molecular ring will have double-horned profiles without the CO necessarily having reached beyond the peak of the rotation curve. Similarly, galaxies that have strong resonances may have their gas distribution truncated at the turnover radius, causing them to not display a classic boxy shape even though the edge of the distribution is rotating at the turnover velocity. In Section 3.1 we use the dynamical models available to us from the ATLAS3D survey to quantify these biases.
2.6.1 Combining interferometric and single-dish data
Finally, we can combine our single-dish and interferometric observations, using all available data to increase the number of galaxies with high-quality measurements available. When available, we thus always use interferometric velocity widths and, when well constrained, interferometric inclinations (quantitatively, we select galaxies with inclination errors less than 6∘). For the remaining galaxies we preferentially use dust inclinations, or failing this, / inclinations. We can also use the interferometric data when available to help ascertain which galaxies have reached beyond the peak of the rotation curve, in conjunction with the usual single-dish boxy criterion. This hybrid measure represents our best estimate of the inclination and velocity width. The adopted best inclinations are listed in Table 1.
| Galaxy | -type | W20,SD | W20,inter | MKs | Dhorn | Dhorn | Tel. | Ref. | ||||
|---|---|---|---|---|---|---|---|---|---|---|---|---|
| (km s-1) | (km s-1) | (deg) | (deg) | (deg) | (deg) | (mag) | (SD) | (best) | ||||
| (1) | (2) | (3) | (4) | (5) | (6) | (7) | (8) | (9) | (10) | (11) | (12) | (13) |
| IC 0676 | -1.3 | 93 | 170 | 58 3 | - | 69 6 | 69 6 | -22.20 | - | - | C | 1 |
| IC 0719 | -2.0 | 343 | 353 | 82 1 | 79 1 | 74 5 | 74 5 | -22.70 | x | x | C | 1 |
| IC 1024 | -2.0 | 221 | 240 | 79 1 | 72 1 | - | 72 1 | -21.70 | x | x | C | - |
| ⋆IC 2099 | -1.5 | 93 | - | 83 1 | - | - | 83 1 | -21.40 | ? | ? | - | - |
| NGC 0524 | -1.2 | 312 | 320 | 28 8 | 19 7 | 44 28 | 19 7 | -24.70 | x | x | P | 2 |
| NGC 1222 | -3.0 | 156 | 210 | 41 5 | 41 3 | - | 41 3 | -22.70 | ? | - | C | 1 |
| NGC 1266 | -2.1 | 187 | 180 | 47 4 | 26 5 | - | 26 5 | -22.90 | - | - | C | 1 |
| NGC 2685 | -1.0 | 156 | 220 | 70 1 | 61 1 | 70 10 | 61 1 | -22.80 | - | - | O | 4 |
| NGC 2764 | -2.0 | 312 | 310 | 65 2 | 65 1 | 76 15 | 65 1 | -23.20 | x | x | C | 1 |
| NGC 2768 | -4.4 | 322 | 360 | 36 6 | - | - | 36 6 | -24.70 | x | x | P | 2 |
| NGC 2824 | -2.0 | 312 | 310 | 56 3 | 61 1 | - | 61 1 | -22.90 | x | x | C | 1 |
| NGC 3032 | -1.9 | 143 | 150 | 36 6 | 35 3 | 46 11 | 35 3 | -22.00 | x | x | B | 3 |
| NGC 3182 | 0.4 | 218 | - | 39 5 | 35 3 | - | 35 3 | -23.20 | x | x | - | - |
| NGC 3489 | -1.2 | 292 | 240 | 62 2 | - | 56 15 | 62 2 | -23.00 | ? | x | P | 2 |
| NGC 3619 | -0.9 | 405 | - | 44 4 | 48 2 | - | 48 2 | -23.50 | x | x | - | - |
| NGC 3626 | -1.0 | 374 | 374 | 51 3 | 61 2 | 67 5 | 67 5 | -23.30 | x | x | C | 1 |
| NGC 3665 | -2.1 | 624 | 630 | 90 1 | 64 1 | 74 35 | 64 1 | -24.90 | x | x | C | 1 |
| NGC 4119 | -1.3 | 156 | 170 | 83 1 | 67 1 | 69 3 | 69 3 | -22.60 | ? | - | C | 1 |
| NGC 4150 | -2.1 | 234 | 238 | 50 3 | 54 2 | 54 3 | 54 3 | -21.60 | x | x | B | 3 |
| ⋆NGC 4292 | -1.7 | 187 | 190 | 49 3 | 50 2 | 46 14 | 50 2 | -21.54 | ? | x | C | 1 |
| ⋆NGC 4309 | -1.5 | 124 | - | 69 2 | 61 1 | - | 61 1 | -20.91 | - | - | - | - |
| NGC 4324 | -0.9 | 218 | 360 | 73 1 | 64 1 | 62 1 | 62 1 | -22.60 | ? | x | C | 1 |
| NGC 4429 | -1.1 | 499 | 532 | 68 2 | 68 1 | 60 16 | 68 1 | -24.30 | x | x | C | 1 |
| NGC 4435 | -2.1 | 405 | 380 | 48 4 | 52 2 | - | 52 2 | -23.80 | x | x | C | 1 |
| NGC 4459 | -1.4 | 391 | 400 | 43 4 | 46 2 | 47 2 | 47 2 | -23.90 | x | x | B | 3 |
| NGC 4477 | -1.9 | 204 | 260 | 36 6 | 26 5 | 38 3 | 38 3 | -23.70 | ? | x | P | 2 |
| NGC 4526 | -1.9 | 655 | 663 | 82 1 | 78 1 | 64 8 | 82 1 | -24.60 | x | x | B | 3 |
| NGC 4684 | -1.2 | 249 | - | 77 1 | - | - | 77 1 | -22.20 | ? | ? | - | - |
| NGC 4694 | -2.0 | 93 | 65 | 69 2 | - | - | 69 2 | -22.10 | - | - | C | 1 |
| NGC 4710 | -0.9 | 312 | 430 | 78 1 | 88 1 | 86 6 | 86 6 | -23.50 | x | x | C | 1 |
| NGC 4753 | -1.4 | 530 | - | 61 2 | 75 1 | - | 75 1 | -25.10 | x | x | - | 5 |
| NGC 5173 | -4.9 | 187 | - | 24 9 | - | - | 24 9 | -22.90 | x | x | - | - |
| NGC 5273 | -1.9 | 218 | - | 38 5 | 38 3 | - | 38 3 | -22.40 | x | x | - | - |
| NGC 5379 | -2.0 | 124 | 120 | 80 1 | 64 1 | - | 64 1 | -22.10 | - | - | C | 1 |
| NGC 6014 | -1.9 | 156 | 160 | 29 7 | 22 6 | 22 10 | 22 6 | -23.00 | x | x | C | 1 |
| NGC 7465 | -1.9 | 158 | 180 | 56 3 | 70 1 | 58 9 | 70 1 | -22.80 | x | - | C | 1 |
| PGC 29321 | 0.0 | 124 | - | 31 7 | 38 3 | - | 38 3 | -21.60 | - | - | - | - |
| PGC 56772 | -2.0 | 249 | - | 64 2 | 57 2 | - | 57 2 | -22.00 | ? | ? | - | - |
| PGC 58114 | -2.0 | 202 | 240 | 71 1 | - | 76 30 | 71 1 | -21.60 | - | x | C | 1 |
| PGC 61468 | 0.0 | 218 | - | 51 3 | - | - | 51 3 | -21.60 | ? | ? | - | - |
| UGC 05408 | -3.3 | 156 | - | 31 7 | - | - | 31 7 | -21.90 | x | x | - | - |
| UGC 06176 | -2.0 | 249 | 230 | 70 2 | 68 1 | - | 68 1 | -22.60 | ? | - | C | 1 |
| UGC 09519 | -1.9 | 187 | 210 | 47 4 | 41 3 | 63 7 | 41 3 | -22.10 | ? | x | C | 1 |
Notes: Column 1 lists the galaxy name. Galaxies with stars next to their name are early-types that were observed by Paper IV but are not included in the ATLAS3D sample. Column 2 contains the morphological -type from HyperLeda (Paturel et al., 2003). This morphology indicator was not used for the sample selection (see Paper I). Columns 3 and 4 list the velocity widths at 20% of the peak flux, derived from single-dish and interferometric data, respectively. The error in these quantities was estimated as half the velocity width of an individual channel, 15 km s-1. Column 5 contains the inclination derived from galaxy axial ratios. The quoted errors only take into account the error in the measurement of the optical axial ratio, as reported in NED. Column 6 contains the inclination derived from ellipse fitting to unsharp-masked dust images. The error is estimated to be 5% on the measurement of both the minor and major axes. Column 7 contains the inclinations estimated from tilted-ring fits to the interferometric datacubes, the errors on which are calculated as the maximum difference from the best value obtained when using only one half of the galaxy velocity field. Column 8 lists our adopted best inclinations, as described in Section 2.6.1. Column 9 contains the -band magnitudes from 2MASS (Skrutskie et al., 2006), converted to absolute magnitudes using the distance to each galaxy adopted for the ATLAS3D survey in Paper I. These distances are drawn preferentially from Mei et al. (2007) and Tonry et al. (2001). We assign to the absolute magnitudes an error of 0.1 mag, taking into account distance uncertainties, which completely overwhelm errors caused by the lack of an internal extinction correction. Columns 10 and 11 list the galaxies with boxy CO profiles, as determined from visual inspection of the single-dish spectra (Column 9), and a combination of single-dish and interferometric data where available (Column 11). A question mark indicates that with the respective data we are unable to determine if the profile is boxy, and hence do not include it. The telescope used to obtain the interferometric data is indicated in Column 12, where C = CARMA, P = PdBI, B = BIMA and O = OVRO. Column 13 lists the relevant references for the interferometric observations, and in two cases (NGC 2685 and NGC 4753) references for the inclination measurements. (1) Alatalo et al., (in preparation) (2) Crocker et al. (2010), (3) Young et al. (2008), (4) Józsa et al. (2009) and (5) Steiman-Cameron et al. (1992).
3 Comparison with other velocity measures
3.1 Model circular velocity curves
As alluded to in Section 2.6, it has yet to be established for a large sample of early-type galaxies that single-dish CO is a good tracer of the circular velocity. One would like to test this , and attempt to quantify the biases introduced by using the profile shape as a proxy for reaching beyond the peak of the circular velocity curve. As Williams et al. (2010) discuss, one must be careful when comparing velocity measures derived from different methods, as they are likely to have significant systematic differences. However, it is important to ascertain that the CO line-widths vary systematically, in a similar way to other rotation measures.
The gravitational potential of ETGs can also be significantly different from that of spirals. ETGs often have circular velocity profiles with high peaks at small radii that decline before flattening out. The W20 line-width is, in general, more sensitive to the peak velocity of the molecular gas, rather than the flat part of the rotation curve, unless the gas disk is sufficiently extended. This would lead to an overestimation of the velocity width. This problem has been discussed in detail by Noordermeer & Verheijen (2007), who find that using the HI peak velocity in massive early-type spirals results in an offset TFR. They report that the asymptotic velocity is a better measure of the total potential, and results in spirals of all masses lying on a single TFR.
An estimate of the amount by which we may be overestimating the velocity widths can be obtained using the circular velocity curves produced by Williams et al. (2009) from stellar dynamical modeling of their S0 galaxies. The median value of the circular velocity curve after the peak out to the maximum extent of the data, where the model is well constrained, is adopted as a measure of the velocity of its flat part (in the case of Williams et al. (2009) their data extends to 3 Re). When tested on the S0 circular velocity curves from Williams et al. (2009), this median performs well in picking out the velocity of the flat section. The mean ratio of the peak velocity to the flat velocity is 1.15, or 0.06 dex. When transformed to an offset in luminosity using the parameters of the best-fit S0 TFR of Williams et al. (2010), this effect corresponds to an offset of upto 0.5 mag at -band. This is approximately half of the 1 mag offset observed by various authors between the spiral and ETGs, and is thus significant if not properly accounted for.
In order to test the assumption that our ETGs with boxy profiles have gas distributions that reach beyond the peak of the circular velocity curve, and to see if our line-widths are overly sensitive to the peak velocity, like Williams et al. (2009, 2010) we utilize the axisymmetric Jeans anisotropic dynamical modeling (JAM) method described in Cappellari (2008). Some examples of the approach, using SAURON integral-field kinematics (Emsellem et al., 2004) as done here, are presented in Scott et al. (2009). For the ATLAS3D survey a Multi-Gaussian expansion (MGE; Emsellem et al., 1994) was fitted to the SDSS (Abazajian et al., 2009) or INT photometry (Scott et al. in preparation). The MGEs were then used to construct JAM models for all the 260 ATLAS3D galaxies (see Cappellari et al., 2010, a) which were fitted to the SAURON stellar kinematics (Paper I). The models have three free parameters, the inclination (), the mass-to-light ratio (M/L) assumed to be spatially constant, and the anisotropy , which is also assumed to be spatially constant. From each mass model we have calculated the predicted circular velocity curve in the plane of the galaxy. It is worth bearing in mind that, where the CO is misaligned from the plane of the galaxy, we are thus making implicit assumptions about the symmetry of the matter distribution. As these models include no dark matter, the circular velocity often declines at large radii, and one must be careful to measure the circular velocity at a suitable radius (i.e. where we have constraining data) when comparing to the observations.
Analysis of the ATLAS3D interferometric observations, presented in Davis et al., (in preparation), suggests that the average radial extent of CO discs in early-type galaxies is around one optical effective radius (the radius encompassing half of the light), hence the circular velocity measured at one effective radius (denoted VJAM,Re) is a sensible quantity to use for comparison. The effective radius used here is a combination of the values from 2MASS (Skrutskie et al., 2006) and RC3 (de Vaucouleurs et al., 1991), as described in Paper I. For galaxies where interferometric observations are available, we have also calculated the model circular velocity at the maximum extent of the CO, and denote this V. Both values can be found in Table 2.
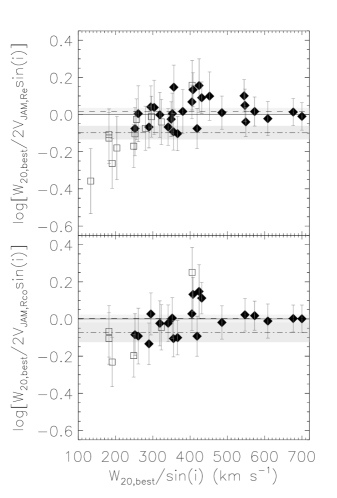
We compare the two model circular velocity measures described above with the measured CO line-widths in Figure 3. The line-widths of the galaxies with boxy CO profiles correlate well with the circular velocities measured at both one effective radius (Re) and the radius of maximum CO extent (RCO). The offset from VJAM,Re is 0.01 0.02 dex, the data points displaying an RMS scatter of 0.1 dex. The galaxies that do not have boxy CO profiles have line-widths systematically smaller than those predicted from the models in most cases, suggesting that their CO has been correctly identified as not reaching beyond the peak of the rotation curve. The comparison with VJAM,Rco, albeit with smaller number statistics, shows that the difference between the model and the CO line-widths is again consistent with the models, with a mean offset of 0.002 0.02 dex and a RMS scatter of 0.1 dex. There is no systematic behaviour in the residuals for the boxy galaxies in either plot. The galaxies that do not have boxy CO profiles are closer to the JAM model predictions, but do not lie on the one to one relation as expected, with a mean offset of -0.070.05 dex. This offset is likely because the CO is these objects is very compact, and beam effects mean the CO size is overestimated. The JAM model velocities have thus been estimated at the wrong radius. The one galaxy which does not have a boxy profile, but has a line-width larger than the predicted circular velocity, is NGC 1266, recently discovered to have a kiloparsec-scale molecular outflow (Alatalo et al., 2011).
To check if our line-widths are overly-sensitive to the peak of the rotation curve, we also extract from the JAM models the maximum of the circular velocity curve, denoted VJAM,max, and the median value of the circular velocity curve, measured between the peak and the maximum extent of the SAURON data (1Re), denoted VJAM,>peak. As discussed above, defining VJAM,>peak in this way picks out the value of the flat part of the rotation curve well in tests based on the data of Williams et al. (2009), which extend to 3 Re. Our data is only constrained out to around 1Re, but the rotation curves do not drop wildly in this region. It should however be noted that this measure may not be the same as the velocity measured at very large radii. The values of VJAM,max and VJAM,>peak can be found in Table 2.
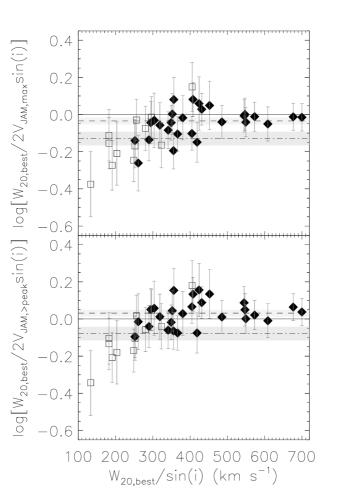
The top panel of Figure 4 shows a comparison between the observed CO line-widths, de-projected using dust inclinations (as described in Section 2.5.2), and VJAM,max. The CO line-widths are systematically smaller than the maximum of the circular velocity curve. The median peak of the JAM circular velocity curves is at 8.5′′, well within the single-dish beam, and hence we do not expect systematically missed emission to cause this trend. The mean offset from the maximum value is -0.03 0.02 dex, broadly similar to the offset between the maximum and the flat part of the circular velocity curve expected from the results of Williams et al. (2009). The RMS scatter around this value is 0.09 dex. This suggests that we are not overly sensitive to the peak of the circular velocity curve. The galaxies which do not have boxy profiles are again offset to much lower velocities. The only galaxy whose line-width is inconsistent with the maximum value of its predicted circular velocity curve is again NGC 1266.
The bottom panel of Figure 4 compares the observed CO line-widths, de-projected using dust inclinations, with VJAM,>peak. The CO measurements for galaxies with double horned profiles are, within the errors, consistent with the VJAM,>peak measure. The mean offset from this measure is 0.02 0.02 dex, with an RMS deviation of 0.1 dex. The galaxies that were not identified as boxy are on average offset from VJAM,>peak by -0.10.04 dex. There are several galaxies that do not have a boxy profile, but are consistent with rotating at VJAM,>peak. These galaxies are NGC 4684, PGC 56772 and PGC 61468, all of which have profiles which were hard to classify. If interferometric observations were available we would hence expect to find that the gas does indeed reach beyond the peak of the galaxy rotation curve in these systems.
Figures 3 and 4 demonstrate that, if one selects galaxies with boxy profiles, W20 velocity widths provide an good estimate of the circular velocity after the inner peak of the rotation curve, whether estimated as VJAM,Re or VJAM,>peak. It is worth mentioning that, for our sample, a simple cut excluding galaxies with CO linewidths 250km s-1 would have a similar effect as selecting by profile shape, removing most of the outliers. Applying an arbitrary cut in velocity, the most important TF parameter, could bias the derived TFR, especially for a sample selected in a different way, and hence we prefer selection by profile shape in this work.
| Galaxy | VJAM,Re | VJAM,Rco | VJAM,max | VJAM,>peak |
| (km s-1) | (km s-1) | (km s-1) | (km s-1) | |
| (1) | (2) | (3) | (4) | (5) |
| IC 0676 | 117 | 116 | 118 | 116 |
| IC 0719 | 232 | 232 | 233 | 218 |
| IC 1024 | 150 | 163 | 174 | 157 |
| IC 2099 | - | - | - | - |
| NGC 0524 | 337 | 362 | 368 | 337 |
| NGC 1222 | 177 | 177 | 236 | 177 |
| NGC 1266 | 141 | 116 | 144 | 134 |
| NGC 2685 | 160 | - | 186 | 160 |
| NGC 2764 | 199 | 190 | 207 | 196 |
| NGC 2768 | 320 | 325 | 342 | 311 |
| NGC 2824 | 220 | 220 | 278 | 206 |
| NGC 3032 | 129 | 158 | 238 | 135 |
| NGC 3182 | 183 | - | 198 | 178 |
| NGC 3489 | 169 | 197 | 198 | 159 |
| NGC 3619 | 216 | - | 277 | 223 |
| NGC 3626 | 173 | 187 | 256 | 174 |
| NGC 3665 | 358 | 354 | 362 | 321 |
| NGC 4150 | 134 | 141 | 163 | 131 |
| NGC 4270 | 185 | - | 193 | 182 |
| NGC 4292 | - | - | - | - |
| NGC 4309 | - | - | - | - |
| NGC 4324 | 150 | 152 | 169 | 150 |
| NGC 4429 | 276 | 276 | 294 | 273 |
| NGC 4435 | 237 | 263 | 266 | 237 |
| NGC 4459 | 244 | 261 | 273 | 244 |
| NGC 4477 | 249 | 278 | 295 | 249 |
| NGC 4526 | 328 | 338 | 348 | 292 |
| NGC 4684 | 136 | - | 137 | 123 |
| NGC 4694 | 96 | - | 99 | 93 |
| NGC 4710 | 175 | 161 | 202 | 176 |
| NGC 4753 | 301 | - | 302 | 274 |
| NGC 5173 | 180 | - | 202 | 166 |
| NGC 5273 | 127 | - | 148 | 125 |
| NGC 5379 | 152 | - | 158 | 147 |
| NGC 6014 | 148 | 149 | 185 | 148 |
| PGC 29321 | 154 | - | 165 | 154 |
| PGC 56772 | 152 | - | 153 | 133 |
| PGC 58114 | - | - | - | - |
| PGC 61468 | 166 | - | 166 | 160 |
| UGC 05408 | 139 | - | 163 | 133 |
| UGC 06176 | 184 | 196 | 219 | 184 |
| UGC 09519 | 160 | 165 | 182 | 155 |
Notes: This table contains the circular velocities derived from the JAM models, extracted at different radii. Galaxies that were removed from the ATLAS3D sample have no JAM model available. Column 2 contains the circular velocities extracted at one effective radius. Column 3 contains the circular velocities extracted at the maximum radial extent of the CO, or 12′′, whichever is smaller. Galaxies without interferometric observations are not included. Column 4 contains the maximum circular velocity. Column 5 contains the median of velocities after the peak in the circular velocity curve out to the maximum radius at which the model is constrained by the observational data. Some galaxies had insufficient data to constrain such a median between these two points, and are excluded. The error on these JAM velocities is estimated to be 8%. This is a combination of an average 5% error in the observed stellar velocity dispersion constraining the models, and model errors of 6% (Cappellari et al., 2006). This does not include errors in inclination, which are harder to quantify.
3.2 HI line-widths
Morganti et al. (2006) and Williams et al. (2010) have shown that in some cases HI line-widths are not a good measure of the circular velocity for early-type galaxies. We examine this here by retrieving archival HI single-dish line-widths measured at 20% of the peak flux from HyperLEDA (Paturel et al., 2003, denoted W20,HI).
In Figure 5, we compare the single-dish HI line-widths to twice the projected JAM circular velocities measured at Re (top panel) and the observed CO line-widths (bottom panel). All galaxies from our sample with archival HI data at the time of retrieval are included. We find that although the average difference between the HI line-width and the JAM circular velocities is small (0.02 dex), the scatter is large (RMS scatter of 0.11 dex), and the single-dish HI line-widths do not correlate statistically with the galaxy luminosity. The same is true when one compares with observed CO line-widths, with a larger scatter (0.15 dex). There is also a systematic trend in the residuals in the bottom panel of Fig. 5, where the galaxies with high CO rotation velocities, which are likely of high masses, have systematically smaller HI line-widths.
Figure 5 suggests that some of the detected HI sources, at high CO velocities (and hence likely at high mass), are either not related to the galaxy under study or that the HI has been kinematically disturbed. This is consistent with the results of Morganti et al. (2006), Williams et al. (2010) and Serra et al., (in preparation).
Single-dish HI Line-widths in the LEDA database are however known to suffer from many issues, including major problems with source confusion. Outer HI disks are also usually warped with respect to the inner regions, and hence a simple inclination estimates from optical images will be insufficient. Interferometric HI data allows one to identify relaxed disks, and in these rotation and the TFR can be studied (e.g. Morganti et al., 2006; Oosterloo et al., 2007; Weijmans et al., 2008; Oosterloo et al., 2010). To further investigate the TFR, and the disk-halo consipracy in these galaxies, a future paper in this series will study the HI TFR of ETGs at large radii using superior interferometric HI data.
4 Results
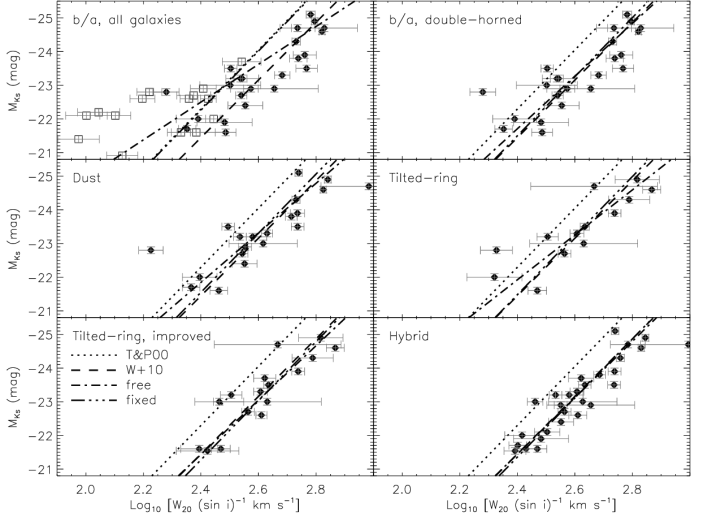
Using the data presented in Table 1, we construct a series of Tully-Fisher relations to explore the effect of the different inclination and velocity measurements, defined in order of increasing complexity. The results are shown in Figure 6. The general form of the band Tully-Fisher relation we have adopted is
| (2) |
where a is the slope and b is the zero-point of the relation.
The package MPFIT (Markwardt, 2009) was used to fit the inverse of Equation 2 (regressing the observed rotation velocities) with the addition of an intrinsic scatter, which we iteratively adjust to ensure a reduced . Full details of the fitting procedure can be found in Williams et al. (2010).
Each plot in Figure 6 shows two best-fit lines. For the first we allow both the intercept and slope to vary, while for the second we fix the slope to that found by Tully & Pierce (2000), a = -8.78. For reference we also plot the -band spiral galaxy TFR of Tully & Pierce (2000) (see Equation 3), which was constructed using HI line-widths of spiral galaxies in 12 well separated clusters, and the -band S0 TFR from Williams et al. (2010) (see Equation 4), which was derived from Jeans modeling of major-axis stellar kinematics from 14 edge-on S0 galaxies:
| (3) |
| (4) |
4.1 CO Tully-Fisher relations
4.1.1 Inclinations from galaxy axial ratios
The CO TFR de-projected using is presented in the top two panels of Figure 6. The parameters of the best-fit relations are listed in Table 3. The top-left panel shows all galaxies, with open squares for those which do not show a boxy CO profile or where the profile shape is unclear, and solid triangles for those with clear boxy profiles. Only a loose correlation is observed, with clear outliers, almost all of which are galaxies without double horned profiles. A much tighter correlation is observed once one removes galaxies with non-boxy profiles, as shown in the top-right panel. This is physically motivated, as we believe the gas in these galaxies does not reach beyond the peak of the rotation curve. Once the non-doubled-horned galaxies are removed both best-fit lines agree within the errors with the TFR of Williams et al. (2010), providing strong a posteriori evidence that the CO in these galaxies does trace the circular velocity in a way that is consistent with dynamical models. The remaining outlier is NGC 7465 which we will discuss in more detail below. If this outlier is removed the best fit relation follows that of Williams et al. (2010) even more closely. The intrinsic scatter of the best fit relation with a free, and a constrained, slope is respectively 0.57 and 0.63 mag, with total RMS scatters of 0.69 and 0.78 mag.
4.1.2 Inclinations from dust axial ratios
In a similar way we can construct a TFR using the inclinations derived from fitting ellipses to the dust distributions highlighted in unsharp-masked images. The CO TFR deprojected using is presented in the middle-left panel of Figure 6. Once again, within the quoted errors, the best-fit relations are consistent with the result of Williams et al. (2010). The parameters of the best-fit relations are listed in Table 3. The intrinsic scatter of the best-fit relation with a free, and a constrained, slope is 0.65 and 0.78 mag respectively, but with a total scatter of 0.75 and 0.94 mag, respectively. The outlier is NGC 7465 - without this galaxies the observed intrinsic scatter in the unconstrained fit decreases to 0.46 mag, with a total scatter of 0.6 mag, confirming the visual impression that the correlation using dust inclinations is tighter. Removing this galaxy also improves the agreement between our best-fit slope with that found by Williams et al. (2010).
4.1.3 Inclination from molecular gas modeling
Using the inclinations from the tilted-ring models and the total velocity widths calculated from the interferometric data, we can construct yet another TFR. First we do this naively, using only the single-dish boxy classifications. This results in the middle-right panel of Figure 6. Some of the interferometric observations have insufficient spatial resolution to strongly constrain the inclination of the molecular gas, and this is reflected in the error bars. As can clearly be seen in this panel, the best-fit relation is only marginally consistent with that of Williams et al. (2010). The intrinsic scatter of the best-fit relation with a free, and a constrained, slope is 0.43 and 0.62 mag, with a total scatter of 0.60 and 0.82 mag, respectively.
The interferometric data, at least in some cases, allow us to further refine our technique for identifying galaxies that have reached beyond the peak of the circular velocity curve, by identifying nuclear rings and finding galaxies where a turnover can be seen in the position-velocity diagram. Interferometric observations are especially powerful in this regard, as the extent of the CO can be compared to the expected circular velocity curve from dynamical models. For example, NGC 7465, the obvious outlier in the previous plots, features a misaligned circum-nuclear CO distribution, which has a double horned profile, but has no turnover in its velocity field, and is extremely unlikely to reach beyond the peak of the galaxy rotation curve.
Aperture synthesis observations also allow us to identify cases where a galaxy is misclassified using the single-dish data because a pointing error and/or extended molecular gas results in only some smaller portion of the total velocity width being detected. Such cases include NGC 4324, NGC 4477 and PGC 58114. In a few cases where the profile shape was uncertain (due to low signal to noise single dish spectra) the interferometric data reveals that the gas does extend beyond the peak of the rotation curve, allowing us to include them. This is the case for NGC 3489, NGC 4292 and UGC 09519.
The TFR in the middle-right panel of Figure 6 can thus be improved using the full knowledge gained from the interferometric data (discussed above), and this results in the TFR shown in the bottom-left panel of Figure 6. The best-fit TFR using this additional information agrees with that of Williams et al. (2010). The parameters of the best-fit relations are again listed in Table 3. The intrinsic scatter of the best-fit relation with a free, and a constrained, slope is 0.32 and 0.33 mag, with total a scatter of 0.54 and 0.58 mag, respectively.
4.1.4 Combining interferometric and single-dish data
Finally, we can combine our single-dish and interferometric observations, using the hybrid inclinations and velocities described in Section 2.6.1. These choices lead to the TFR shown in the bottom-right panel of Figure 6. The parameters of the best-fit TF relations are listed in Table 3. The best-fit relations closely agree with the result of Williams et al. (2010), and the fits with a free and a constrained slope have an intrinsic scatter of 0.36 and 0.37 mag, with a total scatter of 0.54 and 0.57 mag, respectively. The intrinsic scatter found in this relation is similar to that found by a large study of the intrinsic scatter of the spiral galaxy TFR ( mag at bands between and ; Pizagno et al., 2007), and only very slightly larger than that found by Williams et al. (2010) ( mag at -band). The small total scatter reflects both the better number statistics and the use of the best possible measures of rotation and inclination.
Using this hybrid relation we can investigate if the residuals have any systematic behavior with respect to the properties of the hosts. We find that the residuals are statistically uncorrelated with the galaxy -band luminosity (Skrutskie et al., 2006), optical colour (-; Adelman-McCarthy et al., 2008, Scott et al., in preparation), velocity dispersion, galaxy total dynamical mass (Cappellari et al. in preparation) and spin parameter (Emsellem et al., 2010, Paper III)
| Inc. method | a (mag) | b (mag) | (mag) | (mag) | W20,sd | W20,inter | Selection |
|---|---|---|---|---|---|---|---|
| (1) | (2) | (3) | (4) | (5) | (6) | (7) | (8) |
| Stellar / | -5.61 0.71 | -23.62 0.16 | 0.75 | 0.82 | x | - | none |
| Stellar / | - | -24.01 0.23 | 1.30 | 1.42 | x | - | none |
| Stellar / | -7.82 1.12 | -23.27 0.15 | 0.60 | 0.69 | x | - | SD |
| Stellar / | - | -23.25 0.16 | 0.66 | 0.78 | x | - | SD |
| Dust | -7.36 1.19 | -23.31 0.16 | 0.66 | 0.76 | x | - | SD |
| Dust | - | -23.30 0.19 | 0.79 | 0.94 | x | - | SD |
| Tilted-ring | -6.68 1.21 | -23.26 0.17 | 0.48 | 0.63 | - | x | SD |
| Tilted-ring | - | -23.23 0.23 | 0.65 | 0.86 | - | x | SD |
| Tilted-ring | -8.07 1.10 | -23.05 0.12 | 0.32 | 0.54 | - | x | Inter |
| Tilted-ring | - | -23.03 0.13 | 0.33 | 0.58 | - | x | Inter |
| Hybrid | -8.38 0.70 | -23.12 0.09 | 0.36 | 0.54 | x | x | Inter+SD |
| Hybrid | - | -23.11 0.09 | 0.37 | 0.57 | x | x | Inter+SD |
Notes: Column 1 describes the inclination method used to deproject the measured line-width. Columns 2 and 3 show the best-fit slope and zero-point, respectively, of the Tully-Fisher relation of the form . Where Column 2 is blank the fit was constrained to have the same slope as that found by Tully & Pierce (2000), a=-8.78. Column 4 shows the intrinsic scatter () required by the fit to produce a reduced . Column 5 shows the total RMS scatter around the best-fit relation. A cross in Column 6 denotes that the velocity widths used are from single-dish data, while a cross in Column 7 denotes that interferometric line-widths were used. Column 8 lists the selection method used to find galaxies that have gas beyond the peak of the circular velocity curve. ‘SD’ means the galaxies single-dish profiles are boxy, while ‘Inter’ means that interferometric data were used to determine if the gas reaches beyond the peak of the circular velocity curve. The hybrid relations use both single-dish and interferometric data, as described in Section 2.6.1.
5 Discussion
5.1 CO as a tracer of galactic potentials
The results presented in Section 3.1 show that CO emission accurately traces the potential of early-type galaxies, if one has a suitable method of identifying which galaxies have extended molecular discs. Our work demonstrates that selecting galaxies via profile shape is robust and does not systematically affect the measured rotation velocity. The main possible contaminant introduced by this selection is galaxies that have molecular rings, which would display a boxy profile without necessarily rotating at Vflat. Circumnuclear rings pose the greatest problem, as they are very unlikely to rotate at Vflat, unlike inner and outer rings which are located at resonance points within the flat part of the galaxy circular velocity curve (e.g. Buta, 1986). The number of galaxies with circumnuclear rings in our sample is likely to be small, as their presence in significant numbers would bias the best-fit line in Figure 3 to small values. This conclusion is also supported by the interferometric survey of Alatalo et al., (in preparation), which suggests that only a small percentage of local early-type galaxies have their molecular gas restricted to the circumnuclear region.
One should also remember that the circular velocity curves of ETGs rise very quickly, normally peaking within one effective radius (e.g. Williams et al., 2009). This allows the molecular distribution to be compact, but still have enough gas beyond the peak of the galaxy circular velocity curve so that the linewidth is a good proxy of the circular velocity in that region. The good agreement between our derived TFR and that of Williams et al. (2010) suggests that the disk-halo conspiracy holds for our early-type galaxies, at least out to 3Re. If this conspiracy holds even further out into the dark matter dominated parts of these galaxies (which some authors suggest it does not, e.g. Dutton et al., 2010) will be considered in a future paper in this series.
5.2 Inclination measures
The problem of measuring the inclination of early-type galaxies is not new, but it is complicated here as the CO is often not aligned with the stars (e.g. Young, 2002; Schinnerer & Scoville, 2002; Young et al., 2008; Crocker et al., 2008; Crocker et al., 2009; Crocker et al., 2010), and it is the CO inclination that we require. As we have shown, methods using galaxy optical axis ratios are likely to yield large uncertainties and increase the scatter in the TFR, but they do not seem to significantly affect the determination of its slope or zero-point. This is likely because errors in inclination are most problematic when the galaxy is close to face-on, and the number of nearly face-on galaxies in our sample is small. The profile shape selection criterion also actively selects against face-on galaxies, where the velocity width is less than a few channel widths (no matter how extended the molecular gas is). In many HI TFR papers, galaxies with an inclination less than 45∘ are discarded (e.g. Tully & Fisher, 1977), so this is not especially worrying. If we apply this cut in inclination to our sample, we retain within the errors the same Tully-Fisher slope and zero-point, and the RMS scatter decreases. Even with a very harsh cut of 65∘ we retain the same relation. This demonstrates that our results are robust, and the slope and zero-point are minimally affected by the choice of inclination correction.
As hinted above, while the slope and zero-point are robust, the scatter in the relation is affected by the inclination estimation method chosen. Moving from galaxy axial ratios to inclinations derived from dust features decreases the RMS scatter around the best-fit relation by 0.15 mag, if one removes the one obvious outlier. Our results do reveal a reduction of the total scatter when the inclinations are determined from fitting a thin disc model to interferometric data, despite our limited number statistics. With a larger sample one might expect the scatter to decrease further. In both cases the decrease in scatter is likely due to properly accounting for molecular gas distributions that do not rotate in the same plane as the stars. Unsurprisingly, to obtain the tightest relation one must use measures of inclination (such as unsharp-masked dust images or interferometric imaging of the molecular gas itself) that truly trace the inclination of the gaseous component.
5.3 Intrinsic scatter of the CO TFR
The intrinsic scatter of our hybrid TFR is 0.36 mag, broadly consistent with typical values found in dedicated studies of the spiral galaxy TFR in the optical, such as those by Pizagno et al. (2007) (0.4 mag at - and -band) and Kannappan et al. (2002) (0.4 mag at -band). Our intrinsic scatter is slightly larger than that found for S0 galaxies by Williams et al. (2010) (0.3 mag at -band). One reason for the increased scatter may be that Williams et al. (2010) considered S0 galaxies only, whereas our sample includes both morphologically classified elliptical and S0 galaxies, that span a wider range in , the stellar specific angular momentum (Emsellem et al., 2007). This increased scatter may therefore be due to spanning an increased range in internal dynamics.
We do not have sufficient number statistics to constrain an elliptical galaxy TFR separately, but the earliest type galaxies (selected by optical morphology) do lie on average to the faster and/or dimmer side of our relations. There is however no systematic behavior within the residuals to the fit as a function of .
5.4 Offset from the spiral TFR
Exploring changes in the M/L of galaxies as a function of morphological type is one of the main motivations for studying the early-type TFR. Williams et al. (2010) have highlighted the importance of comparing TFRs for each morphological type derived using the same tracer and methods, in order to minimize systematic differences. In this spirit we use the spiral galaxy line-widths published by Chung et al. (2009), measured from on-the-fly mapping of 18 Virgo Cluster members, in order to define a spiral CO TFR.
We construct a Tully-Fisher relation for the Chung et al. (2009) spirals in the same way as for our early-type sample, using 2MASS magnitudes and their W20 line-widths corrected for inclination. These inclinations were derived from the galaxy axial ratio and the morphological type using the classical Hubble formula from Hubble (1926). This formula effectively differs from Equation 2.5.1 by making a function of morphological type. For spiral galaxies such as those in the Chung et al. (2009) sample this correction is small, corresponding to a less than 0.05, and hence this difference is unlikely to systematically effect the comparison of our results. We differ from Chung et al. (2009) however by not assuming a set distance to the Virgo Cluster, which has significant substructure. Instead we use the distance to each galaxy as determined for the ATLAS3D parent sample (Paper I). The resulting TFR is shown in Figure 7. The values used to create this figure are listed in Table 4.
| Galaxy | Type | Distance | mKs | W20 | |
|---|---|---|---|---|---|
| (Mpc) | (mag) | (deg) | (km s-1) | ||
| (1) | (2) | (3) | (4) | (5) | (6) |
| NGC 4254 | Sc | 16.5 | 6.93 | 29 7.3 | 221 1 |
| NGC 4298 | Sc | 16.5 | 8.47 | 59 2.4 | 270 4 |
| NGC 4302 | Sc | 14 | 7.83 | 90 0.1 | 353 1 |
| NGC 4303 | Sc | 16.5 | 6.84 | 19 12. | 162 2 |
| NGC 4321 | Sc | 15.85 | 6.59 | 38 5.2 | 239 2 |
| NGC 4402 | Sc | 16.5 | 8.49 | 80 0.7 | 267 3 |
| NGC 4419 | Sa | 13.12 | 7.74 | 82 0.6 | 318 2 |
| NGC 4438 | Sb | 16.5 | 7.27 | 87 0.2 | 272 5 |
| NGC 4501 | Sbc | 15.3 | 6.27 | 60 2.3 | 518 2 |
| NGC 4527 | Sb | 14.05 | 6.93 | 75 1.1 | 376 2 |
| NGC 4535 | Sc | 15.75 | 7.38 | 41 4.7 | 252 5 |
| NGC 4536 | Sc | 14.09 | 7.52 | 59 2.4 | 318 2 |
| NGC 4548 | Sb | 18.71 | 7.12 | 35 5.8 | 234 6 |
| NGC 4569 | Sab | 16.5 | 6.58 | 69 1.6 | 311 1 |
| NGC 4579 | Sab | 21.3 | 6.49 | 39 5.0 | 329 1 |
| NGC 4647 | Sc | 16.5 | 8.05 | 34 6.0 | 156 1 |
| NGC 4654 | Sc | 16.5 | 7.74 | 58 2.5 | 285 1 |
| NGC 4689 | Sc | 16.5 | 7.96 | 39 5.0 | 182 1 |
Notes: The galaxy sample listed in Column 1 comes from Chung et al. (2009). Column 2 lists the spiral galaxy type following the Hubble scheme, (RC3; de Vaucouleurs et al., 1991). The distance to the galaxy in Column 3 is from the ATLAS3D parent sample (Paper I). These distances are drawn preferentially from Mei et al. (2007) and Tonry et al. (2001). Column 4 lists the apparent -band magnitudes, taken from 2MASS. Column 5 is the optical galaxy axis ratio, taken from NED, as described in Section 2.5.1. The line-widths in Column 6 are taken directly from Chung et al. (2009).
The best-fit spiral TFR with an unconstrained gradient is
| (5) |
where the intrinsic scatter about the correlation is 0.68 mag, with a total scatter of 0.72 mag. The TFR obtained by constraining the fit to have the same slope as that of Tully & Pierce (2000) is
| (6) |
with an intrinsic scatter of 0.55 mag and a total scatter of 0.59 mag.
Within observational errors, the best-fit free and constrained spiral CO TFRs are consistent with the relation of Tully & Pierce (2000). The offset between the unconstrained Chung et al. (2009) spiral CO TFR and the hybrid early-type CO TFR (discussed in Section 4.1.4) is 0.98 0.22 mag, consistent within errors with the value found by Bedregal et al. (2006) and the offset found by Williams et al. (2010) between their S0 TFR and the Tully & Pierce (2000) relation.
This result is nevertheless surprising since Williams et al. (2010) argue that their offset with Tully & Pierce (2000) is flawed by systematic effects (the tracers and methods being different), and they prefer the much smaller offset (0.5 0.14 mag) from their spiral galaxy sample treated identically to the S0s.
It is not immediately clear how our own result can be reconciled with this, as we use identical tracers and methods as Chung et al. (2009). However, we suspect that the different results are due to the mix of morphological types in the spiral samples. Williams et al. (2010) use a spiral sample consisting mostly of Sa-Sb spirals, while the sample of Chung et al. (2009) includes a larger fraction of later-type galaxies (mostly Sc), which are known to have a larger zero-point (e.g. Roberts, 1978; Rubin et al., 1985; Masters et al., 2008; Shen et al., 2009). Separating the Chung et al. (2009) sample more finely into morphological types does not necessarily support this explanation, but the number statistics are very limited.

5.5 Origin of the offset TFR for ETGs
In the ETG sample used in this paper, a few galaxies are consistent with the spiral galaxy relation and many lie between the spiral and early-type relations, consistent with the predictions of passive fading models (e.g. Dressler, 1980; Dressler et al., 1997). The fact that molecular gas is present in all these galaxies, however, suggests that many must have ongoing star formation (even if weak), and hence evolutionary models relying on a purely passive evolution are ruled out.
The presence of molecular gas mass fractions ranging from 0.1 to 5% in these galaxies perhaps suggests an answer to some of the problems with passive evolution models. Bedregal et al. (2006) and Williams et al. (2010) both discuss the timescale implied by the ETG-spiral TFR offsets observed, assuming passive fading, and find it uncomfortably short and inconsistent between the and bands. The presence of low levels of residual star formation would prolong the period it takes for galaxies to fade, and would contribute relatively more light at blue wavelengths than in the infrared. The molecular gas mass fraction in these galaxies is however small , so it is unclear if such a low mass fraction of young stars could extend the fading timescale sufficiently.
An alternative explanation of the TFR offset is that the morphological (and luminosity) evolution is accompanied by a change in the size of the galaxies, affecting the galaxy rotation rather than its luminosity. Williams et al. (2010) suggest that a systematic contraction as spirals transform into S0s, consistent with the trend with morphological type of the size-luminosity relation (Courteau et al., 2007), could explain the offset from the spiral TFR. Clearly, a combination of both effects is also possible.
5.6 High-mass end of the CO TFR
As discussed in the introduction, one motivation for studying the CO TFR is the ability to probe the full mass range of galaxies, from small disc galaxies to large spheriods, with the same tracer and hence with the same assumptions and systematics. As an example of the power of this approach, we can investigate if our sample shows any evidence of a change in the slope of the TFR at the high-mass end, as reported by some authors (e.g. Peletier & Willner, 1993; Verheijen, 2001; Noordermeer & Verheijen, 2007).
Our sample contains eight galaxies above the luminosity threshold suggested in previous works (MKs -23.75). As can be seen in the bottom-right panel of Figure 6, all but one of these systems are on, or to the right of, the best-fit relation for the whole sample. When one compares the best-fit TFR derived for the whole sample to that for just the fainter galaxies (MKs -23.75), there is a small difference in the gradient and zero-point, in the direction found by other authors. We do not have the number statistics to properly investigate the size of this effect, however, and hence only conclude that our results are consistent with the presence of a different slope at the high-mass end of the TFR.
5.7 Single-dish vs aperture synthesis
We have demonstrated in this work that single-dish spectra are sufficient to construct a robust CO Tully-Fisher relation, and that galaxy inclinations can be taken from optical imaging without noticeably biasing its slope or zero-point (Section 5.2). However, one must exercise caution, as the small beams of millimeter telescopes can occasionally underestimate the line-widths of galaxies with extended molecular discs. Barring beam dilution effects, one would expect single-dish profiles to perform even better at higher redshifts, where the angular size of the target galaxies decreases. One caveat to this is that as the angular size of galaxies decreases, source confusion may become a problem.
Naively, interferometric observations should be the best way to obtain an estimate of the true inclination of the molecular gas, and hence reduce the artificial scatter in the TFR. Aperture synthesis observations also tend to have a large field of view, and are thus less likely to face problems with extended gas distributions. Interferometric observations do, however, usually require a larger investment of observing time per source. One must also choose the angular resolution of the data carefully, in order to avoid resolving out the most extended structures, while still having sufficient spatial information to constrain a tilted-ring model. Both single-dish and interferometric studies of the TFR should thus have a bright future.
6 Conclusions and Future Prospects
In this paper we have presented the first CO Tully-Fisher relation for early-type galaxies. We have shown that CO line widths are a reliable tracer of the circular velocity in fast-rotating ETGs, and relations derived in this way agree well with ETG TFRs derived by other authors. We showed that our CO TFR relation has a robust slope and zero point, and a comparable scatter to that of TFRs derived with other techniques. The power of the CO Tully-Fisher relation is the ability to perform the same analysis easily for both spiral and early-type galaxies (i.e. identical tracer and method), with purely observable quantities. This technique is therefore particularly suitable for comparing the morphological variations of the zero-point of the Tully-Fisher relation.
The results presented in this paper show that early-type galaxies follow a TFR that is offset by nearly one magnitude at -band from that of spiral galaxies. This offset is similar to that found by previous authors. An offset ETG TFR is usually thought to be caused by passive evolution of spiral galaxies into lenticulars, after an abrupt cessation of star formation. However, the presence of molecular gas in these ETGs suggests that the majority of this sample must have ongoing residual star-formation, such as that revealed in a subsample of these galaxies (e.g. Temi et al., 2009; Shapiro et al., 2010; Crocker et al., 2010). This should increase the timescale to fade by the required 1 mag. Some models, such as those that involve a change in the size of galaxies as they transform, do not require star formation to completely cease, providing an alternative explanation that is fully consistent with our data. Unfortunately the low molecular gas fractions in our systems make drawing any firm conclusions difficult.
Another area where the CO TFR (for all spectral types) excels is the ability to extend the technique to higher redshifts, as discussed in Tutui et al. (2001). HI observations are currently limited to 0.2 (e.g. Catinella, 2008), and stellar kinematics to 2 (e.g. van Dokkum et al., 2009; Cappellari et al., 2009; Cenarro & Trujillo, 2009) whereas CO has already been detected in galaxies at redshifts 6 (e.g. Walter et al., 2004). The molecular content of galaxies is also expected to increase with redshift, while the HI content stays approximately constant (Obreschkow & Rawlings, 2009; Bauermeister et al., 2009; Daddi et al., 2010; Tacconi et al., 2010). CO velocity fields can be resolved, and the rotation (and hence the dynamical mass) estimated even out to high redshift (e.g. Walter et al., 2004; Carilli et al., 2010). This raises the exciting prospect of being able to directly track the mass-to-light ratio evolution of galaxies as a function of both redshift and mophological type, using an easily observable tracer (and without requiring dynamical modeling). New optical/IR instrumentation is just starting to allow surveys of galaxy stellar kinematics out to z 2 (e.g. Cappellari et al., 2009; Förster-Schreiber et al., 2009), and comparison of these samples to line-widths derived with CO is a promising immediate avenue for future studies of the TFR.
Tutui et al. (2001) showed that constructing a (spiral galaxy) CO TFR is already possible at up to redshifts z0.1, but with the next generation of mm-wave telescopes due to enter service over the next few years, we should gain access to CO lines across the redshifted universe for all morphological types. The Redshift Receiver System (RRS) on the Large Millimeter Telescope (LMT), for instance, is optimized for the detection of redshifted transitions of the CO ladder from star-forming galaxies at cosmological distances, and will generate a large database of CO line-widths. If one is able to optically image these galaxies to estimate their inclination and morphology, then this will become an excellent resource for Tully-Fisher analyses. With the ability to detect spectral line emission from CO in a galaxy like the Milky Way at a z3 in less than 24 hours, ALMA will also be in an excellent position to study the CO TFR at high redshift. The higher frequency bands that will be available at ALMA also open up the possibility of detecting [CII] emission (rest wavelength 158 m), which is brighter than CO in many galaxies in the local universe (Crawford et al., 1985) and possibly enhanced further at high redshifts (Maiolino et al., 2009). [CII] may therefore become an important tracer of the circular velocity of high-redshift systems.
Although technical aspects will certainly be improved and the interpretation of this relation remains uncertain, we have shown that the ETG CO TFR is a tantalising and promising tool for galaxy evolution.
Acknowledgements
TAD wishes to thank Gyula Jozsa for help and advice regarding the TiRiFiC package and Michael Williams for useful discussions and for providing his TFR fitting code. TAD and NS are supported by an STFC Postgraduate Studentship. MC acknowledges support from a STFC Advanced Fellowship (PP/D005574/1) and a Royal Society University Research Fellowship. This work was supported by the rolling grants ‘Astrophysics at Oxford’ PP/E001114/1 and ST/H002456/1 and visitors grants PPA/V/S/2002/00553, PP/E001564/1 and ST/H504862/1 from the UK Research Councils. RLD acknowledges travel and computer grants from Christ Church, Oxford and support from the Royal Society in the form of a Wolfson Merit Award 502011.K502/jd. RLD also acknowledges the support of the ESO Visitor Programme which funded a 3 month stay in 2010. RMcD is supported by the Gemini Observatory, which is operated by the Association of Universities for Research in Astronomy, Inc., on behalf of the international Gemini partnership of Argentina, Australia, Brazil, Canada, Chile, the United Kingdom, and the United States of America. SK acknowledges support from the the Royal Society Joint Projects Grant JP0869822. TN and MBois acknowledge support from the DFG Cluster of Excellence ‘Origin and Structure of the Universe’. MS acknowledges support from a STFC Advanced Fellowship ST/F009186/1. The authors acknowledge financial support from ESO. This paper is partly based on observations carried out with the IRAM 30m telescope. IRAM is supported by INSU/CNRS (France), MPG (Germany) and ING (Spain). Support for CARMA construction was derived from the states of California, Illinois and Maryland, the James S. McDonnell Foundation, the Gordon and Betty Moore Foundation, the Kenneth T. and Eileen L. Norris Foundation, the University of Chicago, the Associates of the California Institute of Technology and the National Science Foundation. Ongoing CARMA development and operations are supported by the National Science Foundation under a cooperative agreement, and by the CARMA partner universities. We acknowledge use of the HYPERLEDA database (http://leda.univ-lyon1.fr) and the NASA/IPAC Extragalactic Database (NED) which is operated by the Jet Propulsion Laboratory, California Institute of Technology, under contract with the National Aeronautics and Space Administration. This publication makes use of data products from the Two Micron All Sky Survey, which is a joint project of the University of Massachusetts and the Infrared Processing and Analysis Center/California Institute of Technology, funded by the National Aeronautics and Space Administration and the National Science Foundation.
References
- Abazajian et al. (2009) Abazajian K. N., Adelman-McCarthy J. K., Agüeros M. A., Allam S. S., Allende Prieto C., An D., Anderson K. S. J. et al. 2009, ApJS, 182, 543
- Adelman-McCarthy et al. (2008) Adelman-McCarthy J. K., Agüeros M. A., Allam S. S., Prieto C. A., Anderson K. S. J., Anderson S. F., Annis J., Bahcall N. A. et al., 2008, ApJS, 175, 297
- Alatalo et al. (2011) Alatalo K., Blitz L., et al 2011, ApJ
- Bauermeister et al. (2009) Bauermeister A., Blitz L., Ma C.-P., 2009, eprint arXiv, 0909, 3840
- Bedregal et al. (2006) Bedregal A. G., Aragón-Salamanca A., Merrifield M. R., 2006, MNRAS, 373, 1125
- Bell & de Jong (2001) Bell E. F., de Jong R. S., 2001, ApJ, 550, 212
- Bertola et al. (1995) Bertola F., Cinzano P., Corsini E. M., Rix H.-W., Zeilinger W. W., 1995, ApJ Letters v.448, 448, L13
- Bock et al. (2006) Bock D. C.-J., Bolatto A. D., Hawkins D. W., Kemball A. J., Lamb J. W., Plambeck R. L., Pound M. W., Scott S. L. et al., 2006, Ground-based and Airborne Telescopes. Proc. SPIE, 6267, 13
- Buta (1986) Buta R., 1986, ApJ Supplement v.61, 61, 631
- Cappellari (2008) Cappellari M., 2008, MNRAS, 390, 71
- Cappellari et al. (2006) Cappellari M., Bacon R., Bureau M., Damen M. C., Davies R. L., de Zeeuw P. T., Emsellem E., Falcón-Barroso J. et al., 2006, MNRAS, 366, 1126
- Cappellari et al. (2009) Cappellari M., di Serego Alighieri S., Cimatti A., Daddi E., Renzini A., Kurk J. D., Cassata P., Dickinson M. et al., 2009, ApJ Letters, 704, L34
- Cappellari et al. (2011) Cappellari M., Emsellem E., Krajnovic D., McDermid R. M., Scott N., Kleijn G. A. V., Young L. M., Alatalo K., Bacon R. et al., et al. 2011, in press, (arXiv:1012.1551) (Paper I), 1012, 1551
- Cappellari et al. (2010) Cappellari M., Scott N., Alatalo K., Blitz L., Bois M., Bournaud F., Bureau M., Davies R. L. et. al., 2010, Highlights of Astronomy, 15, 81
- Carilli et al. (2010) Carilli C. L., Daddi E., Riechers D., Walter F., Weiss A., Dannerbauer H., Morrison G. E. et al., 2010, ApJ, 714, 1407
- Catinella (2008) Catinella B., 2008, The evolution of galaxies through the neutral hydrogen window. AIP Conference Proceedings, 1035, 186
- Cenarro & Trujillo (2009) Cenarro A. J., Trujillo I., 2009, ApJ Letters, 696, L43
- Christodoulou et al. (1988) Christodoulou D. M., Tohline J. E., Steiman-Cameron T. Y., 1988, AJ, 96, 1307
- Chung et al. (2009) Chung E. J., Rhee M.-H., Kim H., Yun M. S., Heyer M., Young J. S., 2009, ApJS, 184, 199
- Courteau et al. (2007) Courteau S., Dutton A. A., van den Bosch F. C., MacArthur L. A., Dekel A., McIntosh D. H., Dale D. A., 2007, ApJ, 671, 203
- Crawford et al. (1985) Crawford M. K., Genzel R., Townes C. H., Watson D. M., 1985, ApJ, 291, 755
- Crocker et al. (2008) Crocker A. F., Bureau M., Young L. M., Combes F., 2008, MNRAS, 386, 1811
- Crocker et al. (2010) Crocker A. F., Bureau M., Young L. M., Combes F., 2010, MNRAS
- Crocker et al. (2009) Crocker A. F., Jeong H., Komugi S., Combes F., Bureau M., Young L. M., Yi S., 2009, MNRAS, 393, 1255
- Daddi et al. (2010) Daddi E., Bournaud F., Walter F., Dannerbauer H., Carilli C. L., Dickinson M., Elbaz D., Morrison G. E. et al., 2010, ApJ, 713, 686
- de Vaucouleurs et al. (1991) de Vaucouleurs G., de Vaucouleurs A., Corwin H. G., Buta R. J., Paturel G., Fouque P., 1991, Volume 1-3
- de Zeeuw et al. (2002) de Zeeuw P. T., Bureau M., Emsellem E., Bacon R., Carollo C. M., Copin Y., Davies R. L., Kuntschner H. et al., 2002, MNRAS, 329, 513
- Dickey & Kazes (1992) Dickey J. M., Kazes I., 1992, ApJ, 393, 530
- Dressler (1980) Dressler A., 1980, ApJ, 236, 351
- Dressler et al. (1997) Dressler A., Oemler A., Couch W. J., Smail I., Ellis R. S., Barger A., Butcher H., Poggianti B. M., Sharples R. M., 1997, ApJ v.490, 490, 577
- Dutton et al. (2010) Dutton A. A., Conroy C., van den Bosch F. C., Prada F., More S., 2010, MNRAS, p. 923
- Emsellem et al. (2010) Emsellem E., Cappellari M., et al 2010, MNRAS (arXiv:1102.4444) (Paper III)
- Emsellem et al. (2007) Emsellem E., Cappellari M., Krajnović D., van de Ven G., Bacon R., Bureau M., Davies R. L., de Zeeuw P. T. et al., 2007, MNRAS, 379, 401
- Emsellem et al. (2004) Emsellem E., Cappellari M., Peletier R. F., McDermid R. M., Bacon R., Bureau M., Copin Y., Davies R. L., Krajnović D. et al., 2004, MNRAS, 352, 721
- Emsellem et al. (1994) Emsellem E., Monnet G., Bacon R., 1994, A&A, 285, 723
- Faber & Jackson (1976) Faber S. M., Jackson R. E., 1976, ApJ, 204, 668
- Förster-Schreiber et al. (2009) Förster-Schreiber N. M., Genzel R., Bouché N., Cresci G., Davies R., Buschkamp P., Shapiro K., Tacconi L. J., 2009, ApJ, 706, 1364
- Gavazzi (1993) Gavazzi G., 1993, ApJ v.419, 419, 469
- Gavazzi et al. (2007) Gavazzi R., Treu T., Rhodes J. D., Koopmans L. V. E., Bolton A. S., Burles S., Massey R. J., Moustakas L. A., 2007, ApJ, 667, 176
- Gerhard et al. (2001) Gerhard O., Kronawitter A., Saglia R. P., Bender R., 2001, AJ, 121, 1936
- Ho (2007) Ho L. C., 2007, ApJ, 669, 821
- Hubble (1926) Hubble E. P., 1926, ApJ, 64, 321
- Jarrett et al. (2000) Jarrett T. H., Chester T., Cutri R., Schneider S., Skrutskie M., Huchra J. P., 2000, AJ, 119, 2498
- Józsa et al. (2007) Józsa G. I. G., Kenn F., Klein U., Oosterloo T. A., 2007, A&A, 468, 731
- Józsa et al. (2009) Józsa G. I. G., Oosterloo T. A., Morganti R., Klein U., Erben T., 2009, A&A, 494, 489
- Kannappan et al. (2002) Kannappan S. J., Fabricant D. G., Franx M., 2002, AJ, 123, 2358
- Kent (1987) Kent S. M., 1987, AJ, 93, 816
- Koribalski et al. (1993) Koribalski B., Dahlem M., Mebold U., Brinks E., 1993, A&A, 268, 14
- Krajnović et al. (2010) Krajnović D., Emsellem E., et al 2010, MNRAS, in press (arXiv:1102.3801) (Paper II)
- Kron (1980) Kron R. G., 1980, ApJS, 43, 305
- Lavezzi (1997) Lavezzi T. E., 1997, PhD Thesis, University of Minnesota, p. 5
- Lavezzi & Dickey (1997) Lavezzi T. E., Dickey J. M., 1997, Astronomical Journal v.114, 114, 2437
- Lavezzi & Dickey (1998) Lavezzi T. E., Dickey J. M., 1998, AJ, 116, 2672
- Magorrian & Ballantyne (2001) Magorrian J., Ballantyne D., 2001, MNRAS, 322, 702
- Maiolino et al. (2009) Maiolino R., Caselli P., Nagao T., Walmsley M., Breuck C. D., Meneghetti M., 2009, A&A, 500, L1
- Markwardt (2009) Markwardt C. B., 2009, Astronomical Data Analysis Software and Systems XVIII ASP Conference Series, 411, 251
- Masters et al. (2008) Masters K. L., Springob C. M., Huchra J. P., 2008, AJ, 135, 1738
- Mei et al. (2007) Mei S., Blakeslee J. P., Côté P., Tonry J. L., West M. J., Ferrarese L., Jordán A., Peng E. W., Anthony A., Merritt D., 2007, ApJ, 655, 144
- Morganti et al. (2006) Morganti R., de Zeeuw P. T., Oosterloo T. A., McDermid R. M., Krajnović D., Cappellari M., Kenn F., Weijmans A., Sarzi M., 2006, MNRAS, 371, 157
- Neistein et al. (1999) Neistein E., Maoz D., Rix H.-W., Tonry J. L., 1999, AJ, 117, 2666
- Nilson (1973) Nilson P., 1973, Acta Universitatis Upsaliensis. Nova Acta Regiae Societatis Scientiarum Upsaliensis - Uppsala Astronomiska Observatoriums Annaler
- Noordermeer & Verheijen (2007) Noordermeer E., Verheijen M. A. W., 2007, MNRAS, 381, 1463
- Obreschkow & Rawlings (2009) Obreschkow D., Rawlings S., 2009, ApJ Letters, 696, L129
- Okuda et al. (2005) Okuda T., Kohno K., Iguchi S., Nakanishi K., 2005, ApJ, 620, 673
- Oosterloo et al. (2010) Oosterloo T., Morganti R., Crocker A., Juette E., Cappellari M., de Zeeuw T., Krajnovic D., McDermid R., Kuntschner H. et al., 2010, eprint arXiv, 1007, 2059
- Oosterloo et al. (2007) Oosterloo T. A., Morganti R., Sadler E. M., van der Hulst T., Serra P., 2007, A&A, 465, 787
- Paturel et al. (2003) Paturel G., Petit C., Prugniel P., Theureau G., Rousseau J., Brouty M., Dubois P., Cambrésy L., 2003, A&A, 412, 45
- Peletier & Willner (1993) Peletier R. F., Willner S. P., 1993, ApJ v.418, 418, 626
- Phillipps (1989) Phillipps S., 1989, A&A, 211, 259
- Pizagno et al. (2007) Pizagno J., Prada F., Weinberg D. H., Rix H.-W., Pogge R. W., Grebel E. K., Harbeck D., Blanton M., Brinkmann J., Gunn J. E., 2007, AJ, 134, 945
- Rijcke et al. (2007) Rijcke S. D., Zeilinger W. W., Hau G. K. T., Prugniel P., Dejonghe H., 2007, ApJ, 659, 1172
- Roberts (1978) Roberts M. S., 1978, Astronomical Journal, 83, 1026
- Rogstad et al. (1974) Rogstad D. H., Lockhart I. A., Wright M. C. H., 1974, ApJ, 193, 309
- Rubin et al. (1985) Rubin V. C., Burstein D., Ford W. K., Thonnard N., 1985, ApJ, 289, 81
- Sancisi (2004) Sancisi R., 2004, International Astronomical Union Symposium no. 220, 220, 233
- Sault et al. (1995) Sault R. J., Teuben P. J., Wright M. C. H., 1995, Astronomical Data Analysis Software and Systems IV, 77, 433
- Schinnerer & Scoville (2002) Schinnerer E., Scoville N., 2002, ApJ, 577, L103
- Schoeniger & Sofue (1997) Schoeniger F., Sofue Y., 1997, A&A, 323, 14
- Schoniger & Sofue (1994) Schoniger F., Sofue Y., 1994, A&A, 283, 21
- Scott et al. (2009) Scott N., Cappellari M., Davies R. L., Bacon R., de Zeeuw P. T., Emsellem E., Falcón-Barroso J., Krajnović D. et al., 2009, MNRAS, 398, 1835
- Shapiro et al. (2010) Shapiro K. L., Falcón-Barroso J., van de Ven G., de Zeeuw P. T., Sarzi M., Bacon R., Bolatto A., Cappellari M. et al., 2010, MNRAS, 402, 2140
- Shen et al. (2009) Shen S., Wang C., Chang R., Shao Z., Hou J., Shu C., 2009, ApJ, 705, 1496
- Skrutskie et al. (2006) Skrutskie M. F., Cutri R. M., Stiening R., Weinberg M. D., Schneider S., Carpenter J. M., Beichman C., Capps R. et al., 2006, AJ, 131, 1163
- Sprayberry et al. (1995) Sprayberry D., Bernstein G. M., Impey C. D., Bothun G. D., 1995, ApJ, 438, 72
- Steiman-Cameron et al. (1992) Steiman-Cameron T. Y., Kormendy J., Durisen R. H., 1992, AJ, 104, 1339
- Tacconi et al. (2010) Tacconi L. J., Genzel R., Neri R., Cox P., Cooper M. C., Shapiro K., Bolatto A., Bouché N., et al., 2010, Nature, 463, 781
- Temi et al. (2009) Temi P., Brighenti F., Mathews W. G., 2009, ApJ, 695, 1
- Tonry et al. (2001) Tonry J. L., Dressler A., Blakeslee J. P., Ajhar E. A., Fletcher A. B., Luppino G. A., Metzger M. R., Moore C. B., 2001, ApJ, 546, 681
- Toribio & Solanes (2009) Toribio M. C., Solanes J. M., 2009, AJ, 138, 1957
- Tully & Fisher (1977) Tully R. B., Fisher J. R., 1977, A&A, 54, 661
- Tully & Fouque (1985) Tully R. B., Fouque P., 1985, ApJS, 58, 67
- Tully & Pierce (2000) Tully R. B., Pierce M. J., 2000, ApJ, 533, 744
- Tutui & Sofue (1997) Tutui Y., Sofue Y., 1997, A&A, 326, 915
- Tutui & Sofue (1999) Tutui Y., Sofue Y., 1999, A&A, 351, 467
- Tutui et al. (2001) Tutui Y., Sofue Y., Honma M., Ichikawa T., Wakamatsu K.-I., 2001, PASJ, 53, 701
- van Dokkum et al. (2009) van Dokkum P. G., Kriek M., Franx M., 2009, Nature, 460, 717
- Verheijen (2001) Verheijen M. A. W., 2001, ApJ, 563, 694
- Walter et al. (2004) Walter F., Carilli C., Bertoldi F., Menten K., Cox P., Lo K. Y., Fan X., Strauss M. A., 2004, ApJ, 615, L17
- Weijmans et al. (2008) Weijmans A., Krajnović D., van de Ven G., Oosterloo T. A., Morganti R., de Zeeuw P. T., 2008, MNRAS, 383, 1343
- Williams et al. (2009) Williams M. J., Bureau M., Cappellari M., 2009, MNRAS, 400, 1665
- Williams et al. (2010) Williams M. J., Bureau M., Cappellari M., 2010, MNRAS, submitted
- Wrobel & Kenney (1992) Wrobel J. M., Kenney J. D. P., 1992, ApJ, 399, 94
- Young (2002) Young L. M., 2002, AJ, 124, 788
- Young et al. (2008) Young L. M., Bureau M., Cappellari M., 2008, ApJ, 676, 317
- Young et al. (2011) Young L. M., Bureau M., et al 2011, MNRAS (Paper IV)
- Zwaan et al. (1995) Zwaan M. A., van der Hulst J. M., de Blok W. J. G., McGaugh S. S., 1995, MNRAS, 273, L35