a000000 \paperrefxx9999 \papertypeSC \paperlangenglish \journalcodeJ \journalyr2010 \journaliss1 \journalvol59 \journalfirstpage000 \journallastpage000 \journalreceived0 XXXXXXX 0000 \journalaccepted0 XXXXXXX 0000 \journalonline0 XXXXXXX 0000
Wang Hanson \cauthor[a]Xinsheng SeanLingXinshengLing@brown.edu
Majkrzak Maranville
[a]Department of Physics, Brown University, Providence RI 02912, \countryUSA \aff[b]NIST Center for Neutron Research, Gaithersburg MD 20899, \countryUSA
3D Spatially Resolved Neutron Diffraction from a Disordered Vortex Lattice
Abstract
The vortex matter in bulk type-II superconductors serves as a prototype system for studying the random pinning problem in condensed matter physics. Since the vortex lattice is embedded in an atomic lattice, small angle neutron scattering (SANS) is the only technique that allows for direct structural studies. In traditional SANS methods, the scattering intensity is a measure of the structure factor averaged over the entire sample. Recent studies in vortex physics have shown that it is highly desirable to develop a SANS technique which is capable of resolving the spatial inhomogeneities in the bulk vortex state. Here we report a novel slicing neutron diffraction technique using atypical collimation and an areal detector which allows for observing the three dimensional (3D) disorder of the vortex matter inside an as-grown Nb single crystal.
1 Introduction
A major goal in the field of vortex physics is to determine the nature of the long-range order in the ground state of the Abrikosov vortex line lattice (Abrikosov, 1957). It has been theoretically predicted that in systems with weak random pinning, a new phase of matter known as a Bragg glass exists in the vortex state (Chudnovsky, 1989; Nattermann, 1990; Giamarchi & Le Doussal, 1995). In contrast to a perfect crystal with a delta-function structure factor, the Bragg glass theory predicts a power-law shaped structure factor (Chudnovsky, 1989; Giamarchi & Le Doussal, 1995; Bogner et al., 2001), similar to a 2D crystal at finite temperatures with no random pinning (Imry & Gunther, 1971; Nelson & Halperin, 1979). Since the vortex lattice is embedded in an atomic lattice, neutron scattering (Furrer et al., 2009) is the only technique for direct structural studies. There have been several attempts (Klein et al., 2001; Daniilidis et al., 2007; Laver et al., 2008) to observe the Bragg glass phase, but no conclusive evidence has been found even though there are compelling arguments (Klein et al., 2001) for why one would not be able to measure it directly.
In particular, the vortex states in bulk Nb samples have been studied extensively (Schelten et al., 1971; Christen et al., 1975; Lynn et al., 1994; Rosov et al., 1994; Ling et al., 2001; Forgan et al., 2002; Daniilidis et al., 2007; Laver et al., 2008). These SANS measurements revealed the bulk properties of the interior of the samples. However, it has been recently observed that the vortex matter in a Nb single crystal can be spatially inhomogeneous (Hanson et al., 2010). Since the SANS measurement is based on an averaged signal, it would be difficult to discern the nature of disorder in the vortex matter. It is thus necessary to develop a tool to spatially resolve the vortex matter structure from different locations in a bulk superconductor.
By using a thin ribbon-shaped beam, as prepared on the Advanced Neutron Diffractometer/Reflectometer (AND/R) at the NIST Center for Neutron Research (NCNR), we find that it is possible to spatially resolve distinct, locally coherent regions of the vortex lattice within the sample (similar to crystallographic grains, with a small angular mismatch between regions), transverse to the direction of the magnetic field (Hanson et al., 2010). Here, we report an improvement on this method which allows us to probe variations of the the in-plane vortex matter structure factor along the direction of the applied magnetic field. We demonstrate the effectiveness of this method in revealing the splitting of a Bragg peak along the magnetic field direction of the vortex lattice in a Nb single crystal.
2 Sample Properties
The sample is an as-grown Nb single crystal (cylinder shaped) with its direction along the cylindrical axis, used in the previous study (Hanson et al., 2010). It has a diameter of mm, a height of mm, and the weight is g. The residual resistivity ratio (RRR) is . By using the ac magnetic susceptometry technique (Ling & Budnick, 1991), we have mapped out the phase diagram and observed a weak peak effect in this sample. The characteristic field values at K are the lower critical field T, the upper critical field T, and the field at the peak of the peak effect T.
We apply the magnetic field parallel to the direction of the Nb crystal. The vortex lattice is prepared with a zero-field cooling procedure followed by thermal annealing and a small ac magnetic field perturbation. The magnetic field ( T) is applied after the sample is cooled through the transition temperature of K down to K. We thermally anneal the vortex matter by slowly increasing the temperature (in increments of K) to K, just below the transition temperature, ( T), and then slowly cooling back down to K (here K). Finally, we perturb the vortex matter by applying an ac magnetic field (sawtooth-function) with an amplitude of T and a frequency of Hz for minutes provided by a Helmholtz coil outside the superconducting magnet. We find that this procedure is optimal for forming a stable vortex state with the highest order in this sample.
3 Conventional Neutron Scattering on Vortex Matter
In a neutron scattering experiment, the Bragg condition (Bragg & Bragg, 1913) occurs when the scattering vector equals the reciprocal lattice vector , where . Here is the neutron wavelength, is the Bragg angle, and is the distance between lattice planes. In vortex physics (Tinkham, 1996), the applied magnetic field, , determines the value of through the relationship
| (1) |
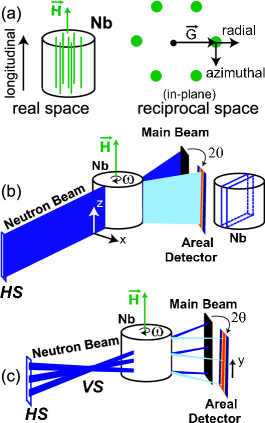
where is the vortex lattice constant and Wb is the flux quantum. The sketch of an ideal vortex lattice in our sample is shown Fig. 1(a).
The AND/R scattering geometry is shown in Fig. 1. The parameters of the setup are described elsewhere (Dura et al., 2006) but some important aspects are reiterated here. There are two slits in front of the sample, each one defined by two borated aluminum plates. With both slit widths set to mm, the incident neutron beam has an angular spread of HWHM. A wide third slit is placed directly behind the sample to reduce the background scattering that reaches the areal detector. A fourth slit can be placed directly in front of the detector to further reduce background noise and improve the instrument resolution. In Fig. 1 (b), only the second slit is plotted.
The azimuthal direction (perpendicular to ) is probed by rotating the sample and the magnetic field (and the associated reciprocal lattice) while keeping the detector (and the associated scattering vector) fixed in space at an angle . The radial direction (along ) is measured by rotating the sample (and the magnetic field) and neutron detector in concert, always moving the detector by for every sample movement of . This procedure keeps the scattering vector at a fixed azimuthal angle but varies the magnitude with respect to the reciprocal lattice vector of the sample. By scanning the scattering vector through the Bragg condition in both azimuthal and radial directions we can map out the in-plane shape of the Bragg peak.
In previous SANS experiments on vortex matter, the scattering intensities along the azimuthal and radial directions are usually resolution-limited. The trade-off for the high resolution of a reflectometer is a relatively low neutron flux compared to typical SANS instruments. The flux restricts our study to the structure of the vortex matter in the low field region of the phase diagram where the scattering is strong.
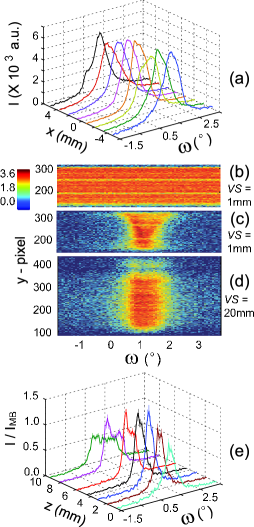
Additionally, in the typical SANS geometry, one illuminates as much of the sample as possible to increase the scattering intensity. The measurement is an averaged signal over the bulk sample. One particularly relevant aspect of the AND/R geometry is the width of the beam compared to the sample diameter (here mm vs. mm). Since only a small slice of the sample is exposed to the neutron beam, we can shift the position of the sample relative to the neutron beam along the direction ( labeled in Fig. 1(b)) and study the vortex matter at different sample locations (Hanson et al. 2010). The position of the neutron beam relative to the sample ( value) is located by scanning through the neutron absorbers (Cd masks) around the sample holder and the uncertainty of the value is mm. The data in Fig. 2(a) is a three-dimensional plot of the integrated intensity versus azimuthal angle versus value, where the origin of represents the center of the sample. The intensities have been scaled for the different scattering volumes. From Fig. 2(a), it is clear that the Bragg peaks are spatially inhomogeneous (physical implications are discussed in Hanson et al., 2010).
4 Three Dimensional Structure Mapping
The ability to scan the sample along the direction (see Fig. 1(b)) allows us to map the Bragg peak from the sample edge to the sample center and study the spatial dependence of the vortex matter structure. Since the detector is sensitive to the impact of neutrons in two dimensions, by adding vertical collimation to the instrument, we can observe the orientational disorder along the length of the flux lines.
On top of the standard collimation, a vertical slit is placed in position as shown in Fig. 1(c). The addition of this single vertical slit in front of the sample focuses our ribbon-shaped neutron beam into a point source, located at the slit itself. The distribution of the neutrons from the source is not completely uniform along the -direction. This vertical variation is due to the fact that the monochromator of AND/R, which is a wavelength selector, is composed of seven separate pyrolytic graphite elements arranged vertically (Dura et al., 2006). The gaps between these elements are visible in Fig. 2(b), a color plot of the intensity from the main neutron beam on the detector with the vertical slit in place. Here only the scattering from three fingers is measurable with the given aperture widths and positions.
Fig. 2(c) is the raw scattering intensity at mm with a vertical slit of mm width. In contrast, Fig. 2(d) is the raw scattering data from the same state with the vertical slit wide open ( mm). Comparing these two plots, it is clear that the inhomogeneity of the Bragg peak is revealed by the tight vertical slit.
In order to better visualize the orientational disorder along the length of the flux lines, we decompose the scattering intensity on the areal detector into several sections along the axis. The number of resolvable sections depends on the vertical collimation. By back-projecting all possible paths of the neutrons from a given -pixel on the detector to the source, we can map the detector regions onto the corresponding vertical locations in the sample ( value). In order to correct for the non-uniform distribution of the main beam, each section is divided by the corresponding main beam intensity (). Fig 2(e) shows the (corrected) integrated intensity versus vertical position in the sample ( mm corresponds to the bottom of the sample) versus the rocking angle . In this way we map out both the horizontal and vertical variations of the Bragg peak shape. Fig. 2(a) and Fig. 2(e) demonstrate that the vortex lattice is spatially defective throughout the entire the sample.
5 Summary and Conclusions
The high resolution and ribbon-beam geometry of AND/R have allowed us to probe the spatial dependence of the vortex matter structure transverse to the flux lines in a Nb single crystal. By adding vertical pinhole collimation, we are able to simultaneously measure the orientational disorder along the length of the flux lines in addition to the scattering along the azimuthal and radial directions. The neutron diffractometer provides us with a new approach to map out the complete structure of a vortex lattice and enables us to locate the optimum position inside the sample in searching for the Bragg glass phase. Spatial variations of the orientational order are observed in the lattice structure throughout this Nb single crystal. The technique could easily be adapted for the spatial mapping of other three dimensional structures with suitable geometry.
6 Acknowledgements
This research is supported by the U.S. Department of Energy, Office of Basic Energy Sciences, Division of Materials Sciences and Engineering under grant DE-FGER. NCNR is supported by the U.S. Department of Commerce. We would like to acknowledge the efforts of William R. Clow and Julia Scherschligt of the NCNR in providing the highly specialized sample environment required to make these measurements. The programs from the reflpak suite were used for elements of the data reduction and analysis (Kienzle et al., 2002 - 2006). X.W. and H.A.H. would like to thank D. Hudek for allowing access to his X-ray diffraction machine. X.W. and H.A.H. would like to acknowledge support from the Galkin Fund at Brown University.
References
- [1]
- [2]
- [3]
- [4]
- [5]
- [6]
- [7]
- [8]
- [9]
- [10]
- [11]
- [12]
- [13]
- [14]
- [15]
- [16]
- [17]
- [18]
- [19]
- [20]
- [21]
- [22]
- [23]
- [24]
- [25]
- [26]
- [27]
- [28]
- [29]
- [30]
- [31]
- [32]
- [33]
- [34]
- [35]
- [36]
- [37]
- [38]
- [39]
- [40]
- [41]
- [42]
- [43]
- [44]
- [45]
- [46]