High pressure phases of crystalline tellurium.
Abstract
A study of high pressure solid Te was carried out at room temperature using Raman spectroscopy and Density Functional Theory (DFT) calculations. The analysis of the P-dependence of the experimental phonon spectrum reveals the occurrence of phase transitions at 4 GPa and 8 GPa confirming the high-pressure scenario recently proposed. The effects of the incommensurate lattice modulation on the vibrational properties of Te is discussed. DFT calculations agree with present and previous experimental data and show the metallization process at 4 GPa being due to the development of charge-bridges between atoms belonging to adjacent chains. A first-principles study of the stability of the 4 GPa phase is reported and discussed also in the light of the insurgence of lattice modulation.
pacs:
62.50.-p, 71.30.+h, 63.20.-e, 31.15.E-,61.44.FwThe remarkable advances in high-pressure (HP) methods and techniques have surprisingly brought to light the occurrence of incommensurately modulated (IM) crystal structures also in elemental systems under pressure Takemura03 ; Kume05 ; Nelmes99 ; Fujihisa07 ; Degtyareva05 ; Hejny03_prl ; Loa09 . The modulation, although preserving the long-range order, removes the lattice translational symmetry and introduces a new structural degree of freedom. Moreover in a variety of elemental systems (e.g. I, Br, P and VI group elements S, Se, Te) the picture is even more intriguing since applied pressure induces a metallization transition preceding the onset of the IM phase, which suggests a connection with an electronic instability Loa09 .
Among the chalcogens the long-standing problem of the sequence and the nature of the HP phases of Te has been the subject of intense theoretical Hsueh99 ; LDA+GCC and experimental Hejny03_prl ; Bardeen49 ; Loa09 investigations. Despite the great effort, a comprehensive picture is still far from being reached at least over the intermediate pressure range. It is indeed well known that, under ambient conditions and on increasing the pressure up to 4 GPa, Te is a semiconductor and its crystal structure is trigonal with spiral atom chains along the c axis (Te-I). The three atoms in the unit cell are linked via covalent-like bonds to the nearest neighbors along the chain and, via Van der Waals interactions, to the second neighbors lying along adjacent chains Aoki80 . The very HP regime (i.e. above 27 GPa or 29 GPa according with Ref.Parthasarathy88 or Ref.Hejny03_prl respectively) is established, as well: Te is a metal with a highly symmetric bcc structure (Te-IV).
Apart from the metallization transition that, since long, it is known to occur at 4 GPa Bardeen49 together with a structural change, there is an intense debate on the HP metallic structural phases between the Te-I and the Te-IV. i.e. over the 4-27(29) GPa pressure range. In particular the succession of phases over this intermediate pressure range accepted up to few years ago was: a puckered layer monoclinic structure for P 4 GPa which transforms into an orthorhombic one at 6.8 GPa and finally a -Po-type above 11 GPa and below the Te-IV pressure threshold Aoki80 ; Jamieson65 ; Parthasarathy88 . Recent X-ray diffraction studies Hejny03_prl ; Hejny04_prb have drawn a rather different HP phase transition scenario, claiming a structural transition to triclinic (Te-II) at 4.0 GPa, followed by the onset of an IM monoclinic phase (Te-III) at 4.5 GPa which is finally transformed into the bcc Te-IV phase above 29 GPa. It is worth to notice that since Te-I is observed up to 4.5 GPa and Te-II up to 8 GPa, we have large regions of coexisting phases and the above reported phase boundaries are intended as the pressure threshold at which the higher pressure phase first appears on compressing the lattice.
In the present paper a combination of experiments and ab initio calculations is used to study structural, dynamic and electronic properties of HP solid Te in order to solve the controversy about the sequence of crystallographic structures, the real occurrence of IM phases, and to shed light on the microscopic metallization mechanism. A HP Raman study of Te (0 15 GPa) is reported together with the results of density functional theory (DFT) calculations which well reproduce the experiment and allow to gain a further insight of the microscopic modifications induced by pressure.
A high purity Te sample (99.99% by Aldrich) was used without further treatment. A diamond anvil cell coupled to a microRaman spectrometer (Horiba Jobin Yvon) was employed. The ruby fluorescence technique was applied for pressure calibration and two pressure-transmitting media (NaCl and methanol/ethanol 1:4 mixture) were used to verify their possible effects on the high pressure measurements. Moreover, exploiting the high spatial resolution of our experimental setup, Raman spectra were collected at each pressure from different points over the surface of the samples (about 5050 m2) to test the presence of pressure gradients. Further experimental details can be found in Ref. NOI , here we just notice that great care was taken in the optical alignment Degiorgi to collect reliable spectra above 80 cm-1 and that we did not find any evidence of either reactions between the media and the sample or detectable non-hydrostaticity effects. No laser-induced sample heating has been observed as wellPaolone2005635 . Normalized and background subtracted (see below) Raman spectra of Te collected using NaCl and methanol/ethanol are shown in Fig. 1 at selected P values. According to the standard group theory (GT), the irreducible representation of the optical modes of Te-I is A1 + A2 + 2 E. The Raman active modes are: the A1 mode (breathing in the ab plane) and the two doubly degenerate E modes (E(1) a- and b-axis rotation , E(2) asymmetric stretching mainly along c-axis). These latter are also Infrared active since the crystal lacks a center of inversion. Measured spectra were fitted by using a standard model curve fit given by the sum of three phonon contributions (each described by a damped harmonic oscillator), and an electronic background. A linear baseline was also included in the fitting curve. In Fig. 1b the best-fit curve and the phonon assignment are also shown for the lowest pressure spectrum. The spectra shown in Fig. 1a and Fig. 1b are background subtracted and normalized to the phonon integrated intensities.
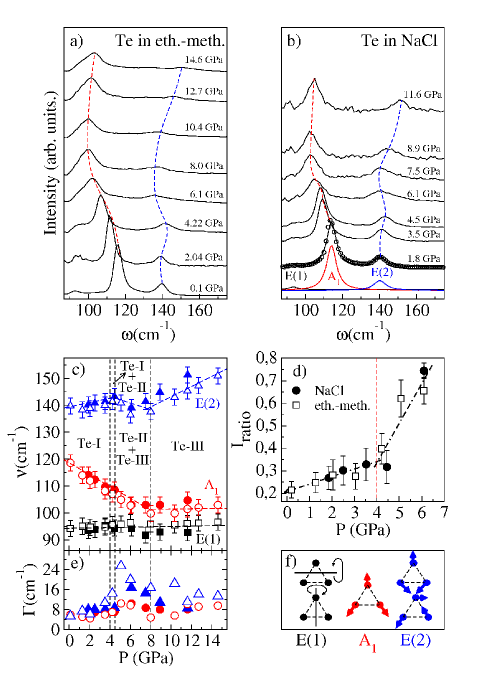
The Raman spectrum shows a remarkable pressure dependence albeit the three-peaks structure is basically preserved over the whole pressure range. We notice that the persistence of a Raman signal well above 11 GPa disagrees with the old phase transition scheme Aoki80 ; Jamieson65 ; Parthasarathy88 since no Raman-active are expected for the -Po-type phase. On the other hand, an unmodulated monoclinic phase (i.e. an unmodulated Te-III structure) has no Raman-active mode as well. The observation of a Raman signal is thus only coherent with the new transition scheme where the Te-III structure appears to be IM Hejny03_prl . In this case, optical scattering processes are allowed not only from phonons at but, in the sinusoidal approximation, also at (with the modulation wave vector). Using the superspace GT (equations and formalism are from Ref. Janssen79_jpc ), the calculated character of the representation is where E, 2y, my denote the point group operations of the three-dimensional space-group elements. This representation is reducible into = 2 Ag + 1 Bg + 2 Au + 1 Bu, where three Raman active modes (two Ag modes and the Bg mode) are expected. This first experimental evidence thus provides not only a clear support to the recently proposed transition scheme but can be seen as a marker of the onset of an IM phase.
Looking at Fig. 1c, three different pressure regions can be identified by the abrupt variations of the pressure dependence of the phonon peak frequencies. The borders among the regions actually correspond to the pressure thresholds of the new transition scheme Hejny03_prl ; Hejny04_prb . Over the 0-4 GPa pressure range, the phonon frequency of the A1 mode shows a linear softening ( 10 cm-1), whereas the frequencies of the two E modes weakly increase. Since the A1 mode is a chain breathing and, over the same pressure range, a contraction of the b lattice parameter and an almost constant c Aoki80 were observed, the above findings suggest a progressive weakening of intrachain bonds in favor of interchain atomic interactions. The slope discontinuity of the pressure dependence of the E(2) mode whose frequency starts to decrease at 4 GPa, marks the emergence of a new crystal phase albeit, within the 4-7 GPa, the frequency of the A1 phonon is still decreasing and that of the the E(1) mode keeps almost constant. The narrow pressure range in which Te-I and Te-II coexist (4-4.5 GPa) makes it impossible to determine whether the discontinuity can be ascribed to the Te-I/Te-II transition or to the onset of the Te-III phase. According to Ref. Hejny03_prl ; Hejny04_prb that reports on the Te-II/Te-III coexistence within the 4.5-8 GPa pressure range, the observed softening of the E(2) mode can be ascribed to the structural instability of the Te-II phase which is progressively converted into the rather similar Te-III phase Hejny03_prl ; Hejny04_prb . We notice that larger values of the phonon linewidths shown in Fig. 1e can be found within the coexistence region (4.5-8 GPa) as a consequence of the lattice disorder. On further increasing the pressure above 8 GPa all the phonon modes show a rather regular frequency hardening, indicating that a single, stable phase (Te-III) has finally established.
The presence of modulation implies a one-to-one correspondence between eigenvalues of the dynamical matrix at generic and those at .Janssen79_jpc More precisely the phonons at involved in the extra scattering processes arising from the modulation, have the same energies as the phonons at the point involved in the usual inelastic scattering processes.Janssen79_jpc This allows an unusual comparison between the results of a Raman experiment and those of an inelastic x-ray (neutron) scattering experiment. Indeed, the frequency of the Raman mode at higher energy, observed at 8.9 GPa (Te-III phase, see Fig. 1c), is the same within the experimental uncertainties as the frequency of the longitudinal mode at observed by the inelastic x-ray scattering experiment reported in Ref. Loa09 . This finding thus provide further evidence of the the onset of an IM phase at HP.
The weakening of intrachain bonds can be ascribed to the onset of a pressure induced charge transfer process, as also suggested by the remarkable reduction of the intensity (peak integrated area) of the A1 mode, I[A1] iodio . This effect is shown in Fig. 1d where the pressure dependence of the intensity ratio is shown. Neglecting the small contribution to due to the small intensity (area) of the E(1) mode, the growth of indicates a strong decrease in the intensity of the A1 peak before the metallization pressure. Moreover two different regimes, below and above the metallization pressure (4 GPa), can be clearly identified.
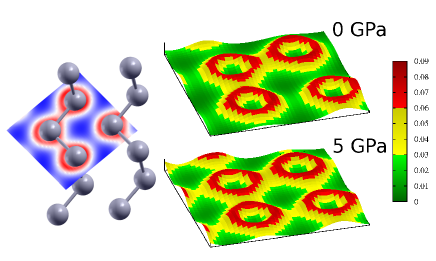
To gain further insight into the microscopic charge-transfer process, pseudopotential DFT calculation using the Quantum-Espresso code espresso have been carried out. A full structural relaxation under the influence of Hellmann-Feynman forces and stresses was carried out for Te-I at 0, 2.5 and 5 GPa using the variable cell shape methodHellmann-Feynman . At each pressure the electronic density of states and bands as well as the frequencies and the intensities of normal vibrational modes were obtained by the perturbation approach of DFT perturbation . We found the closure of the energy gap at 5 GPa and an overall good agreement between the calculated data and the HP experimental structural data Aoki80 . The intrachain bond length was slightly overestimated because of the typical error of the generalized gradient approximations in the determination of the cohesive force in strongly anisotropic systems. This reflects in an underestimate of the calculated phonon frequencies (by less than 10%) which, however, together with the intensity ratio defined above, shows the same pressure dependence as the experimental data. Moreover, the calculations support the evidence for a progressive reduction of the angle between the E(2) mode eigenvectors and the c--axis on applying pressure (from 12∘ at P=0 to 2.5∘ at P=5). The good agreement of the results of DFT calculations with the present and the previous experimental data makes us confident also about the other possible outputs of the code. In particular our calculations provided also the maps of the valence electron (5S25P4) densities shown in Fig. 2 at ambient pressure and at 5 GPa . The onset of a bridge of charge density linking the atoms inside the chain and the first neighbor atom in the adjacent chain is pretty clear at P=5 GPa. The pressure induced metallization transition is therefore the result of the simultaneous lattice symmetrization and charge-transfer processes from intrachain to interchain regions which allows the mobility of the valence electron.
We also exploited the DFT approach to investigate the structural Te-I/Te-II transition although it has proved to be a rather complex task. In Te-I most of the crystallographic constants are fixed by the hexagonal geometry, nevertheless the DFT underestimates the anisotropy of the system leading to a slight overestimation of the ratio of chain radius to interchain distance. In the Te-II case, where all the lattice parameters and the atom positions are left free to vary during the cell relaxation, this trend is strongly emphasized, so that, with relaxing the structure, the experimental zig-zag puckering is entirely lost. For this reason, the dynamic properties for the Te-II relaxed cells in the pressure range between 3.5 and 7 GPa differ qualitatively from the experimental ones, even if the calculated enthalpy of the Te-I phase becomes higher than that of Te-II phase above 5.5 GPa, in agreement with the occurrence of the phase transition (see Fig. 3).

Thus, in the present case, the dynamical properties were calculated optimizing the atomic positions while keeping fixed the lattice parameters to the experimental values obtained for the Te-II phase at 4.5 GPa Hejny04 . For sake of comparison the Raman frequencies have been recalculated by optimizing only the atomic positions keeping constant the lattice parameters to the experimental values observed for the Te-I phase at 4.0 GPa. The results for the two phases are reported in Tab. 1.
| Te-I at 4 GPa | Te-II at 4.5 GPa | ||
|---|---|---|---|
| Mode | (cm-1) | Mode | (cm-1) |
| E(1) | 78 | Ag(1) | 38 |
| A1 | 92 | Ag(2) | 94 |
| E(2) | 122 | Ag(3) | 125 |
We notice that only the low-frequency phonon shows a remarkable discontinuity at the transition whereas the differences between the values calculated in the two phases for the high-frequency modes are within the typical DFT calculations accuracy. In agreement with the experimental data our calculations thus predict a continuous evolution of the frequencies across the Te-I Te-II transition for the high-energy modes. As to the estimate of the frequency of the low-energy mode further discussion is required. This vibrational mode is the mode mostly affected by the IM since the the direction of the incommensurate modulation is rather close to the direction along with the atom displacements occur The underestimate of the mode frequency seems to be related to an excessive sensitivity of the DFT theory to predict the incommensurate phase, or in other words it seems to be related to an overestimate of the width of the saddle point of the energy landscape in the direction of the modulation. This is confirmed by the fact that there is a neighborhood of points around qinc for which the transverse acoustic phonon has negative energies Hejny03_prl .
In summary the Raman experiment supports the recently proposed HP phase transition scenario Hejny03_prl and the appearance of an incommensurate modulation is clearly demonstrated at intermediate pressure. Our DFT calculations well reproduce the present and the previous HP experimental data allowing for an accurate study of the microscopic pressure induced modifications. In agreement with the indications of the Raman experiment, DFT calculations show that the metallization transition is driven by an intra- to inter-chain charge transfer which develops charge density bridge among adjacent chains. Finally the combined use of spectroscopic and ab initio methods has proved to be a useful approach to the complexity of systems with incommensurately modulated structure.
References
- (1) T. Kenichi et al., Nature, 423, 971 (2003).
- (2) T. Kume et al., Phys. Rev. Lett., 94, 065506 (2005).
- (3) R. J. Nelmes et al., Phys. Rev. Lett., 83, 4081 (1999).
- (4) H. Fujihisa et al., Phys. Rev. Lett., 98, 175501 (2007).
- (5) O. Degtyareva et al., Nature Materials, 4, 152 (2005).
- (6) C. Hejny and M. I. McMahon, Phys. Rev. Lett., 91, 215502 (2003).
- (7) I. Loa, M. I. McMahon, and A. Bosak, Phys. Rev. Lett., 102, 035501 (2009).
- (8) H. C. Hsueh et al., Phys. Rev. B, 61, 3851 (2000).
- (9) H. Akbarzadeh and M. R. Mohammadizadeh, Comp. Mat. Sci., 8, 335 (1997).
- (10) J. Bardeen, Phys. Rev., 75, 1777 (1949).
- (11) K. Aoki, O. Shimomura, and S. Minomura, J. Phys. Soc. Jpn., 48, 551 (1980).
- (12) G. Parthasarathy and W. B. Holzapfel, Phys. Rev. B, 37, 8499 (1988).
- (13) J. C. Jamieson and D. B. McWhan, J. Chem. Phys., 43, 1149 (1965).
- (14) C. Hejny and M. I. McMahon, Phys. Rev. B, 70, 184109 (2004).
- (15) P. Postorino et al., Phys. Rev. B, 65, 224102 (2002).
- (16) M. Lavagnini et al., Phys. Rev. B, 78, 201101 (2008).
- (17) A. Paolone et al., Solid State Ionics, 176, 635 (2005).
- (18) A. Congeduti et al., Phys. Rev. Lett., 86, 1251 (2001).
- (19) T. Janssen, J. Phys. C: Solid State Phys., 12, 5381 (1979).
- (20) A. Congeduti et al., Phys. Rev. B, 65, 014302 (2001).
- (21) S. Giannozzi et al, “http://www.quantum-espresso.org”.
- (22) R. M. Wentzcovitch, Phys. Rev. B, 44, 2358 (1991).
- (23) S. Baroni et al., Rev. Mod. Phys., 73, 515 (2001).
- (24) C. Hejny and M. McMahon, Phys. Rev. B, 70, 184109 (2004).