The High Time Resolution Universe Survey – III. Single-pulse searches and preliminary analysis
Abstract
We present the search methods and initial results for transient radio signals in the High Time Resolution Universe (HTRU) Survey. The HTRU survey’s single-pulse search, the software designed to perform the search, and a determination of the HTRU survey’s sensitivity to single pulses are described. Initial processing of a small fraction of the survey has produced 11 discoveries, all of which are sparsely-emitting neutron stars, as well as provided confirmation of two previously unconfirmed neutron stars. Most of the newly discovered objects lie in regions surveyed previously, indicating both the improved sensitivity of the HTRU survey observing system and the dynamic nature of the radio sky. The cycles of active and null states in nulling pulsars, rotating radio transients (RRATs), and long-term intermittent pulsars are explored in the context of determining the relationship between these populations, and of the sensitivity of a search to the various radio-intermittent neutron star populations. This analysis supports the case that many RRATs are in fact high-null-fraction pulsars (i. e. with null fraction 0.95), and indicates that intermittent pulsars appear distinct from nulling pulsars in their activity cycle timescales. We find that in the measured population, there is a deficit of pulsars with typical emission timescales greater than 300 s that is not readily explained by selection effects. The HTRU low-latitude survey will be capable of addressing whether this deficit is physical. We predict that the HTRU survey will explore pulsars with a broad range of nulling fractions (up to and beyond ), and at its completion is likely to increase the currently known RRATs by a factor of more than two.
keywords:
1 Introduction
Radio single-pulse searches within the last decade have revealed a number of fascinating objects within and outside of our own Galaxy. Pulsed radio emission originating from other galaxies could give an estimate of the combined free electron content of their host galaxies and of the intergalactic medium; thus far, searches have detected single pulses from neutron stars in two close satellites of our Galaxy, including giant pulses from B0540–69 in the Large Magellanic Cloud (Johnston & Romani, 2003) and a probable transient neutron star in the Sculptor Spheroidal Dwarf Galaxy (Rubio-Herrera, 2010). A number of other nearby galaxies have been the target of single-pulse searches, showing only sparsely detected events of inconclusive origin (e. g. galaxies M33 and M31, searched by McLaughlin & Cordes 2003 and Rubio-Herrera 2010, respectively). The discovery by Lorimer et al. (2007) of a seemingly dispersed, 30-Jy impulse (at a dispersion measure, DM, of pc cm-3) appeared to represent the first discovery of an extragalactic pulse with high significance that was of non-neutron star origin. However, the recent discovery of pulses of ambiguous terrestrial origin with frequency-sweeps that mimic the cold plasma dispersion relation and primarily appear around pc cm-3, have cast some doubt on the Lorimer et al. pulse as being extragalactic and provided an additional, terrestrial target for single-pulse searches (Burke-Spolaor et al., 2011).
The most frequently detected sources of transient radio emission are pulsars. Single-pulse searches in recent years uncovered what was labelled the “rotating radio transient” (RRAT) phenomenon (McLaughlin et al., 2006), which encapsulates sparsely radio-emitting neutron stars, that due to their sporadic emission, were undetectable by the Fourier-based search techniques currently in standard use for pulsar surveys. The point has recently been made that in fact the term RRAT is rather a “detection label” than a description of a physical phenomenon: Keane (2010a) notes that whether a discovery is considered “RRAT” is highly dependent on both survey length and an object’s rotational period. This and other mounting evidence indicate that RRATs are unlikely to have a physically distinct origin from radio pulsars. This includes, for instance, that RRAT pulse energy distributions tend to obey log-normal distributions similar to both non-nulling and nulling pulsars (e. g. Cairns et al. 2001, Keane 2010b; Miller et al. submitted) and that there is a lack of distinction between RRAT and pulsar Galactic distributions and pulse width distributions (Burke-Spolaor & Bailes, 2010). Additionally, if RRATs were a distinct phenomenon unrelated to other neutron star populations in an evolutionary sequence, the implied birthrate of neutron stars would far exceed the rate of supernovae that produce them (Keane & Kramer, 2008). As such, the current understanding of the objects discovered preferentially in single-pulse searches is that they are a mix of both modulated pulsars with long-tailed pulse energy distributions (Weltevrede et al., 2006), and pulsars at the most extreme end of the nulling pulsar population (Burke-Spolaor & Bailes 2010; Keane 2010b; Miller et al. submitted).
However, questions remain: why do the objects appear to have a period-derivative and/or magnetic field distribution that sits higher than average pulsars of the same period range (McLaughlin et al., 2009)? What are the statistics of peculiar phenomena in these extreme nulling objects such as the RRAT-pulsar mode switching of PSR J0941–39 (Burke-Spolaor & Bailes, 2010), the multi-modal (and latitude-dependent) behaviour of PSR J1119–6127 (Weltevrede et al., 2010), or the glitch activity of PSR J1819–1458 (Lyne et al., 2009)? What causes nulling and what is the distribution of pulsar nulling fractions (again holding implications for the neutron star birthrate)? And finally, do (and if so, how do) the most extreme nulling pulsars fit into an evolutionary progression between average radio pulsars, nulling pulsars, radio quiet neutron stars, and the magnetar population (e. g. McLaughlin et al. 2009; Lyne et al. 2009; Burke-Spolaor & Bailes 2010; Keane 2010b)? Acquiring larger statistical sample of these objects is among the next essential steps in understanding RRATs and transient radio neutron star phenomena (currently a total of 40 such objects are known, Hessels et al. 2008; Deneva et al. 2009; Keane et al. 2010; Burke-Spolaor & Bailes 2010; Rubio-Herrera 2010).
The High Time Resolution Universe (HTRU) Survey is the first digital, all-southern-sky survey for pulsars and fast (sub-second) transients, covering declinations (Keith et al. 2010; hereafter HTRU Paper 1). The survey employs a new digital backend, the “Berkeley-Parkes-Swinburne Recorder” (hereafter BPSR), that has been installed at the Parkes Telescope for the 20-cm multibeam receiver (Staveley-Smith et al., 1996). BPSR allows improved digitisation levels, frequency and time resolution over the previous analogue instrument that has been used for previous southern single-pulse searches and studies (i. e. Burke-Spolaor & Bailes 2010,McLaughlin et al. (2006),Keane et al. (2010)). This affords the HTRU survey unprecedented sensitivity to sub-second duration, dispersed single impulses of radio emission in the southern sky. This paper describes the techniques used in the survey to search for single pulses.
As an all-sky survey, the HTRU survey is sensitive to terrestrial, Galactic, and extragalactic sources of radio pulses. The HTRU intermediate and high latitude surveys will cover Galactic longitudes and latitudes , and declinations (not covered by intermediate pointings), respectively. Although no processing has yet commenced for the HTRU low-latitude survey, that survey will cover areas and , with 70 minutes per pointing. A parallel northern effort is underway at Effelsberg Radio Telescope, affording a full sky survey for pulsars and transients. The low and intermediate latitude surveys share common areas of sky coverage to previous surveys which employed the analogue filterbank installed on the Parkes 20-cm Multibeam receiver. The “Parkes Multibeam Survey” (Manchester et al., 2001) covered with 35-minute pointings, and was searched for single pulses by McLaughlin et al. (2006) and Keane et al. (2010), revealing the bulk of the currently recognised RRATs. Hereafter we refer to those two searches collectively as the PKSMB searches. At higher Galactic latitudes, a single-pulse search was performed on the Edwards et al. (2001) and Jacoby et al. (2009) surveys by Burke-Spolaor & Bailes (2010) (hereafter BSB). Despite the common sky coverage and high success rate of the BSB and PKSMB searches, we nevertheless expect to discover new sources of pulsed radio emission in these areas; some pulsing radio sources may not have been previously detected due to the source’s low event rate, insufficient sensitivity in previous surveys, or the improved dynamic range of the BPSR observing system over the previous analogue filterbank system installed on the Parkes multibeam receiver, whose dynamic range was hurt by -statistics (explored in more detail in §2.2 below).
In this manuscript, we present the search methods, sensitivity, and current status of the HTRU survey single-pulse search (§2). Because this survey required concurrent searches using periodicity and single-pulse techniques, it affords the opportunity to explore efficient modes of search operation, attempting to perform these techniques in parallel with a minimum of duplicated computing effort. We also report on initial discoveries in the intermediate- and high-latitude surveys (§3). In §4, we explore the detectability of our discoveries in previous surveys of overlapping regions, present our new discoveries in terms of the windowing description of pulsar intermittence presented in BSB, and make predictions for the sparsely-emitting radio neutron stars that the full HTRU survey will uncover.
2 The HTRU Survey’s Single-pulse (SP) Search
2.1 Data Analysis Pipeline
Thus far all processing and analysis has been carried out using the “Green Machine” supercomputer at the Swinburne Centre for Astrophysics and Supercomputing. The pipeline employs several standard search techniques (e. g. dedispersion and boxcar matched filtering, multi-beam coincidence matching; Cordes & McLaughlin 2003; Deneva et al. 2009; Keane et al. 2010; BSB), and several novel techniques (e. g. independent-event identification and inspection). The basic methodology of the SP search is based on that described by BSB.
There are two main bottlenecks in the HTRU survey’s single-pulse search. The first is the computational load demanded by the dedispersion of our data, and the second is the number of candidates which need to be manually assessed. The single-pulse data reduction pipeline design includes schema that aim to abate both of these. First, we minimise the net computational time of the periodicity and SP searches by integrating the SP search into the hitrun processing pipeline introduced in HTRU Paper 1. By doing this, the interference excision and dedispersion described in HTRU Paper 1 is done only once, producing each data stream’s results simultaneously for use in the single-pulse search and the periodicity search. As described below, the time series search for single pulses is performed while each time series is still in the computer’s “random access memory”, and for each 9-minute data stream adds 2.5 minutes of processing time onto the total 3-hour timescale for the hitrun Fourier-based pipeline. We stress that the added computational load of including a single pulse search to a traditional Fourier search is negligible.
We address the issue of large candidate numbers by identifying independent events across multiple dispersion, boxcar trials, and beams, and by performing a simple threshold-based interference zapping. The simultaneous processing and viewing of data from multiple beams decreases the occurrence of candidates caused by low-level, local interference and greatly increases the speed at which the manual assessment of a candidate can be made. However, due to limited computational resources, we cannot store all 13 beams on one node, requiring the use of a monitor to track and collect beams from each pointing as they are processed.
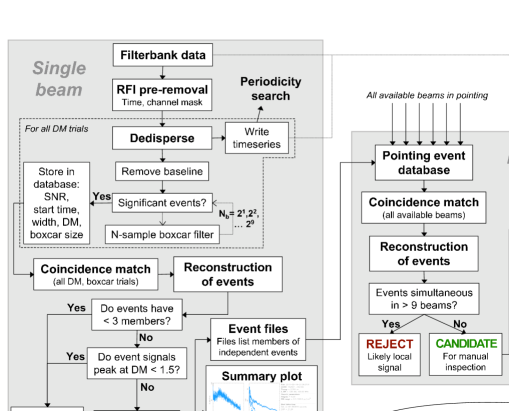
The single-beam SP search and the multibeam data monitor are described below. Figure 1 gives a schematic diagram for the pipeline, showing one beam and the multibeam monitor.
2.1.1 Single-beam Processing
For each observation, a multibeam monitor is initiated and the available beams for that pointing are submitted in sequence for processing on the supercomputer, each processed independently using the hitrun pipeline. For this pipeline we begin with 2-bit filterbank data with the sampling properties of which are summarised in Table 1. Pre-analysis radio frequency interference excision is done first, as detailed in HTRU Paper 1. In brief, this excision creates and uses both a frequency and a time mask that flags periodic-interference-affected channels and time samples with a signal above a signal-to-noise ratio (SNR) of more than 5. Flagged time samples are replaced in the filterbank file with noise drawn from adjacent unflagged samples, while offending frequency channels are blanked. While the time-domain interference excision weakens the SNR of bright signals of s) pc cm-3, where is the pulse’s width, it allows us to produce and inspect candidates down to DM 1 pc cm-3 while maintaining a manageable false detection rate at the manual inspection stage.
| Latitude region | ||
| Parameter | Inter. | High |
| Avg. pointing duration (s) | 540 | 270 |
| Total time processed | 3490 h | 140 h |
| Total area processed† | 7671 deg2 | 591 deg2 |
| Fraction of total survey | 23.5% | 0.39% |
| Center frequency (MHz) | 1352 | |
| Total bandwidth (, MHz) | 340 | |
| Typical usable | 870 | |
| Sampling time (, s) | 64 | |
We perform dedispersion at 1196 trial DMs over the range 0 to using the dedisperse_all program.111This software and the C++ gtools library, which is drawn from by dedisperse_all for single-pulse functionality and contains the SP search algorithms, candidate matching functions, and SP candidate type classes, are available from http://www.github.com/swinlegion After reading the input filterbank data into computer memory, time series are formed for each DM trial; the efficient dedispersion aspect of the dedisperse_all code is described in detail by HTRU Paper 1. As the time series data stream at each DM trial is produced, it is searched for single pulses with parameters as in BSB. Our input search parameters differ only in that the boxcar filter used in our search ranges in size to 512 samples, and that events separated by more than 10 samples (640 s) were considered independent. All significant (as defined by our pre-set SNR threshold, , detailed below) events in each boxcar and DM trial are recorded and stored in a database. At the completion of dedispersion of all trial DMs, dedisperse_all performs a temporal coincidence matching (similar to the “friends-of-friends” method developed by Huchra & Geller (1982) and used by Deneva et al. (2009) and BSB to identify time-coincident event clusters). Each event is defined by the parameters (DM, boxcar filter, width, time) at which the signal-to-noise is found to be the greatest, and consists of members at other DM and boxcar trials found to be coincident.
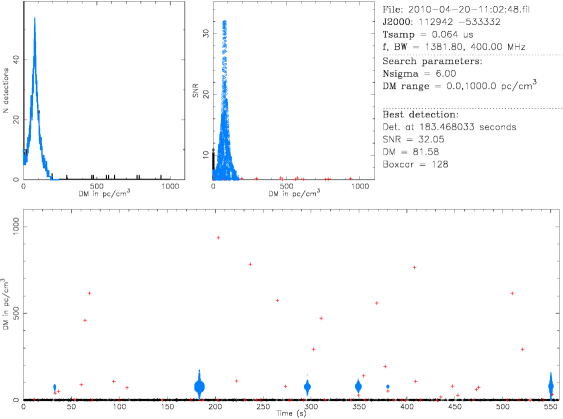
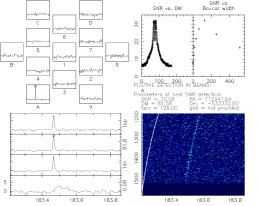
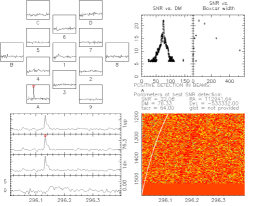
The presence of man-made interference (i. e. radar communications, satellite and aircraft transmissions, on-site hardware, and a number of other sources) during observations causes the noise in our time series data to follow a non-Gaussian distribution. These signals are typically either not dispersed, or dispersed to a level that is undetectable in our data, and therefore the zero-DM timeseries interference mitigation performed before processing removes the bulk of these signals. After interference pre-removal, however, some low-level inteference signals remain, and we employ pre-set search thresholds to balance the false detection rate. For most data, the interference pre-removal allows time series at trials above pc cm-3, in the absence of our target astrophysical signals, to be roughly Gaussian-distributed. At lower dispersion trials, the false detection rate becomes unmanageable, and we therefore set a dispersion-based threshold to reject all events found with a peak SNR at pc cm-3. For each 9-minute intermediate latitude beam, we produce 1196 dedispersed time series of samples. Our total number of searched data points for each file consists therefore of . In Gaussian-distributed data, at our SNR threshold of we would expect approximately 50 independent random noise detections per file. We attempt to filter these events by automatically rejecting events which have less than three associated members. This is an effective method of Gaussian event rejection; noise peaks at a SNR of 12 or below are not likely to exhibit in more than two trials, assuming the peak’s signal between DM steps and boxcar trials drops by at least . Furthermore, the number of statistically random events above is negligible, even when considering analysis of the full HTRU intermediate latitude survey. This strategy impacts weakly on our sensitivity to events of that have . However, in concert this event-match-based candidate rejection typically reduces the number of candidates by a further factor of 100–1000, and much more for data badly affected by interference. In Fig. 2, we show the two visual inspection plots used for manual candidate descrimination. For the observation displayed, the telescope was pointed at PSR J1129–53, a known RRAT (BSB). The six pulses emitted by the pulsar in this pointing were correctly discriminated by the software from zero-dispersion interference and from spurious peaks in the data.
All non-interference events are then written to disk by dedisperse_all, producing one ASCII file per event, in which all members of that event are listed. At this stage, the single-pulse events for the beam are gathered by the multibeam data monitor associated with the beam’s pointing. The time series are written to disk, stored for use in the periodicity search and for later access by the multibeam data monitor.
2.1.2 Multibeam Data Monitor
As single-pulse events are produced for all the beams associated with one pointing, the multibeam monitor for that pointing collects the events and performs a temporal coincidence match of identical form to that done by dedisperse_all, however it is performed for events from different beams.
The Parkes 20-cm multibeam receiving system allows the simultaneous observation of 13 positions on the sky with approximately 30 arcminutes between beam positions, and each beam has a sensitivity fall-off on scales of 30 arcminutes from its pointing centre (Staveley-Smith et al., 1996). Pointlike radio sources boresight to the telescope pointing direction will therefore typically be detected in a maximum of three beams of the receiver. Particularly luminous objects like the Vela Pulsar, which emits single pulses with peak flux densities of up to 60 Jy, may be detected in up to 7 beams when ideally positioned in the multibeam field. Typically, signals of sufficient brightness to appear in all beams at similar intensity, i. e. through a far sidelobe of the telescope, are generated by terrestrial or near-Earth sources (such as satellites or aircraft). Therefore, as in BSB, we do not inspect candidates which were detected in more than nine of the thirteen beams. This filter decreases our sensitivity to the terrestrial “Perytons” of Burke-Spolaor et al. (2011), however there is significant benefit gained through decrease in the false detection rate per pointing. A search of the data aimed specifically at detecting Perytons is planned for the near future. All events occurring in nine beams or less are imaged as described in BSB, collecting the relevant filterbank and time series data from the original on-disk location of the single beams. When both single-pulse and pulsar searches have been completed, the data is freed for removal from disk.
Finally, a pointing’s result plots (i. e. those for individual beams and events as in Fig. 2) are manually assessed to determine whether they contain a detection of interest. The “beam summary” plot has superiour sensitivity to objects emitting multiple pulses with signals at or just exceeding the detection threshold, while the single-event plots allow a user swift discrimination between interesting candidates and falsely-identified interference or noise. During the manual inspection stage, results are also compared with the most up-to-date version of the Australia Telescope National Facility Pulsar Catalogue originally published by Manchester et al. (2005).
2.2 Search Sensitivity
The sky coverage of the HTRU survey includes regions covered by previous surveys that have been searched for single-pulses. Particularly for the HTRU intermediate latitude survey, we have direct overlap with the areas searched by BSB and PKSMB. Here we calculate our sensitivity to transient events and make a comparison to these surveys.

Instrumental and interstellar pulse broadening serves to weaken the SNR of the pulse from its signal at the pulse’s intrinsic width, . All instrumental broadening effects are in principle avoidable, therefore the back-end design of any observing system aims to reach the scatter-broadening limit, as this is the theoretical best that a pulsar/transients survey can achieve. As noted in HTRU Paper 1, for a large range in DMs the improved time and frequency resolutions of the HTRU survey causes pulse broadening from interstellar propagation to dominate over intrachannel dispersion broadening (). Using the empirical DM-scatter broadening relation given by Bhat et al. (2004), scatter broadening () typically dominates over hardware-induced smearing above a DM of 230 for the HTRU survey (note, however, that the scatter of individual pulsars in the Bhat et al. relation means that individual objects may deviate by up to an order of magnitude). To calculate our sensitivity to single pulses, we take these pulse-scattering and broadening effects into account.
Following e.,g. Lorimer & Kramer (2005), the observed pulse width depends on and various pulse-broadening effects by . Note that our step size between DM trials is chosen such that the broadening due to an error in DM is small compared to other broadening effects. If the observed peak flux density for a pulse is given by , our sensitivity limit for the intrinsic peak flux density of single pulses with observed duration is then
| (1) |
(c.f. Lorimer & Kramer, 2005), where K is the system temperature of the multibeam system, is the telescope gain (ranging from 0.735–0.581 K Jy-1, from the central to outer beams), and is the number of summed polarisations in the data. is a factor of order 1 that is included to represent signal losses due to system imperfections (for BPSR’s two-bit digitisation, , following from Kouwenhoven & Voute 2001). In Fig. 3, we indicate our sensitivity to single pulses of various durations as a function of DM, and in comparison to the sensitivities of PKSMB and BSB.
The 2-bit digitisation levels of the BPSR instrument and large number of frequency channels result in the increased dynamic range capabilities over the previous Parkes analogue filterbank. We made empirical measurements of the mean () and standard deviation () of HTRU survey data judged by eye to not be strongly affected by interference. Using these values, we calculate the highest achievable SNR in the HTRU survey data for pulses with to be . This is in good agreement with the SNR of saturated interference pulses observed in time series. For the 1-bit, 96-channel analogue filterbank, the maximum SNR may be calculated analytically, using a binomial probability distribution. The theoretical maximum SNR of this system at is then ; again, this agrees with saturated interference signals observed in data from this system. The differences in dynamic range for these observing backends do not strictly impact the flux sensitivity of a single-pulse search, however the HTRU survey’s increase in dynamic range will affect the manual inspection stage by allowing detections of potentially very bright, narrow pulses to be more clearly discernible from noise or non-Gaussian statistics in the observation. This effect is more acute for pulses of width close to the sampling time of each survey.
The improved time/frequency resolutions and dynamic range of the HTRU survey is clearly beneficial for the detection of the narrow single pulses of pulsars and RRATs, and extragalactic impulse emitters with durations ms and DMs of . For , we do not expect to see a large number of new RRAT discoveries for several reasons; first, we do not have a considerable increase in sensitivity over the previous surveys for these DMs, and the number of known RRATs above this DM represents only 10% of the known population. Additionally, for , the 35-minute pointing duration of PKSMB searches afford a greater probability of detection of low-pulsation rate events over our 8.5-minute observations of these areas, and we offer minimal improvements for the capability of detection of these objects. At higher latitudes, for the bulk of pointing positions in the HTRU survey the number density of electrons in the Galaxy is insufficient to produce a DM much greater than (Cordes & Lazio, 2002). For these reasons, we expect most new rotating radio transient and high nulling-fraction pulsar discoveries to be at DMs . As detailed in §3 and §4.1, this is true for the initial discoveries.
2.3 Current Processing Status
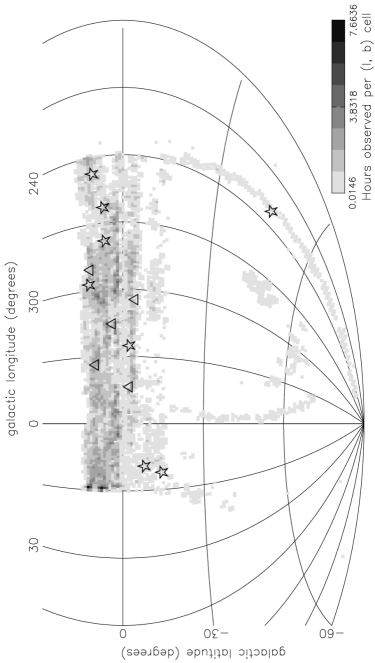
The current status of the HTRU survey’s processing is summarised in the upper panel of Table 1. The processing reported in this paper includes only pointings from the HTRU intermediate and high latitude surveys. The survey coverage to date is not contiguous over all Galactic regions. We indicate the total observation time of the processed pointings as a function of sky position in Figure 4. In total, 22,273 and 1,718 beams have been processed out of the 95,056 and 443,287 total beams of the intermediate and high latitude surveys, respectively. Approximately 160 incomplete survey pointings of shorter duration have also been processed. As implied by Fig. 4, the bulk of observing time reported in this paper has been spent at Galactic latitudes .
2.4 Candidate Ranking and Follow-up Strategy
We employ a follow-up prioritisation scheme for our single-pulse candidates to provide maximum scientific return with available observing time. Based on the strength of the candidate in various panels of the manual inspection plots and the number of detections at a similar DM in a pointing (Fig. 2), candidates are ranked as multi-pulse (two or more strong pulses detected at similar DM), strong (2 weak pulses, or one convincing pulse detected, that is with a and exhibiting a characteristic signature in the SNR vs. DM plot, e. g. as explored by Cordes & McLaughlin 2003), or weak (a detection appearing pointlike in the multibeam field, but poorly supported by other inspection panels and/or has ). Weak candidates outnumber those ranked strong and multi-pulse by a factor of more than two. All candidates that are not found in available archival data with pointings near the discovery position are reobserved for a duration equal to that of the discovery pointing. If weak detections are not seen in the initial follow-up pointing, they are not tracked in further follow-up observations. We do not include these detections in this report due to their highly uncertain nature, however we preserve them in a database for posterity, considering that borderline detections in future surveys of the same sky area could cross-correlate their findings with our weak, unconfirmed detections. This will be possible with the HTRU low-latitude survey, and potentially with future Australian Square Kilometre Array Pathfinder/Square Kilometre Array surveys. Multi-pulse and strong candidates not seen in initial follow-up are observed again for a duration of three times the discovery pointing. Our ranking levels are set such that the strong and multi-pulse categories are highly unlikely to contain detections of spurious noise. We include all such candidates here, with objects not detected in follow-up observations distinguished in Table 2 by an upper limit on the objects pulsation rate (, quoted as number of pulses per hour); this reflects that non-detections of these discoveries are used only to place limits on for the object. While the limits are well within the range of pulsation rates for known RRATs, these objects essentially remain unconfirmed, and care must be taken in including these objects in statistical or categorical transients studies (note, however, that PSR J1424–56 is confirmed by the reported detection of PSR J1423–56 by Keane (2010b), as discussed below.
| Pointing centre | Speak | ||||||
|---|---|---|---|---|---|---|---|
| PSRJ | RAJ | DECJ | P (s) | (h-1) | DM | (ms) | (mJy) |
| J0410–31 | 04:10:39 | –31:07:29 | 1.8785(2) | 107 | 9.2(3) | 18 | 470 |
| J0837–24 | 08:37:44 | –24:47:48 | – | 5 | 142.8(5) | 1 | 420 |
| J0912–38 | 09:12:27 | –38:48:34 | 1.5262(1) | 32 | 73.3(5) | 6 | 190 |
| J1014–48 | 10:14:18 | –48:49:42 | 1.5088(2) | 16 | 87(7) | 21 | 140 |
| J1135–49† | 11:35:56 | –49:25:31 | – | 1.3 | 114(20) | 9 | 120 |
| J1216–50 | 12:16:20 | –50:27:01 | 6.355(9) | 13 | 110(20) | 9 | 130 |
| J1307–67∗ | 13:07:41 | –67:03:27 | 3.65120(8) | 11 | 47(15) | 32 | 70 |
| J1424–56∗ | 14:24:23 | –56:40:47 | – | 7 | 27(5) | 22 | 110 |
| J1541–42† | 15:41:55 | –42:18:50 | – | 7 | 60(10) | 4 | 150 |
| J1549–57 | 15:49:05 | –57:21:37 | 0.7375(3) | 73 | 17.7(3.5) | 4 | 210 |
| J1709–43† | 17:09:47 | –43:54:43 | – | 7 | 228(20) | 3 | 240 |
| J1854–1557 | 18:54:53.6 | -15:57:22(20) | 3.4532(1) | 25 | 160(25) | 65 | 50 |
| J1925–16 | 19:25:06 | –16:01:00 | 3.8858(2) | 6.5 | 88(20) | 10 | 160 |
3 Early Discoveries & Detections
3.1 New Discoveries
Table 2 lists basic parameters of the 13 new and confirmed objects discovered thus far using the HTRU survey’s single-pulse pipeline. There are several objects worthy of specific note.
PSR J0410–31, at Galactic coordinates , is the only confirmed single-pulse discovery arising thus far from the high-latitude survey. The DM of this pulsar is low, with , lower than 98.9% of known radio pulsars. Estimating distance to the new discoveries using their DMs and the Cordes & Lazio (2002) electron density model for the Galaxy (hereafter NE2001), we find that this is also the most nearby object discovered in our search ( kpc).
PSR J0912—38 was also detected in the HTRU survey’s Fourier-domain search. Bright single pulses were only detectable above the noise for 30 seconds in both the discovery and follow-up observations. When the data are folded over pulses not detected by the single-event search, the pulsar remains detectable with a signal-to-noise ratio of 5; this behaviour is not consistent with scintillation. The abrupt change in flux density and the occurrence of these short-duration flares in both observations lead us to suggest they are intrinsic to the star.
The pulses of PSR J1014–48 were only detected in one cluster spread over 16 rotations of the neutron star. Like PSR J1825–33 of BSB, no outbursts have yet been detected in follow-up observations.
We are confident that PSR J1307–67 is the PSR J1308–67 of Keane (2010b), who reports a solitary pulse discovery at and a position with errors in agreement with our pointing position. Upon searching the archival data closest in position to our discovery, we found 7 pulses with a signal-to-noise ratio of 5, from which the period reported in Table 2 was determined. Similarly, we are confident that PSR J1424–56 is the PSR J1423–56 of Keane (2010b), who reports and , both consistent with our findings. Timing solutions will solve the positional and naming ambiguities of these objects.
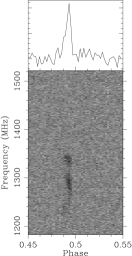
Broad-bandwidth amplitude modulation features are seen in the frequency-dependent structure of the single pulses of PSR J1549–57 (see Fig. 5), the bandwidth of which are inconsistent with the predicted scintillation bandwidth of NE2001 by four orders of magnitude. The origin of this feature is unknown, however despite the significant disagreement with the NE2001 prediction, it is likely to be scintillation if the detected emission is produced by a neutron star.
The predicted scatter broadening of PSR J1709–43 (130 ms at 1.375 GHz for the NE2001 model) is much greater than the half-maximum pulse width detected here. The single pulse from this object had a signal to noise ratio of 10, a visible dispersion curve, a signal-to-noise versus DM curve well-fit to the model of Cordes & McLaughlin (2003) for a genuinely dispersed pulse, and exists in a relatively interference-free observation. These conflicting properties indicate that either the impulse’s origin is not celestial, or that the NE2001 scattering model for this Galactic position is incorrect; the latter is highly possible to be the case here, as scattering is highly dependent on line-of-sight. A redetection of this candidate would conclusively clarify the nature of this candidate, however follow-up has not yet been performed.
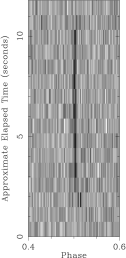
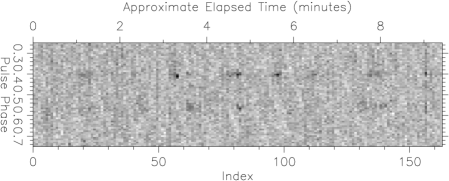
PSR J1854–1557 appears to be exhibiting periodic nulling, drifting, and mode-changing behaviours (Fig. 6). Despite a high nulling fraction, this object’s relatively frequent emission renders it detectable in a Fourier search with a signal to noise ratio of 17 in the 8.5-minute survey and follow-up pointings. This object was also detected in the Fourier pipeline, as reported in HTRU Paper 1.
3.2 Redetections of Known Pulsars and RRATs
The single-pulse pipeline has detected approximately 55% of the known pulsars that could be detected through Fourier searches of the HTRU survey data. This is an unexpectedly large fraction, and it offers improvements over the single-pulse detection rates presented in BSB and PKSMB, perhaps a testament to the increased sensitivity to faint and narrow single pulses that this survey’s hardware affords. The single-pulse properties of these objects will be analysed in future work, so we will not detail them here.
We have processed 24 observations with pointing positions within 6 arcminutes (our approximate half-power beam width) of published RRAT positions (i. e. from McLaughlin et al. 2006, McLaughlin et al. 2009, Keane et al. 2010, Burke-Spolaor & Bailes 2010). Of these 24, 13 RRATs were redetected. For 22 of 24 observations, the number of pulses seen from each object was consistent with the expected number based on previously published pulsation rates in the discovery observations of these objects (again, as drawn from the BSB and PKSMB publications) and the observation length in our data. The two notably different detection rates were of RRATs J1753–38 (BSB; 4 expected and seen) and J1819–1458 (McLaughlin et al. 2006; 3 expected and 10 seen). PSR J1819–1458 is known to exhibit small variations in pulsation rate (and larger ones associated with glitches, Lyne et al., 2009), and the detection rate observed here is consistent with the range in reported by Lyne et al. (2009). For PSR J1753–38, the higher detection rate, detectability in a Fourier search with a signal-to-noise ratio of 13 (whereas it was undetectable in a Fourier search of its original discovery data), and the slight increase in exhibited in our observations indicate that: 1) this pulsar’s emission appears to simply be highly modulated rather than nulling, and 2) our observing position of the source is improved from that reported by BSB. Our positional offset was 0.1 degrees, suggesting an improved position of right ascension and declination 17:53:09, –38:52:13 (J2000).
4 Discussion
4.1 Our Discoveries in Archival Pulsar Surveys
All of our discoveries except for PSR J0410–31 and PSR J0837–24 lie in regions previously covered by the surveys of Jacoby et al. (2009); Edwards et al. (2001) and Manchester et al. (2001). The presence of pulses in archival data can add valuable information about pulse rate changes over time, and potentially add data points to their timing if a phase-coherent timing solution is obtained. The detection of J1307–67 and J1424–56 in archival data have already been discussed in Sec. 3.1. We inspected data in the archival surveys within one half-power beam width of our other objects’ positions to determine the detectability of our discoveries in the archival data. None of our objects were detected in these pointings in single pulses. However, while PSR J1854–1557 is not detectable in a Fourier search, it is marginally detectable when the archival data are folded over the period given in Table 2.
We investigate the reason for the non-detection of the remaining objects by first estimating the signal loss due to the use of the analogue multibeam filterbank system used by BSB and PKSMB, calculating the SNR that a pulse of equivalent width, DM, and (as listed in Table 2) would have shown in the archival data. This analysis suggests that even the brightest detected pulses in our data would result in only a marginal () detection in the analogue filterbank data for PSRs J1135–49, J1541–42, and J1709–43. For two out of four of the remaining objects at , for which the archival data length was 4.4 minutes, the non-detections are accounted for by the low probability that a pulse would occur during the time span of the observation. The remaining objects, PSR J0912–38 and PSR J1014–48, had clusters of sequential pulses rather than a smooth distribution of single pulses. Although the per-hour pulsation rate is high for these objects, the duration of on-activity is short, and the spacing between sequential pulse outbursts is 8 minutes. This indicates that the non-detection of pulses is consistent with a decreased probability of the occurrence of a pulse outburst during the archival observations. The effect of on- and off-timescales on object detectability will be discussed further in Sec. 4.2.
The only remaining undetected object is PSR J1549–57. We have not yet performed follow-up observations on this object, and so the archival data, in which we would have expected to see detections of , serves only to place limits on the pulsation rate and duration of off-activity in these objects. The non-detection in two archival pointings places a strong limit (zero pulses in 70 m) on these values.
4.2 Activity Timescales in Sparsely-emitting Neutron Stars
Approximately 1/3 of our single-pulse pipeline discoveries exhibit distinct periods of on-activity, marked by bright sequential pulses that are separated by longer intervals of either genuine nulls, or a decrease in intensity level sufficiently large that the object is undetectable through single pulse or periodicity search techniques during the null state. The pulsation rate, , that is typically quoted for single-pulse discoveries poorly represents the emissivity of such objects. It provides insufficient information to assess either the probability of discovering such a neutron star in a given observation, or of detecting such an object during a reobservation.
Considering this and the significant capability of the HTRU survey to discover new genuinely sparsely-emitting objects (see §4.4), we seek to more accurately incorporate our discoveries and RRAT populations in general into the range of nulling and emissivity timescales exhibited by radio pulsars. We explore a relevant “intermittence parameter space” here, and review in §4.3 what effect survey parameters have on the selection of various populations in this space.
We note that the on- and off-states of nulling pulsars typically show characteristic lengths (Herfindal & Rankin, 2007; Redman & Rankin, 2009; Wang et al., 2007), parameterised below by and , respectively. This description of neutron star intermittence is more physically representative for pulsars of various nulling fractions, better reflects the timescales associated with possible windowing phenomena, and allows a more accurate exploration of selection effects for surveys of various length (see §4.3). Here we use a definition of that is similar to the “null length” of Wang et al. (2007). We define as the average time between the first pulse whose signal drops below a set threshold (we use ) and the next above that threshold. We define as the average number of pulses () above the same threshold, times the rotational period of the object. Obviously, such values are only valid for genuine nulling pulsars, that is this analysis is inappropriate for highly modulated pulsars with long-tailed pulse energy distributions (e. g. Weltevrede et al., 2006). Uninterrupted data spans of containing single-pulse detections of high significance (that is, where the single pulse energy distribution of the on-pulses is such that all pulses exceed the threshold) would provide the most accurate measurements of these quantities; for our discoveries, most observations provide robust single-pulse detections, although we are insensitive to timescales minutes. We nevertheless make estimates of (or place limits on, in observations where no timescales are measureable because they appear greater than our data span) the average for our discoveries based on all available data.
The nulling fraction of a pulsar is only valid in this analysis when measured over a timescale far exceeding one activity cycle of the object, which is given by a length . Below we generically represent the nulling fraction measured over “infinite time” as , where accordingly, the pulsar’s on fraction measured over a time is given by . As an example, the pulsar PSR B1931+24 exhibits periods of activity lasting 5-7 days, separated by nulls of 30 days (Kramer et al., 2006). While the nulling fraction measured over short observational timescales is therefore typically either 0.0 or 1.0, we find that .
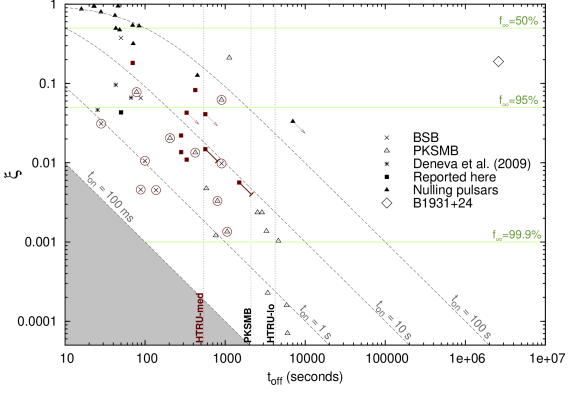
In Figure 7, we plot as a function of for the single-pulse discoveries from HTRU, PKSMB, BSB, and Deneva et al. (2009). We also plot all nulling pulsars analysed by Wang et al. (2007) that have a non-zero nulling fraction. The Wang et al. sample was selected from the periodicity-discovered pulsars of the same survey as the PKSMB searches, and has poor sensitivity to nulls of s due to the averaging performed over 10-30 s timescales. The dashed grey lines in this figure show contours of constant . For a pulsar of period , it is not straight-forward to identify on- or off-activity timescales of duration ; the shaded region below ms indicates the area for which is shorter than the period range of single-pulse search discoveries that emit at .
One critical point illustrated by this plot is the continuous transition between the Wang et al. (2007) nulling pulsars and the population discovered by single-pulse searches. McLaughlin & Cordes (2003) derive that neutron stars of period will be more readily discovered in a single-pulse search, (i. e. having SNR ratio ) when , leading Keane (2010a) to note that this effect causes - and -based selection effects for single pulse searches. For the HTRU intermediate latitude survey pointings, pulsars with periods s should therefore be discovered more readily in the Fourier pipeline at , and thus it is not surprising that no HTRU intermediate latitude survey points lie above this line in Fig. 7. For the min pointings of the Parkes Multibeam survey (Manchester et al., 2001), when to , considering a period range 200 ms to 6 s. Appropriately, this appears to be the region in Fig. 7 where the nulling pulsars give way to the single-pulse discoveries. It is clear here that the on and off timescales, and the nulling fractions of the radio pulsars discovered in single-pulse searches exhibit a smooth distribution over many orders of magnitude with no obvious distinction of the RRAT population represented by the single-pulse discoveries. A rigorous nulling fraction analysis for bright pulsars in the HTRU intermediate latitude survey is planned for the near future, and is capable of addressing whether the objects discovered by single-pulse searches represent a smooth extension in the probability density function of pulsar nulling fractions.
4.3 Detectability of Intermittent Neutron Star Populations
The distribution of objects in Figure 7 is influenced by a number of selection effects, which we explore here both to investigate the underlying distribution of activity cycles in neutron stars, and to determine the population to which the three HTRU survey components will be sensitive.
Considering the general detectability of pulsars in this phase space, the probability that at least one pulse will be emitted by a bright pulsar during an observation of length is given by:
| (2) |
Note, however, that this probability is generally representative and will hold for a sample of many sources, but will not always be strictly true for an individual source as the distribution of and for a single object is not a delta function. Following this equation, the vertical lines in Fig. 7 mark the null length below which a sufficiently bright emitter has a probability of unity that it will be detected in the Parkes Multibeam survey, the HTRU intermediate latitude survey, and the (recently commenced) low-latitude survey, respectively. At null lengths greater than the observing time for these surveys, the probability of detection quickly decreases. Accordingly, given a population of pulsars with a flat underlying distribution in or log(), we would expect to have a higher discovery/detection rate of objects with . Focussing on the objects detected by the HTRU intermediate latitude survey (highlighted in maroon in Fig. 7), the distribution is roughly consistent with a flat distribution in log(), with a ratio of 7:13 for objects with min to objects with min. We point out that the object of the highest discovered in each of the PKSMB, BSB, and HTRU intermediate latitude surveys is roughly a factor of three greater than the corresponding survey’s length. This corresponds to at all nulling fractions.
Equation 2 indicates that on average for , the probability a source would be detected is one, and for , it is directly proportional to . It is apparent in Fig. 7 that there is a drop in Parkes Multibeam detections in the region min, s. That is, if the underlying neutron star population has a flat distribution in both and or log() and log(), there appears to be a deficit of objects in this region. For objects with (that is, those theoretically detectable in a Fourier-search), there is no explicitly stated reason that Wang et al. (2007) should have selected against this range of timescales. The paucity of objects occupying this region could be the combined result of a number of possible effects. Nulling behaviour may have not yet been either observed or recognised, however we would expect this to only be the case for objects with min, which encompasses only a small fraction of the region in question. It is possible that some low or intermediate nulling-fraction objects with were outright rejected from the survey due to a non-appearance in follow-up observations. We consider this an unlikely cause, however, as the 6-minute grid pointings and subsequent 35-minute follow-up pointings (in case of a non-detection in the grid observation, Manchester et al. 2001) would have provided a sufficiently high redetection probability, particularly for objects with . We note that for objects with close to 35 minutes, the survey’s follow-up observations might contain only a few pulses from the objects, which are detectable in single pulses, rather than in the Fourier search used to assess the follow-up pointings in the survey. However, this effect still does not account for the notable detection rate drop in the region in question.
It is furthermore possible that the lack of objects in this region reflects an actual drop in the neutron star population for objects with s. This supposition is questioned, however, by the existence of the “intermittent pulsar” B1931+24 reported by Kramer et al. (2006). This object is isolated in this space, although it has been indicated that a handful of further unpublished objects occupy a similar region of Fig. 7 (Keith, 2007; Eatough, 2009). The existence of these objects suggests that either there is a bridging distribution of neutron stars which we have not yet identified due to an unrecognised effect of selection, or that in fact the intermittence of these objects is produced by a physically distinct mechanism. Immense observing timescales are required for a survey to have a high probability of detecting a population between the s objects and PSR B1931+24-like pulsars. Because data storage and analysis becomes problematic for pulsar surveys of longer timescale, we suggest that the brightest pulsars in this population may be more readily uncovered by the “transient-imaging” surveys that are being performed and planned on arrays; these surveys can sample timescales down to the correlator averaging time (typically 10 s) and up to several hours to days. However, for pulsars with less than these timescales, pulsar surveys remain the most robust probes of intermittent populations.
4.4 Discovery Forecast for the Full HTRU Survey
The rate of new single-pulse discoveries in the HTRU survey, particularly those in overlapping regions of previous surveys, hint at the potential for the full HTRU survey to uncover many new examples of sparsely-emitting neutron stars. For the intermediate latitude survey, we have detected a total of 26 new and known single-pulse emitters, suggesting detection rates on the order of deg-2 at these latitudes. We have processed roughly 23.5% of the intermediate latitude survey to date, and if our discovery rate continues, the full HTRU intermediate latitude survey data should contribute an additional estimated 50 new discoveries of transient neutron stars. We note that the sky distribution of neutron stars should have a higher density at lower Galactic latitudes, and as seen in Figure 4 we have not yet processed most of the pointings at latitudes closest to . At higher latitudes we have only processed a small fraction of the survey, and while tempting to take an extrapolated value as an upper limit, we note that our single discovery in only 0.39% of the high latitude survey implies a sky density of deg-2, higher than expected when compared to the sky density at lower latitudes. Therefore, the detections are expected to be less than 250.
Finally, the explorations of Sections 4.2 and 4.3 have accented the timescales of neutron star intermittence accessable by the HTRU survey. In particular, the HTRU low-latitude survey (with its 70-minute pointing length) will mark a significant increase in detection rate over the PKSMB survey for objects with min, and may be realistically expected to discover objects with null lengths up to h, if such objects exist (as deduced in §4.3, in which it was noted that transients surveys have all been able to discover objects with values of up to 3 times the survey pointing length; see also Fig. 7). The low latitude survey will also provide data that may be used to investigate the possible deficit of low-nulling-fraction objects with s. Care must be taken during both the single-pulse and periodicity searches, analysis, and follow-up, such that if these objects do exist, they are not selected against. This will involve, for one, appropriate follow-up monitoring of the stronger Fourier candidates that are undetected in initial follow-up pointings.
5 Summary and Conclusions
We have presented the methods of and initial discoveries for the single-pulse analysis of the High Time Resolution Universe Survey. We outlined the design of the HTRU survey’s single-pulse pipeline, which functions efficiently alongside the Fourier-analysis pipeline; the single-pulse analysis furthermore employs a “friend of friends” single-event recognition algorithm and performs automated interference rejection based on the dispersive and multi-beam signature of single events. The new digital backend used to collect HTRU survey data has afforded a factor of up to 5 times improvement in sensitivitiy over previous surveys in overlapping Galactic regions, and offers the most significant improvements for short (sub-ms duration) pulses at low () DMs.
Analysis of 23.5% and 0.39% of HTRU intermediate and high Galactic latitude survey data, respectively, has resulted in the discovery of 12 and 1 new neutron stars. Much of the survey pointings covered Galactic regions that were previously surveyed and searched for single pulses (McLaughlin et al., 2006; Keane et al., 2010; Burke-Spolaor & Bailes, 2010); 11 of our new discoveries lie within these regions, and for the nine of these that were not visible in the archival data, their non-detection was consistent with either the signal degradation due to the use of the previous wider-channel analogue backend, or with the improbability of a pulse being emitted in the archival survey due to a long null cycle.
Finally, we investigated the distribution of nulling and emissivity timescales for the new single-pulse neutron star discoveries and redetections in the HTRU survey data, and for the RRAT/nulling population in general. We found that periodicity-discovered nulling pulsars and single-pulse search discoveries exhibit a continuous distribution across null/activity timescales and nulling fractions, building on evidence that many RRATs represent a tail of extreme-nulling pulsars. We found that there is an apparent decrease in objects with emissivity cycles longer than 300 seconds at intermediate and low nulling fractions which is not readily explained by selection effects, and note that the HTRU deep low-latitude survey will be capable of exploring whether this deficit is natural or an effect of selection. Lastly, we estimated that the full HTRU survey is capable of more than doubling the known extreme-nulling pulsar population, and will explore the neutron star population with nulling fractions exceeding 99.99%, and null lengths lasting up to 3-4 hours.
References
- Bhat et al. (2004) Bhat N. D. R., Cordes J. M., Camilo F., Nice D. J., Lorimer D. R., 2004, ApJ, 605, 759
- Burke-Spolaor & Bailes (2010) Burke-Spolaor S., Bailes M., 2010, MNRAS, 402, 855
- Burke-Spolaor et al. (2011) Burke-Spolaor S., Bailes M., Ekers R., Macquart J., Crawford III F., 2011, ApJ, 727, 18
- Cairns et al. (2001) Cairns I. H., Johnston S., Das P., 2001, ApJ Letters, 563, L65
- Cordes & Lazio (2002) Cordes J. M., Lazio T. J. W., 2002, ArXiv Astrophysics e-prints
- Cordes & McLaughlin (2003) Cordes J. M., McLaughlin M. A., 2003, ApJ, 596, 1142
- Deneva et al. (2009) Deneva J. S., Cordes J. M., McLaughlin M. A., Nice D. J., Lorimer D. R., Crawford F., Bhat N. D. R., Camilo F., Champion D. J., Freire P. C. C., et al. 2009, ApJ, 703, 2259
- Eatough (2009) Eatough R. P., 2009, PhD thesis, University of Manchester
- Edwards et al. (2001) Edwards R. T., Bailes M., van Straten W., Britton M. C., 2001, MNRAS, 326, 358
- Herfindal & Rankin (2007) Herfindal J. L., Rankin J. M., 2007, MNRAS, 380, 430
- Hessels et al. (2008) Hessels J. W. T., Ransom S. M., Kaspi V. M., Roberts M. S. E., Champion D. J., Stappers B. W., 2008, in C. Bassa, Z. Wang, A. Cumming, & V. M. Kaspi ed., 40 Years of Pulsars: Millisecond Pulsars, Magnetars and More Vol. 983 of American Institute of Physics Conference Series, The GBT350 Survey of the Northern Galactic Plane for Radio Pulsars and Transients. pp 613–615
- Huchra & Geller (1982) Huchra J. P., Geller M. J., 1982, ApJ, 257, 423
- Jacoby et al. (2009) Jacoby B. A., Bailes M., Ord S. M., Edwards R. T., Kulkarni S. R., 2009, ApJ, 699, 2009
- Johnston & Romani (2003) Johnston S., Romani R. W., 2003, ApJ Letters, 590, L95
- Keane (010a) Keane E. F., 2010a, proceedings of “High Time Resolution Astrophysics IV - The Era of Extremely Large Telescopes”
- Keane (010b) Keane E. F., 2010b, PhD thesis, University of Manchester
- Keane & Kramer (2008) Keane E. F., Kramer M., 2008, MNRAS, 391, 2009
- Keane et al. (2010) Keane E. F., Ludovici D. A., Eatough R. P., Kramer M., Lyne A. G., McLaughlin M. A., Stappers B. W., 2010, MNRAS, 401, 1057
- Keith (2007) Keith M. J., 2007, PhD thesis, University of Manchester
- Keith et al. (2010) Keith M. J., Jameson A., van Straten W., Bailes M., Johnston S., Kramer M., Possenti A., Bates S. D., Bhat N. D. R., Burgay M., Burke-Spolaor S., D’Amico N., Levin L., McMahon P. L., Milia S., Stappers B. W., 2010, MNRAS, p. 1356
- Kouwenhoven & Voute (2001) Kouwenhoven M. L. A., Voute J. L. L., 2001, A&A, 378, 700
- Kramer et al. (2006) Kramer M., Lyne A. G., O’Brien J. T., Jordan C. A., Lorimer D. R., 2006, Science, 312, 549
- Lorimer et al. (2007) Lorimer D. R., Bailes M., McLaughlin M. A., Narkevic D. J., Crawford F., 2007, Science, 318, 777
- Lorimer & Kramer (2005) Lorimer D. R., Kramer M., 2005, Handbook of Pulsar Astronomy
- Lyne et al. (2009) Lyne A. G., McLaughlin M. A., Keane E. F., Kramer M., Espinoza C. M., Stappers B. W., Palliyaguru N. T., Miller J., 2009, MNRAS, 400, 1439
- Manchester et al. (2005) Manchester R. N., Hobbs G. B., Teoh A., Hobbs M., 2005, AJ, 129, 1993
- Manchester et al. (2001) Manchester R. N., Lyne A. G., Camilo F., Bell J. F., Kaspi V. M., D’Amico N., McKay N. P. F., Crawford F., Stairs I. H., Possenti A., Kramer M., Sheppard D. C., 2001, MNRAS, 328, 17
- McLaughlin & Cordes (2003) McLaughlin M. A., Cordes J. M., 2003, ApJ, 596, 982
- McLaughlin et al. (2009) McLaughlin M. A., Lyne A. G., Keane E. F., Kramer M., Miller J. J., Lorimer D. R., Manchester R. N., Camilo F., Stairs I. H., 2009, MNRAS, 400, 1431
- McLaughlin et al. (2006) McLaughlin M. A., Lyne A. G., Lorimer D. R., Kramer M., Faulkner A. J., Manchester R. N., Cordes J. M., Camilo F., Possenti A., Stairs I. H., et al. 2006, Nature, 439, 817
- Miller et al. (tted) Miller J. J., McLaughlin M. A., Keane E. F., Kramer M., Lyne A. G., Lorimer D. R., Manchester R. N., Camilo F., submitted, MNRAS
- Redman & Rankin (2009) Redman S. L., Rankin J. M., 2009, MNRAS, 395, 1529
- Rubio-Herrera (2010) Rubio-Herrera E. A., 2010, PhD thesis, Universiteit van Amsterdam
- Staveley-Smith et al. (1996) Staveley-Smith L., Wilson W. E., Bird T. S., Disney M. J., Ekers R. D., Freeman K. C., Haynes R. F., Sinclair M. W., Vaile R. A., Webster R. L., Wright A. E., 1996, PASA, 13, 243
- Wang et al. (2007) Wang N., Manchester R. N., Johnston S., 2007, MNRAS, 377, 1383
- Weltevrede et al. (2010) Weltevrede P., Johnston S., Espinoza C. M., 2010, ArXiv e-prints
- Weltevrede et al. (2006) Weltevrede P., Stappers B. W., Rankin J. M., Wright G. A. E., 2006, ApJ Letters, 645, L149