Dengue epidemics and human mobility
Abstract
In this work we explore the effects of human mobility on the dispersion of a vector borne disease. We combine an already presented stochastic model for dengue with a simple representation of the daily motion of humans on a schematic city of 20x20 blocks with 100 inhabitants in each block. The pattern of motion of the individuals is described in terms of complex networks in which links connect different blocks and the link length distribution is in accordance with recent findings on human mobility. It is shown that human mobility can turn out to be the main driving force of the disease dispersal.
pacs:
87.10.Mn, 87.23.Ge, 05.10.GgI Introduction
Dengue fever is a vector borne disease produced by a flavivirus of the family flaviviridae Gubler (1998). The main vectors of dengue are Aedes aegypti and Aedes albopictus.
Dengue fever epidemics have been known for more then two centuries as benign fever epidemics appearing at intervals of one to several decades. Recently the number of countries affected by this epidemic has increased and severe forms have become more frequent.
The research aimed at producing dengue models for public policy use began with Newton and Reiter Newton and Reiter (1992) who introduced a minimal model for dengue in the form of a set of Ordinary Differential Equations (ODE) for the human population disaggregated in Susceptible, Exposed, Infected and Recovered compartments. The mosquitoes population was not modeled in this early work. A different starting point was taken by Focks et al. Focks et al. (1993a, b) that began by describing mosquitoes populations in a computer framework named Dynamic Table Model where later the human population (as well as the disease) was introduced Focks et al. (1995).
Newton and Reiter’s model (NR) favors economy of resources and mathematical accessibility, in contrast, Fock’s model emphasize realism, these models represent in Dengue two contrasting compromises in the standard trade off in modeling. A third starting point has been recently added. Otero and Solari (OS) developed a dengue model Otero and Solari (2010) which includes the evolution of the mosquitoes population Otero et al. (2006, 2008) and is spatially explicit. This last model is somewhat in between Fock’s and NR as it is formulated as a state-dependent Poisson model with exponentially distributed times.
ODE models have received most of the attention. Some of the works explore: variability of vector population Esteva and Vargas (1998), human population Esteva and Vargas (1999), the effects of hypothetical vertical transmission of Dengue in vectors Esteva and Vargas (2000), seasonality Bartley et al. (2002), age structure Pongsumpun and Tang (2003) as well as incomplete gamma distributions for the incubation and infectious times Chowella et al. (2007). Comparison with real epidemics has shown that there is a need to consider the spatial heterogeneity as well Favier et al. (2005).
In a previous work Otero et al. (2010) we have developed a dengue model which includes the evolution of the mosquitoes population and is spatially explicit. In that work the spatial spread of the infection was driven by the flights of the mosquitoes that gave rise to a diffusion process. In it we analyzed the evolution of dengue infection in a city of 20X20 blocks with 100 individuals in each one, this population was fixed throughout the calculation and no mobility of the individuals was allowed.
As such, in that model, the spatial evolution of the dengue infection was only driven by the flight of mosquitoes as the mobility of humans was not included. It is usually recognized that human mobility is not only necessary to be included in human infection spread models, but that it might be the main source of the dynamics behind spatiotemporal phenomena on geographic scales (i.e the spread of infection from city to city due to people flying long distances by plane). It is thus very important to address the problem of the mobility of humans and incorporate it into the models to be able to make more reliable predictions, and then, to be able to propose effective public policies against the dispersal of a known or emerging disease.
Including the mobility of the human population in a model is not an easy task given the complexity of human behavior. The first problem to address is the technical and ethical difficulties that arise when trying to get information about the mobility of humans. There are many databases from which this data could be inferred, such as the ones associated to cellular phone networks, credit cards, hotel reservations, flight reservation databases, etc. But as almost all of them are private, most researchers do not have access to them. Moreover, even if we did have them, mixing this diversified information together to get a human mobility model is a hard task by itself. Aside from this particular difficulties, there is an intrinsic bias on the databases if we are going to use them for diseases spread, because its reasonable to think that human behavior will change, or adapt in presence of social awareness of a disease Epstein et al. (2008); Gross and Blasius (2008); Gross et al. (2006); Risau-Gusmans et al. (2009); Zanette (2007); Zanette and Gusman (2007); Lig et al. (2007); Fefferman and Ng (2007); Funk et al. (2010); Zhao et al. (2010), and the inferences made on this databases can not take that into account. Moreover there can be a social bias because not everyone may use credit cards, go to hotels, etc.
Whether it is necessary to have a detailed information on the movements of each individual to build up a model, or if it is only needed a coarse grain statistics of the mobility as a whole is an open question wich still has to be answered Sattenspiel (2009).
Several works tackle the issue of the correct description of the human beings mobility, relaying on different methods and databases Rhee et al. (2007); Gonzalez et al. (2008); Brockmann et al. (2006); D. Brockmann (2007); Chowell et al. (2003); Cattuto et al. (2010); Candia et al. (2007); Wang and Gonzalez (2009).
As most works focusing on this topic analyze the effect of the human mobility in human-human transmitted diseases Buscarino et al. (2008); Funk et al. (2010); Li et al. (2010); Zhao et al. (2010); Fefferman and Ng (2007); Keeling and Eames (2005); Lig et al. (2007); Zanette and Gusman (2007); Risau-Gusmans et al. (2009); Gross et al. (2006), but not in vector borne ones Pongsumpun et al. (2008); Stoddard et al. (2009); Sattenspiel (2009), in the present work we show a variation of our previous dengue model which not only includes the flight of the mosquitoes but also the mobility of the humans beings. We then show the key differences in the results between both our models and conclude on the actual impact of the human behavior on dengue.
In section II we describe the characteristics of the epidemiological model we use in this work encompassing the dynamics of the virus for humans, mosquitoes and the dispersal dynamics for each. In section III we present the results of our numerical investigations which include the analysis of the size and time evolution of the epidemics, the morphological properties of the patterns of spatial distributions of the infections for different mobility patterns and for different densities of mosquitoes. Finally conclusions are drawn in section IV
II The epidemiological model
There are four ingredients in this model, the epidemiological dynamics of the infected mosquitoes, the epidemiological dynamics of the infected humans and the mobility pattern of the individuals and mosquitoes. Each of this elements will be discussed in what follows
II.1 Mosquitoes
The dengue virus does not make any effect to the vector, as such, Aedes aegypti populations are independent of the presence of the virus. In the present model mosquitoes populations are produced by the Aedes aegypti model Otero et al. (2008) with spatial resolution of one block using climatic data tuned to Buenos Aires, a temperate city where dengue circulated in the summer season 2008-2009 Seijo et al. (2009). The urbanistic unit of the city is the block, approximately a square of (100m x 100m). Because of the temperate climate the houses are not open as it is often the case in tropical areas. Mosquitoes develop in the center of the block which often presents vegetation and communicates the houses of the block. The model then assumes that mosquitoes belong to the block and not to the houses and they blood-feed with equal probability in any human resident in the block. Aedes aegypti is assumed to disperse seeking for places to lay eggs. The mosquitoes population, number of bites per day, dispersal flights and adult mortality information per block is obtained from the mosquitoes model Otero et al. (2008).
The time step of the model has been fixed at one day.
The virus enters the mosquito when it bites a viremic human with a probability depending of the day in the infectious cycle of the human bitten. The cycle continues with the reproduction of the virus within the mosquito (extrinsic period) that lasts days. After this reproduction period the mosquito becomes infectious and transmits the virus when it bites with a probability . The mosquito follows a cycle Susceptible, Exposed, Infected (SEI) and does not recover. Eventually mosquitoes die with a daily mortality of Otero et al. (2006). The adult female mosquitoes population as produced by the Aedes aegypti simulation is then split into susceptible, stages of exposed and one infective compartment according to their interaction with the viremic human population and the number of days elapsed since acquiring the virus.
The mosquito population of each block is not fixed, but instead mosquitoes move around in terms of a simple diffusion process.
II.2 Humans
The evolution of the disease in one individual human, , evolves as follows:
In the table above stands for the intrinsic incubation time, and is the viremic time of each individual. The cycle in the human being is then of the form Susceptible, Exposed, Infected, Recovered (SEIR). Each human has it’s own value of which is assigned according to the Nishiura’s experimental distribution Nishiura and Halstead (2007).
As mentioned above, our analysis of the time evolution of dengue fever is performed on a schematic city in which the basic unit is the block and in each block a human population of 100 individuals is placed. An exposed human(index case) is introduced near the center of the grid, on January .
The human population of each block is not fixed in the present work. In order to describe the patterns of mobility of the humans we have adopted the following schematic model. 50% of the population of each block is randomly selected to be mobile, while the other 50% is considered to remain in its original block during the whole analysis. Each mobile individual is assumed to stay of the day in its original block, while the other of the day she/he will stay in a randomly assigned block according to the corresponding distribution. Each of the mobile individuals is assigned in each case a fixed destination to which it returns everyday. At the end of the day individuals return to their original block. This random assignment is performed according to certain rules that will characterize the mobility pattern. Following recent works on human mobility, referred in the introduction, we require that the movement of each individual a) should be highly predictable Song et al. (2010) and b) the distribution of the lengths of the displacements of the human should follow a truncated Levy distribution Gonzalez et al. (2008) which reads:
| (1) |
Being the probability of a human traveling a distance, where , and are parameters that characterize the distribution. In this work we have used the parameters described in Table 1.
| (m) | |||
|---|---|---|---|
| 1 | 100 | 1.65 | 1500 |
| 2 | 100 | 2. | 1500 |
| 3 | 100 | 3. | 1500 |
| 4 | 100 | 4. | 1500 |
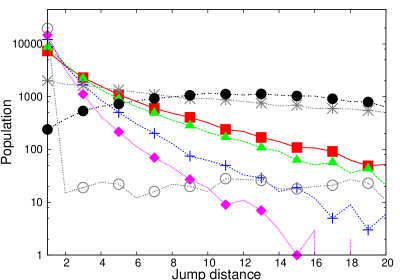
Such a pattern of mobility of the humans is accomplished by building a network with 50 links starting in each block. The length of the link is distributed according to the proposed length distribution and the final block is chosen at random from those which can be reached by the link. Each link is assigned to a mobile human at the start of the simulation. The distribution of jumps sizes for each type of underlying network is shown on Fig 1.
In order to have reference mobility networks we have also analyzed the case in which the endpoints of the links are completely random. We have also investigated the case in which only one individual per block performs a random jump while the rest of the mobile individuals in the block visit only their neighboring blocks ().
Once the set of parameters is fixed, different underlying networks are generated and a set of evolutions (typically a couple of thousand events) is performed for such arrangements.
II.3 The networks
The networks built according to the above mentioned prescription can be analyzed in order to unveil their ”small world properties”. We have found it interesting to study the geodesic path i.e. the average minimum path between all the cells.
| (2) |
with the minimum path between cells and , and the total number of nodes. The minimum path is defined as the minimum number of links that are to be traversed in order to travel from the original block to the destiny block.Therefore, we see that it is a simple average over all the possible pairs of blocks in the system of the minimum distance between each pair.
Another interesting magnitude to explore the characteristics of a network is the so called Clusterization. One of the usual definitions of this magnitude is:
Given a node with nearest neighbors we define as
| (3) |
| (4) |
In Table 2 we show the results of such a calculation.
| Random | 1.779 | 0.220 |
| Levy() | 2.006 | 0.286 |
| Levy() | 2.112 | 0.303 |
| Levy() | 2.532 | 0.349 |
| Levy() | 3.092 | 0.380 |
| Only move | 3.884 | 0.014 |
We can see from table I that the mean shortest path attains a minimum for the completely random pattern of links and grows as this pattern is replaced by the ones generated by the levy flights. We see that the broader the Levy-Flight is the larger is the average minimum path, as expected.
III Numerical calculations
We have implemented the above described method (The algorithm without human mobility has been fully described in Otero et al. (2010)) and have performed extensive calculations for different initial conditions.
The conditions are : mosquitoes breeding sites density, different realizations of the underlying mobility networks and different seasonal conditions.
The number of breeding sites per block explored in this calculations are 50, 100,200,300 and 400. Larger number of breeding sites are considered to be too unrealistic for the system we have in mind i.e. the city of Buenos Aires. Moreover larger number of breeding sites do not add new information to our calculations.
Another relevant condition that we have explored is the underlying mobility network. For each value of the breeding sites density, evolutions with different underlying networks were performed.
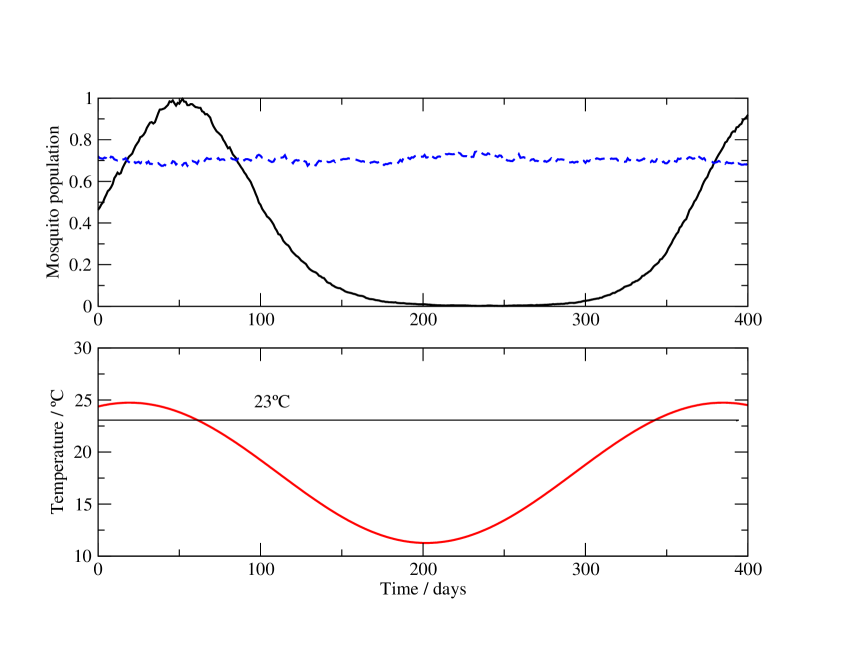
Finally we have considered two different seasonal conditions, on Fig. 2 we show the population(top) and temperature(bottom) profiles. In the season-less situation, the temperature remains fixed all along the evolution at . In this case the mosquito population remains basically constant all along the evolution. In such a case the size of the epidemics is determined by the dynamics of the infection itself subject to the above mentioned boundary conditions. If we adopt the average temperature time-distribution of BA (see figure for details) the population of mosquitoes is a strongly time dependent one, the size of the epidemics might then be severely constrained.
In what follows we will focus on certain properties of the epidemic system that are relevant for the understanding of the characteristics of the time evolution. In first place we study the morphology of the evolving spatial structure of the epidemics. Then we study the final size and time span of the epidemics. Then we include the results of the analysis of a system in which the temperature is kept fixed at degrees Celsius. Finally we study a new magnitude that we name the of the epidemics.
III.1 Morphology of the spatial structure of the epidemics
It is expected that human mobility increases the size and speed of the epidemics.
This happens because each jump (shortcut) when executed by a virus carrying individual may induce the contagion of mosquitoes at the destination block and then generates a new dispersal center for the illness.
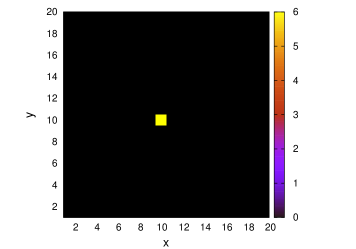
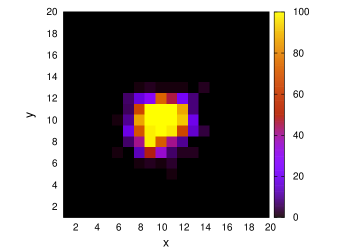
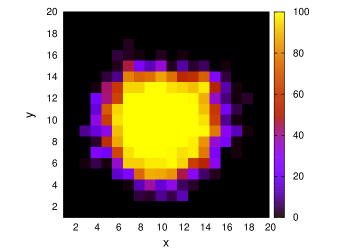
In Fig 3 we show the density of recovered individuals at three relevant times for the case in which the dispersal of dengue is driven by the diffusion of mosquitoes only. It is seen that the population of recovered individuals displays a symmetrical pattern as expected from a simple diffusion process.
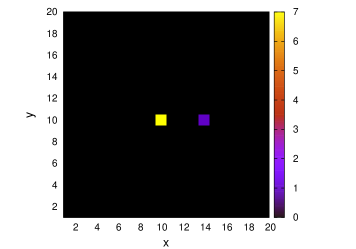
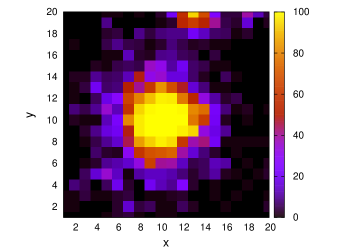
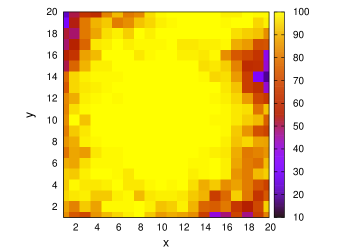
On the contrary as seen in Fig 4 the pattern for the case in which the human jumps follow a Levy-Flight distribution is quite heterogeneous and it can be clearly seen that there is more than one dispersal center.
This observations can be made more quantitative if we calculate the radial correlation function defined as the probability of finding at least one infected (recovered) individual (calculated at the time at which all individuals have returned home) at a block such that it can be reached by a jump of length from the place at which the initial infected individual one was located (which in this case is a block close to the center of the city).
In what follows we show the result of calculating the radial correlation function for three typical cases namely for the mosquito driven evolution, for the case Levy-Flight with and the case in which only one of the mobile individuals performs random jumps.
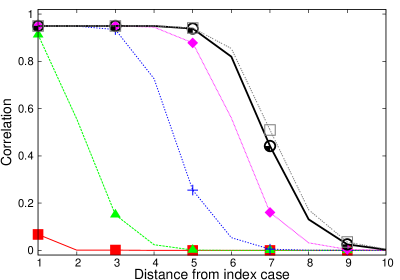
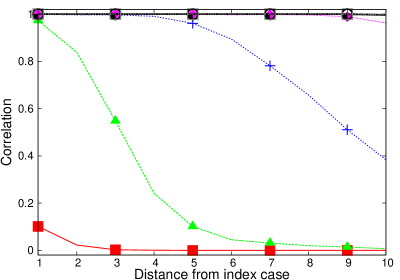
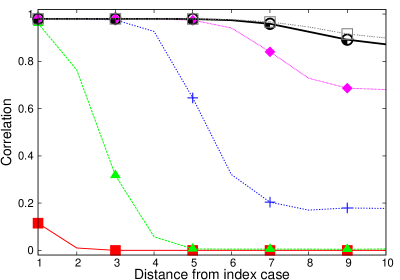
From Figs. 5,6,7 is clearly seen that in the presence of human mobility nearly all of the city can be reached by the epidemic in short times. On the one hand the case of mosquitoes only as driving force the correlation function displays patterns expected for a traveling wavefront. In the other cases the wavefront breaks early in the evolution and the correlation function is different from zero almost everywhere after a few days.
As we have seen in Fig.3) and 4) the structure of the spatial density of, say, humans in state R is highly symmetric and compact for the case without human mobility. As human mobility (of the kind considered in this work) is incorporated both the symmetry and the compactness are lost. In order to explore this behavior in a more quantitative way we define cluster of recovered individuals in the following way. Given a block we will call it an occupied block if at least one member of its original population is in the recovered state. A cluster (of size larger that one) is a set of occupied blocks in which all constituents have at least a nearest or second nearest neighbor which belongs to the cluster. Then the block will belong to the cluster if the following relation is satisfied:
| (5) |
We define the mass of a cluster as the number of recovered individuals in the cluster.
The results are displayed in the Fig 8.
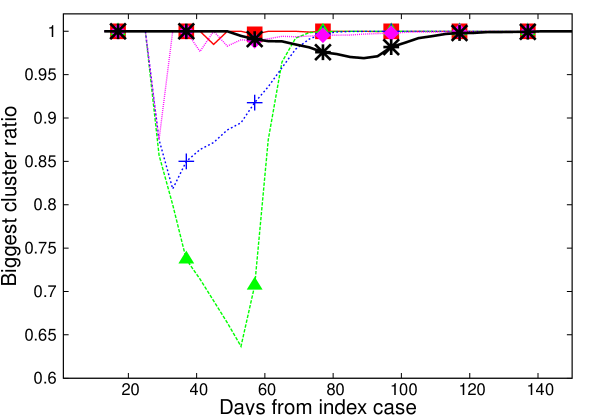
It can be seen that for the case of simple diffusion all of the mass is concentrated in the biggest cluster . On the other hand for the random case there is a time (around days into the epidemic) at which only about of the mass is in the biggest cluster . This is due to the emergence of secondary foci generated by infective humans who perform long jumps.
III.2 Sizes and time span of the epidemics
One of the main observables in this kind of problems is the final size of the epidemics. In what follows we show Figure 9 a comparison of the final size of the epidemics in terms of the boxplots corresponding to different values of the breeding sites density for different patterns of human mobility. As described above we have two limiting situations the case in which the moving humans perform jumps with completely random destinations and the case in which the dispersal of the epidemics is only due to the diffusion of mosquitoes. In between we have the patterns related to the length of the jump given by a truncated Levy-Flight characterized by the different set of parameters shown in table 1 i.e. and (keep in mind the smaller the closer to the random case). The corresponding results are displayed in panels .
Finally in Fig. 10 we show (left panel) the case in which only one of the mobile humans in each block performs a jump to a random destination while the others move to nearest neighbors. For the sake of completeness we show on the right panel the boxplot corresponding to the mosquito only driven evolution.
It is immediate to see that the effect of human mobility for all the cases is to increase the final size of the epidemics with respect to the case in which the mosquitoes diffusion is the only driving force. Moreover in the case of completely random mobility and for the Levy-Flight with we get that for the highest BS density proposed in this work, the epidemics spreads over the whole population.


Figure 11 shows the duration distribution of the epidemics as a function of the different patterns of human mobility and for two constant breeding site densities of 200 BS/ha (Top) and 400 BS/ha (Bottom) respectively. For 200 (Top) all boxplots present a similar spread of data but a slight tendency of increase of the median from left to right (from the case without mobility to the complete random pattern). Instead, for 400 the tendency is to decrease from left to right. (This behavior will be properly discussed in terms of the Power of the epidemics, see below)


III.3 Behavior of the model at constant temperature
Figure 12 shows the duration distribution of the epidemics as a function of the different patterns of human mobility for a constant breeding site density of 400 BS/ha and a constant temperature of 23 degrees Celsius. We see that the maximum duration of the epidemic takes place for the case of no human mobility and it shortens as the patterns of mobility of the individuals tend to the completely random one. It is also interesting to note that in this case the epidemics involves the whole population.

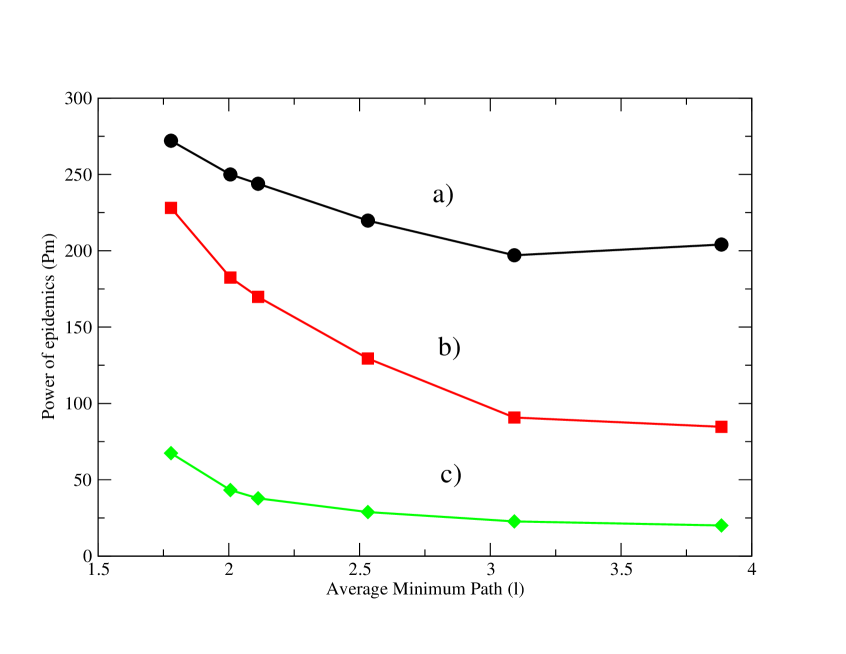
III.4 Power of the epidemic
We define the mean power of the epidemic as the ratio between the median of the final size of the epidemic and the median of the duration of the epidemics.
| (6) |
Figure 13 shows the mean power for three conditions: 400 BS and constant temperature of 23 degrees, 400 BS and seasonal variation of temperature and 200 BS and seasonal variation of temperature. The grows with broader jump length distributions and with higher BS densities. For the case of 400 BS is higher for constant temperature than for seasonal variation of temperature. If we compare 400 BS and 200 BS (for seasonal variation of temperature) we see the same increasing tendency of with human mobility but this value is higher for 400 BS than for 200 BS. (For the case of 400 BS and constant T the increase of the power of the epidemic is a consequence of the reduction of its duration as the pattern of human mobility approaches the fully random case. At constant T all of the population gets infected. On the other hand, when the Temperature is not fixed it severely constrains the mosquitoes population and then the increase in is mainly due to the increase of the size of the infected population as the time span of the epidemics is only mildly dependent on the driving force of the dispersal.
IV Conclusions
In this work we have explored the effect of human mobility on the dynamics of a vector borne infection. We have added this characteristic of human behavior on an already tested model of dengue dispersal when the dynamics is driven by mosquitoes alone. We have analyzed the case of a schematic city of 20x20 blocks with 100 individuals per block.
We have considered two temperature profiles, on the one hand a simple constant temperature one and a realistic time distribution corresponding to the city of Buenos Aires, Argentina.
Another variable in our analysis has been the number of breeding cites in the city, we have considered 50,100, 200, 300 and 400 breeding cites per block.
Human mobility has been described by superimposing diverse kinds of networks in which links represent the daily movement of humans. The distribution of lengths of this links are derived from recent studies on human motion and in particular, taking into account the finding that human behavior is highly predictable. We have also considered reference patterns i.e purely random motion and random motion of a single human per block.
We have explored different observables like size and duration of the outbreaks, and complementary the morphological characteristics of the pattern of recovered individuals.
We have found that human mobility strongly enhaces the infection dispersal. Even for the case in which just one individual per block can perform a long jump. This effect can be traced to the fact that when the disease dispersal is driven by mosquitoes alone we have a single focus that expands due to diffusive kind of diynamics. When human mobility is taken into account, multiple loci appear as the time evolution is followed
Human mobility increases the size and the speed of propagation of the outbreaks. This feature can be captured by the magnitude ”Power of the epidemics” defined as the quotient of the size of the epidemics divided by the its time span. This magnitude displays a monotonous increase as the Mean Length Path of the network describing the daily human mobility pattern decreases.
This findings indicate that human mobility might turn out to be the main driving force in the epidemics dynamics.
Both in the case of fixed temperature and seasonal variational one, human motion gives rise to faster and more widespread epidemics.
Finally this findings indicate that, when considering meassures to fight epidemics dispersal human motion should be one of the top concerns. We are presently exploring this issue.
Acknowledgments
C.O.D, M.O and H.G.S are members of the Carrera del Investigador CONICET. D.H.B is a fellow of the CONICET. We thank the support by the University of Buenos Aires (grant X210).
References
- Gubler (1998) D. J. Gubler, Clinical Microbiology Review 11, 480 (1998).
- Newton and Reiter (1992) E. A. C. Newton and P. Reiter, Am. J. Trop. Med. Hyg. 47, 709 (1992).
- Focks et al. (1993a) D. A. Focks, D. C. Haile, E. Daniels, and G. A. Moun, Journal of Medical Entomology 30, 1003 (1993a).
- Focks et al. (1993b) D. A. Focks, D. C. Haile, E. Daniels, and G. A. Mount, Journal of Medical Entomology 30, 1019 (1993b).
- Focks et al. (1995) D. A. Focks, D. C. Haile, E. Daniels, and D. Keesling, Am. J. Trop. Med. Hyg. 53, 489 (1995).
- Otero and Solari (2010) M. Otero and H. G. Solari, Mathematical Biosciences 223, 32 (2010).
- Otero et al. (2006) M. Otero, H. G. Solari, and N. Schweigmann, Bull. Math. Biol. 68, 1945 (2006).
- Otero et al. (2008) M. Otero, N. Schweigmann, and H. G. Solari, Bulletin of Mathematical Biology 70, 1297 (2008).
- Esteva and Vargas (1998) L. Esteva and C. Vargas, Mathematical Biosciences 150, 131 (1998).
- Esteva and Vargas (1999) L. Esteva and C. Vargas, Journal of Mathematical Biology 38, 220 (1999).
- Esteva and Vargas (2000) L. Esteva and C. Vargas, Mathematical Biosciences 167, 51 (2000).
- Bartley et al. (2002) L. M. Bartley, C. A. Donnelly, and G. P. Garnett, Transactions of the royal society of tropical medicine and hygiene 96, 387 (2002).
- Pongsumpun and Tang (2003) P. Pongsumpun and I. M. Tang, Mathematical and Computer Modelling 37, 949 (2003).
- Chowella et al. (2007) G. Chowella, P. Diaz-Dueñas, J. Miller, A. Alcazar-Velazco, J. Hyman, P. Fenimore, and C. Castillo-Chavez, Mathematical Biosciences 208, 571 (2007).
- Favier et al. (2005) C. Favier, D. Schmit, C. D. M. Müller-Graf, B. Cazelles, N. Degallier, B. Mondet, and M. A. Dubois, Proceedings of the Royal Society (London): Biological Sciences 272, 1171 (2005).
- Otero et al. (2010) M. Otero, D. Barmak, C. Dorso, H. Solari, and M. Natiello (2010), arXiv:1012.1281v1 [q-bio.PE].
- Epstein et al. (2008) J. M. Epstein, J. Parker, D. Cummings, and R. A. Hammond, PLoS ONE 3, e3955 (2008), URL http://dx.doi.org/10.1371%2Fjournal.pone.0003955.
- Gross and Blasius (2008) T. Gross and B. Blasius, J. R. Soc. Interface 5, 259 (2008), URL http://dx.doi.org/10.1098/rsif.2007.1229.
- Gross et al. (2006) T. Gross, C. J. D’Lima, and B. Blasius, Physical Review Letters 96, 208701+ (2006), URL http://dx.doi.org/10.1103/PhysRevLett.96.208701.
- Risau-Gusmans et al. (2009) S. Risau-Gusmans, , and D. H. Zanette, Journal of Theoretical Biology 257, 52 (2009), ISSN 00225193, URL http://dx.doi.org/10.1016/j.jtbi.2008.10.027.
- Zanette (2007) D. H. Zanette (2007), arXiv e-prints, eprint 0707.1249, URL http://arxiv.org/abs/0707.1249.
- Zanette and Gusman (2007) D. H. Zanette and S. R. Gusman, Journal of Biological Physics 34, 135 (2007), eprint 0711.0874, URL http://arxiv.org/abs/0711.0874.
- Lig et al. (2007) W. Lig, Y. Jia-Ren, Z. Jian-Guo, and L. Zi-Ran, Chinese Physics 16, 2498+ (2007), ISSN 1009-1963, URL http://dx.doi.org/10.1088/1009-1963/16/9/002.
- Fefferman and Ng (2007) N. H. Fefferman and K. L. Ng, Physical Review E 76, 031919+ (2007), URL http://dx.doi.org/10.1103/PhysRevE.76.031919.
- Funk et al. (2010) S. Funk, M. Salathé, and V. A. A. Jansen, Journal of The Royal Society Interface (2010), URL http://dx.doi.org/10.1098/rsif.2010.0142.
- Zhao et al. (2010) Z. Zhao, J. P. Calderón, C. Xu, G. Zao, D. Fenn, D. Sornette, R. Crane, P. M. Hui, and N. F. Johnson, Physical Review E 81, 056107+ (2010), URL http://dx.doi.org/10.1103/PhysRevE.81.056107.
- Sattenspiel (2009) L. Sattenspiel, The Geographic Spread of Infectious Diseases:Models and Applications (Princeton University, 2009).
- Rhee et al. (2007) I. Rhee, M. Shin, S. Hong, K. Lee, and S. Chong, Technical Report, Computer Science Department, North Carolina State University (2007).
- Gonzalez et al. (2008) M. C. Gonzalez, C. A. Hidalgo, and A.-L. Barabasi, Nature 453, 779 (2008).
- Brockmann et al. (2006) D. Brockmann, L. Hufnagel, and T. Geisel, Nature 439 (2006).
- D. Brockmann (2007) L. H. D. Brockmann, The scaling law of human travel - A message from George (World Scientific, 2007).
- Chowell et al. (2003) G. Chowell, J. M. Hyman, S. Eubank, and C. Castillo-Chavez, Physical Review E 68, 661021 (2003).
- Cattuto et al. (2010) C. Cattuto, W. Van den Broeck, A. Barrat, V. Colizza, J.-F. Pinton, and A. Vespignani, PLoS ONE 5, e11596 (2010), URL http://dx.doi.org/10.1371%2Fjournal.pone.0011596.
- Candia et al. (2007) J. Candia, M. C. Gonzalez, P. Wang, and T. Schoenharl (2007), detection of anomalous local cell pattern, URL http://arxiv.org/pdf/0710.2939.
- Wang and Gonzalez (2009) P. Wang and M. C. Gonzalez, Royal Society of London Philosophical Transactions Series A 367, 3321 (2009).
- Buscarino et al. (2008) A. Buscarino, L. Fortuna, M. Frasca, and V. Latora, European Physics Letters 82, 38002 (2008).
- Li et al. (2010) X. Li, L. Cao, and G. F. Cao, The European Physical Journal B - Condensed Matter and Complex Systems (2010), ISSN 1434-6028, URL http://dx.doi.org/10.1140/epjb/e2010-00090-9.
- Keeling and Eames (2005) M. Keeling and K. T. Eames, Journal of the Royal Society Interface 22 2, 295 (2005), ISSN 1742-5689, URL http://dx.doi.org/10.1098/rsif.2005.0051.
- Pongsumpun et al. (2008) P. Pongsumpun, D. G. Lopez, C. Favier, L. Torres, J. Llosa, and M. Dubois, Tropical Medicine and International Health 13, 1180 (2008).
- Stoddard et al. (2009) S. T. Stoddard, A. C. Morrison, G. M. Vazquez-Prokopec, V. P. Soldan, T. J. Kochel, U. Kitron, J. P. Elder, and T. W. Scott, PLoS Negl Trop Dis 3, e481 (2009), URL http://dx.doi.org/10.1371/journal.pntd.0000481.
- Seijo et al. (2009) A. Seijo, Y. Romer, M. Espinosa, J. Monroig, S. Giamperetti, D. Ameri, and L. Antonelli, Medicina 69, 593 (2009), iSSN 0025-7680.
- Nishiura and Halstead (2007) H. Nishiura and S. B. Halstead, Journal of Infectious Diseases 195, 1007 (2007).
- Song et al. (2010) C. Song, Z. Qu, N. Blumm, and A.-L. Barabási, Science 327, 1018 (2010), eprint http://www.sciencemag.org/cgi/reprint/327/5968/1018.pdf, URL http://www.barabasilab.com/pubs/CCNR-ALB_Publications/201002-%19_Science-Predictability/201002-19_Science-Predictability.pdf.