HST/COS SPECTRA OF DF TAU AND V4046 SGR: FIRST DETECTION OF MOLECULAR HYDROGEN ABSORPTION AGAINST THE Ly EMISSION LINE 11affiliation: Based on observations made with the NASA/ESA Hubble Space Telescope, obtained from the data archive at the Space Telescope Science Institute. STScI is operated by the Association of Universities for Research in Astronomy, Inc. under NASA contract NAS 5-26555.
Abstract
We report the first detection of molecular hydrogen (H2) absorption in the Lyman- emission line profiles of two classical T Tauri stars (CTTSs), DF Tau and V4046 Sgr, observed by HST/COS. This absorption is the energy source for many of the Lyman-band H2 fluorescent lines commonly seen in the far-ultraviolet spectra of CTTSs. We find that the absorbed energy in the H2 pumping transitions from a portion of the Lyman- line significantly differ from the amount of energy in the resulting fluorescent emission. By assuming additional absorption in the H I Lyman- profile along our light of sight, we can correct the H2 absorption/emission ratios so that they are close to unity. The required H I absorption for DF Tau is at a velocity close to the radial velocity of the star, consistent with H I absorption in the edge-on disk and interstellar medium. For V4046 Sgr, a nearly face-on system, the required absorption is between km s-1 and km s-1, most likely resulting from H I gas in the accretion columns falling onto the star.
1 INTRODUCTION
Molecular hydrogen (H2) emission lines are commonly observed in the far-ultraviolet (FUV) spectra of classical T Tauri stars (CTTSs) (Herczeg et al., 2002, 2004, 2006; Ardila et al., 2002). Brown et al. (1981) first detected these lines from T Tau using IUE. As suggested by detections of identical lines in the sunspot spectrum (Jordan et al., 1977), these fluorescent H2 lines are thought to be photoexcited from the ground electronic state to the B (or C) electronic state primarily by coincidence with hydrogen Lyman- but also by other strong atomic emission lines (e.g., C II, C IV, and O VI ) in the UV.
The H2 fluorescence may arise from various locations in protostellar systems. In their analysis of HST STIS E140M spectra of 6 pre-main sequence (PMS) stars, Herczeg et al. (2006) found that blueshifted H2 lines of RU Lupi, T Tau, and DG Tau are likely formed in outflows, while the H2 lines of TW Hya, DF Tau, and V836 Tau show no radial velocity shifts from the photospheric lines and are likely formed in warm (2500 K) surfaces of their circumstellar disks. Stars such as T Tau also show spatially extended H2 fluorescent emission in associated nebulosity, which is likely pumped by local shocks and outflows rather than stellar Lyman- emission (Walter et al., 2003). For the diskless counterparts of CTTSs, the naked T Tauri stars (NTTSs), H2 features are not seen in their FUV spectra (Ingleby, L. et al, 2009, Yang et al. 2011, in preparation), indicating that H2 fluorescent emission requires the presence of H2 gas close to the central star. Studying the H2 fluorescent emission therefore provides valuable information on the physical properties of protoplanetary disks, which are 90% composed of H2 gas.
While the H2 fluorescent lines have been studied in a number of CTTSs, the pumping transitions had not been observed in absorption against the Lyman- emission line. In this Letter, we present new FUV spectroscopy of two CTTSs, DF Tau and V4046 Sgr, for which we detect such absorption for the first time as a result of the very low noise and high throughput of the Cosmic Origins Spectrograph (COS) on HST.
2 OBSERVATIONS AND DATA REDUCTION
We observed DF Tau (RA = 04:27:02.795, DEC = 57:12:35.38) and V4046 Sgr (RA = 18:14:10.466, DEC = -32:47:34.50) with the COS (Dixon et al., 2010; Osterman et al., 2011) on January 11 and April 27, 2010, respectively. COS is a high-throughput, moderate-resolution UV spectrograph installed on the HST in May 2009. During our HST GTO program 11533, we used both the G130M and G160M gratings of the COS FUV channel to cover the 1136 Å–1796 Å region. Since there is a small gap (15 Å in wavelength coverage) between the two segments of the COS detector, we observed each star at 4 central wavelength settings for both gratings to provide continuous spectral coverage and minimize any fixed-pattern noise. The total exposure time for each star was about 10,000 sec during 4 HST orbits. The spectral resolution was approximately –, with extended wings in the line-spread function. The extended wings are induced by polishing errors on the HST primary and secondary mirrors (see Ghavamian et al., 2010).
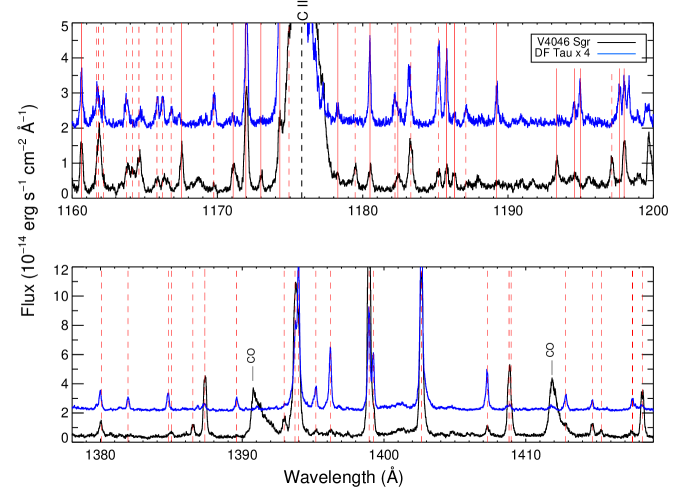
We reduced the DF Tau and V4046 Sgr spectra using the COS calibration pipeline, CALCOS***We refer the reader to the Cycle 18 COS Instrument Handbook for more details: http://www.stsci.edu/hst/cos/documents/handbooks/current/cos_cover.html.(v2.12, March 19, 2010), and combined them with a custom IDL coaddition routine described by Danforth et al. (2010). In Figure 1, we show two portions of the coadded FUV spectra for both stars as examples. To match the atomic and molecular emission lines with laboratory wavelengths, we corrected for the radial velocity of DF Tau (+15 km s-1), but found that an additional correction of +8 km s-1 is needed because of inaccuracies in the CALCOS wavelength solution. The radial velocity of V4046 Sgr is close to 0, and the wavelength solution is accurate.
3 DF TAU AND V4046 SGR
DF Tau is a binary system consisting of two early M stars separated by 0.1″ (Schaefer et al., 2006). Its disk is inclined by 80–85∘ (Johns-Krull & Valenti, 2001; Ardila et al., 2002), i.e., the disk is seen nearly edge-on. The distance to DF Tau is generally adopted as pc, the distance to the Taurus Molecular Cloud. Herczeg et al. (2006) analyzed in detail the H2 fluorescent lines of DF Tau observed with the STIS E140M grating. Herczeg & Hillenbrand (2008) estimated a visual extinction () of 0.6 mag and accretion rate in the range of – yr-1 for DF Tau.
V4046 Sgr is a spectroscopic binary with a separation of 9 and an orbital period of 2.42 days (Stempels & Gahm, 2004). The pair consists of a K7V and a K5V star (Quast et al., 2000). At a distance of pc (Torres et al. 2008), it is an isolated system and the extinction is practically mag (Stempels & Gahm, 2004). The circumbinary disk is inclined at 35∘ (Quast et al., 2000; Kastner et al., 2008), somewhat face-on. V4046 Sgr may be a member of the Pic Moving group and could be as old as 12 Myr (Ortega et al. 2002). Jensen & Mathieu (1997) found that it has little excess emission in the near-infrared (near-IR) wavelengths but a large excess emission at longer wavelengths, suggesting that optically thick dust in the regions of the disk close to the star has been cleared out. We know of no previous detailed study of H2 emission from V4046 Sgr.
Besides the H2 line emission studied in this work, the FUV continuum, which is also detected in DF Tau and V4046 Sgr, will be analyzed in detail by K. France et al. (2011, submitted).
4 ANALYSIS & RESULTS
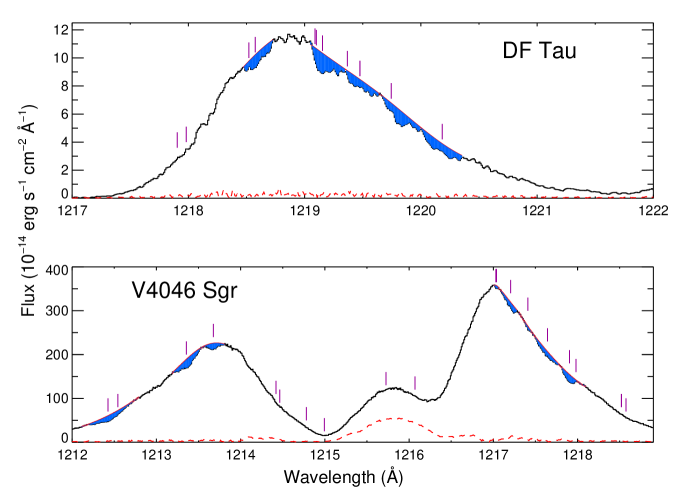
The FUV spectra of DF Tau and V4046 Sgr are dominated by H2 fluorescent lines (see Figure 1). Below 1200 Å, there are also many Werner-band H2 lines, which will be described in a separate paper (Yang et al. in preparation). In Figure 2, we show the Lyman- profiles of DF Tau and V4046 Sgr. The apparent absorption features seen against the Lyman- emission line have depths much greater than the noise at those wavelengths and coincide in wavelength with the Lyman-band H2 pumping transitions (see Table 3 of Herczeg et al., 2006). We first mask out the absorption features and fit 5th or 6th order polynomial curves to the Lyman- profiles. To measure the amounts of absorbed energy, we integrate the area between the fitted curves and the observed spectra. The uncertainties in such measurements are mainly caused by the somewhat subjective determinations of the Lyman- profiles without absorption. Some features result from the blended absorption of two or three pumping transitions, and the absorbed energy for these features represents the total absorption of the transitions. For DF Tau, 5 features are measured that correspond to 9 pumping transitions: 1218.52 Å + 1218.57 Å, 1219.09 Å + 1219.10 Å + 1219.15, 1219.37 Å + 1219.48 Å, 1219.74 Å, and 1220.18 Å. For V4046 Sgr, 8 features are measured that correspond to 11 pumping transitions: 1212.43 Å + 1212.54 Å, 1213.36 Å, 1213.68 Å, 1217.03 Å + 1217.04 Å, 1217.20 Å, 1217.41 Å, 1217.64 Å, and 1217.90 Å + 1217.98 Å.
We detect between 2 and 19 fluorescent H2 lines in the progressions produced by each pumping transition observed in absorption against the Lyman- lines. The H2 fluorescent lines are identified based on the line list of Abgrall et al. (1993). To measure the line fluxes, we used a custom IDL fitting procedure (France et al., 2010) that convolves a Gaussian profile with the COS line spread function (LSF) to fit the observed H2 line profiles. The convolution of a Gaussian profile with the COS LSF only changes the shape of the profile but not the total line flux. The uncertainties in the line fluxes are generally less than 5 % for unblended lines, indicative of the high signal-to-noise of the data, typically for the H2 lines. We next convert the line fluxes in each progression to the total energy emitted from the pumped upper level. Each H2 line in a given progression yields an estimate of the total energy in the upper level from the line theoretical branching ratios. We average the estimated total energy emitted from each upper level using only the strong unblended lines, and their standard deviations are 15% of the mean values. The emission from each upper level is corrected for its dissociation probability as calculated by Abgrall et al. (2000). The dissociation probability is typically zero or only a few percent. The absorption and emission fluxes for DF Tau are also corrected for extinction using 0.6 mag and the Cardelli et al. (1989) extinction law.
For each absorption feature observed against the Lyman- emission line, we have estimated the absorbed energy () and the emitted energy () from the corresponding H2 upper level. If there are no additional sources of absorption or emission, then the global average of should be unity. We begin the analysis by assuming that along our line of sight should be close to unity, but the measurements show otherwise. We do find that the three features in the Lyman- blue wing for V4046 Sgr have within a factor of two of unity (1.38, 0.99, 0.56), but the ratios at longer wavelengths are smaller than one by factors of 4–60 (see the fourth column of Table 1). We therefore propose that additional Lyman- absorption in the line of sight between the location where H2 is pumped and the observer has reduced the observed absorbed energy in the pumping line and thus the ratios. To model the additional hydrogen absorption, we calculate Lyman- absorption profiles using the Voigt function for a range of hydrogen column densities (NHI) and radial velocities (). Then for each combination of NHI and , we calculate the optical depths, , at the wavelengths of the pumping lines. We correct the observed ratios by multiplying by . For V4046 Sgr, the absorption features at 1217.03 Å and 1217.20 Å are not used. The 1217.03 Å feature is close to the line center of Lyman-, and the measurement is greatly affected by the absorption in the line center. The 1217.20 Å progression does not have enough strong unblended emission lines to provide an accurate estimate of the emission energy.
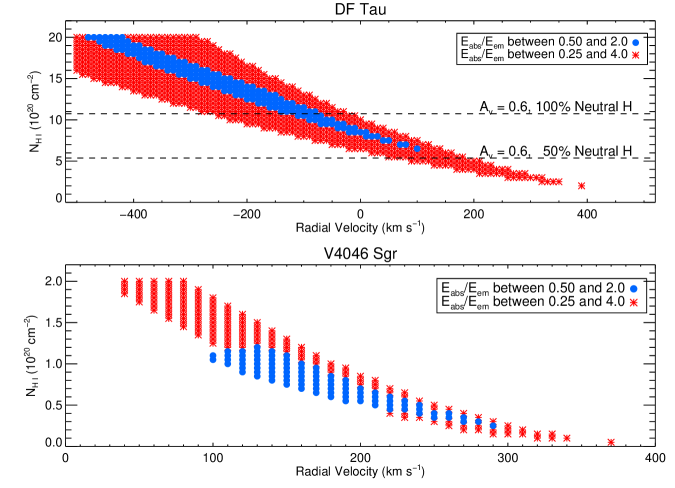
In Figure 3, we show for DF Tau and V4046 Sgr the combinations of NHI and that can correct the ratios to be close to unity. For DF Tau, if we assume that the extinction is all due to interstellar dust, we can convert = 0.6 mag to a total hydrogen column density of log() according to the relation in Predehl & Schmitt (1995). Note that this value assumes a standard gas-to-dust ratio for the interstellar medium. We mark in the top panel of Figure 3 the corresponding NHI values assuming 100% and 50% neutral hydrogen. Herczeg et al. (2006) estimated for DF Tau the absorption against the red wing of the Lyman- emission line and measured a log(NHI) of 20.75. This value is close to the hydrogen column density converted from with 50% neutral content and represents the neutral hydrogen in both the interstellar medium along the line of sight and possibly the edge-on disk of the system. As shown in Figure 3, within reasonable ranges of NHI, the additional absorption required to bring all of the ratios close to unity for DF Tau requires radial velocities close to zero. Given that the uncertainty in could be as large as 0.4 mag, and the ionization fraction and the gas-to-dust ratio in the disk are unknown, we think that the absorption is likely caused by a combination of interstellar medium and neutral hydrogen in the edge-on disk, though absorption by the H I columns in stellar winds or accretion columns can not be completely ruled out.
For V4046 Sgr, which suffers negligible continuum extinction, the absorption required has a radial velocity between 100 and 290 km s-1, as shown in the bottom panel of Figure 3. If is close to zero (Stempels & Gahm, 2004), then the radial velocity is close to 290 km s-1. For this case, we list in Table 1 the calculated optical depth for the additional absorption as well as the measured and corrected for the absorption features detected in V4046 Sgr. This is consistent with a scenario in which H I in the accretion columns is absorbing the red wings of the Lyman- emission line in this system, which is oriented somewhat face-on.
5 DISCUSSION
Thanks to the excellent sensitivity and low background of COS, we were able to detect for the first time H2 absorption against the Lyman- emission line profiles in two CTTSs. Because of the large aperture of COS (2.5″), the center of the Lyman- line is filled with geocoronal Lyman- emission and not usable (see Figure 1). The STIS E140M spectrum of DF Tau reported by Herczeg et al. (2006) shows that the line center and blue wing of Lyman- are completely absorbed. Interstellar absorption must be responsible for the disappearance of the line center, because we see many H2 lines pumped by transitions coincident with the center of Lyman-. On the other hand, we detect only a few H2 lines pumped by the transitions blueward of line center, suggesting that the blue-wing emission of Lyman- has been absorbed by the stellar wind before the blue-wing radiation reaches the molecular gas in the disk. Since the disk of DF Tau is viewed nearly edge-on, the stellar wind must be present near the stellar equator to absorb the blue wing of the Lyman- emission line.
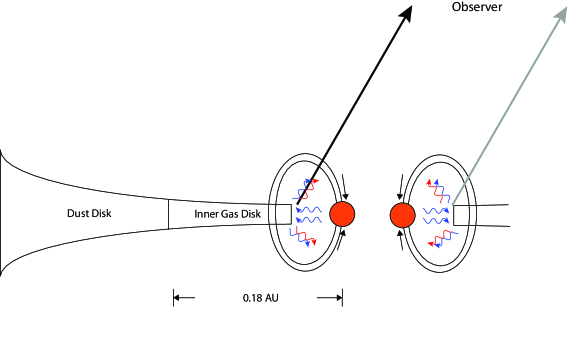
Understanding the geometry of the V4046 Sgr system requires more detailed consideration. The stellar wind must be weak for this somewhat face-on system since the blue wing of Lyman- is not totally absorbed. Our results show that there is additional absorption in the red wing of Lyman- that could be explained by accretion with velocities that are at least 100 km s-1 and are likely as large as 290 km s-1. We envision a model in which a portion of the Lyman- emission, likely formed near the accretion shocks, is reflected to the observer by neutral hydrogen in the inner disk. A schematic cartoon of this model is shown in Figure 4. The H2 pumping and fluorescence occurs where these Lyman- photons are present in the inner disk, as described by the “thick disk” model in Herczeg et al. (2004). The reflected Lyman- emission line, including the H2 absorption at the pumping wavelengths, is then absorbed by infalling neutral hydrogen in large accretion funnels in our line of sight.
Accretion of gas from circumstellar disks onto CTTSs is generally thought to be controlled by stellar magnetic fields (Bouvier et al., 2007). Strong magnetic fields of a few kilogauss (Johns-Krull, 2007, Yang et al. 2010, submitted) truncate the circumstellar gas disk at a few stellar radii and direct the accretion funnels onto the star near the magnetic poles. From models of the spectral energy distribution (SED) of V4046 Sgr, Jensen & Mathieu (1997) found that dust in the inner regions is cleared out to about 0.18 AU, which is 38.6 . At this distance, the stellar magnetic fields are not strong enough to interact efficiently with the disk, and, more importantly, the temperature of molecular gas at the surface of the dusty disk may not be high enough for the hydrogen molecules to be electronically excited by the Lyman- photons. For this transitional disk system, we think that both the fluorescent emission and accretion columns likely originate from the inner molecular gas disk (Muzerolle et al., 2003; Kastner et al., 2008) that is closer to the central star than the dust disk. The absence of any significant differences between the radial velocities of the star, pumping lines and fluorescent lines is consistent with the fluorescent H2 gas lying in an inner gas disk seen nearly face-on. In this picture as shown in Figure 4, we expect to see more reflected light from the inner edge of the “thick disk” (cf. Figure in Herczeg et al. 2004) facing toward our line of sight than from the opposite side where the disk absorbs light along the line of sight to the observer. Therefore, the reflected Lyman- emission line summed over all viewing angles toward both stars will show absorption mostly by downflowing neutral hydrogen in the accretion columns (seen along the long black line in Figure 4) rather than upflowing neutral hydrogen (seen along the long gray line in Figure 4).
Günther & Schmitt (2007) modeled the accretion shocks on V4046 Sgr, and their best-fit model of the X-ray observations yields an accretion rate of yr-1 and a maximum infall velocity of 535 km s-1 where the accretion gas strikes the stellar surface. Since the H I absorption velocity is between and km s-1, the absorbing H I gas is located between 2.3 and 4.4 above the accretion shock (cf. Eq. in Calvet & Gullbring 1998) if we assume that the accretion columns have a constant cross-sectional area and the infalling gas sees only gravitational forces.
References
- Abgrall et al. (2000) Abgrall, H., Roueff, E., & Drira, I. 2000, A&AS, 141, 297
- Abgrall et al. (1993) Abgrall, H., Roueff, E., Launay, F., Roncin, J. Y., & Subtil, J. L. 1993, A&AS, 101, 273
- Ardila et al. (2002) Ardila, D. R., Basri, G., Walter, F. M., Valenti, J. A., & Johns-Krull, C. M. 2002, ApJ, 566, 1100
- Bouvier et al. (2007) Bouvier, J., Alencar, S. H. P., Harries, T. J., Johns-Krull, C. M., & Romanova, M. M. 2007, in Protostars and Planets V, ed. B. Reipurth, D. Jewitt, & K. Keil (Tucson, AZ: Univ. of Arizona Press), 479
- Brown et al. (1981) Brown, A., Jordan, C., Millar, T. J., Gondhalekar, P., & Wilson, R. 1981, Nature, 290, 34
- Calvet & Gullbring (1998) Calvet, N., & Gullbring, E. 1998, ApJ, 509, 802
- Cardelli et al. (1989) Cardelli, J. A., Clayton, G. C., & Mathis, J. S. 1989, ApJ, 345, 245
- Danforth et al. (2010) Danforth, C. W., Keeney, B. A., Stocke, J. T., Shull, J. M., & Yao, Y. 2010, ApJ, 720, 976
- Dixon et al. (2010) Dixon, W. V., et al., 2010, Cosmic Origins Spectrograph Instrument Handbook, Version 3.0 (Baltimore, MD: StScI)
- France et al. (2010) France, K., Linsky, J. L., Brown, A., Froning, C. S., & Béland, S. 2010, ApJ, 715, 596
- Ghavamian et al. (2010) Ghavamian, P., Aloisi, A., Lennon, D., Hartig, G., Kriss, G., Oliveira, C., Massa, D., Keyes, C., Proffitt, C., Niemi, S., Delker, T., Osterman, S., & COS/STIS STScI Team. 2010, in Bulletin of the American Astronomical Society, Vol. 42, Bulletin of the American Astronomical Society, 499
- Günther & Schmitt (2007) Günther, H. M., & Schmitt, J. H. M. M. 2007, Mem. Soc. Astron. Italiana, 78, 359
- Herczeg & Hillenbrand (2008) Herczeg, G. J., & Hillenbrand, L. A. 2008, ApJ, 681, 594
- Herczeg et al. (2002) Herczeg, G. J., Linsky, J. L., Valenti, J. A., Johns-Krull, C. M., & Wood, B. E. 2002, ApJ, 572, 310
- Herczeg et al. (2006) Herczeg, G. J., Linsky, J. L., Walter, F. M., Gahm, G. F., & Johns-Krull, C. M. 2006, ApJS, 165, 256
- Herczeg et al. (2004) Herczeg, G. J., Wood, B. E., Linsky, J. L., Valenti, J. A., & Johns-Krull, C. M. 2004, ApJ, 607, 369
- Ingleby, L. et al (2009) Ingleby, L. et al . 2009, ApJ, 703, L137
- Jensen & Mathieu (1997) Jensen, E. L. N., & Mathieu, R. D. 1997, AJ, 114, 301
- Johns-Krull (2007) Johns-Krull, C. M. 2007, ApJ, 664, 975
- Johns-Krull & Valenti (2001) Johns-Krull, C. M., & Valenti, J. A. 2001, ApJ, 561, 1060
- Jordan et al. (1977) Jordan, C., Brueckner, G. E., Bartoe, J., Sandlin, G. D., & van Hoosier, M. E. 1977, Nature, 270, 326
- Kastner et al. (2008) Kastner, J. H., Zuckerman, B., Hily-Blant, P., & Forveille, T. 2008, A&A, 492, 469
- Muzerolle et al. (2003) Muzerolle, J., Calvet, N., Hartmann, L., & D’Alessio, P. 2003, ApJ, 597, L149
- Osterman et al. (2011) Osterman, S. N., et al., 2011, Ap&SS, in press (astro-ph/1012.5827)
- Predehl & Schmitt (1995) Predehl, P., & Schmitt, J. H. M. M. 1995, A&A, 293, 889
- Quast et al. (2000) Quast, G. R., Torres, C. A. O., de La Reza, R., da Silva, L., & Mayor, M. 2000, in IAU Symposium on The Formation of Binary Stars, held 10-15 April, 2000, in Potsdam, Germany, Vol. 200, IAU Symposium, ed. B. Reipurth & H. Zinnecker, 28
- Schaefer et al. (2006) Schaefer, G. H., Simon, M., Beck, T. L., Nelan, E., & Prato, L. 2006, AJ, 132, 2618
- Stempels & Gahm (2004) Stempels, H. C., & Gahm, G. F. 2004, A&A, 421, 1159
- Walter et al. (2003) Walter, F. M., Herczeg, G., Brown, A., Ardila, D. R., Gahm, G. F., Johns-Krull, C. M., Lissauer, J. J., Simon, M., & Valenti, J. A. 2003, AJ, 126, 3076
| Wavelengths (Å) | Pumping Transitions | aaDissociation probability from upper level, calculated from Abgrall et al. (1993). | Measured | Optical DepthbbThe optical depth is calculated for the additional absorption with = cm-2 and km s-1. | New |
|---|---|---|---|---|---|
| 1212.43 and 1214.54 | 1-1 P(11) and 1-1 R(12) | 0.0 and 0.0 | 1.377 | 0.055 | 1.456 |
| 1213.36 | 3-1 P(14) | 0.015 | 0.999 | 0.087 | 1.090 |
| 1213.68 | 4-2 R(12) | 0.050 | 0.563 | 0.106 | 0.626 |
| 1217.41 | 4-0 P(19) | 0.417 | 0.047 | 3.505 | 1.568 |
| 1217.64 | 0-2 R(1) | 0.0 | 0.098 | 1.700 | 0.537 |
| 1217.90 and 1219.98 | 2-1 P(13) and 3-0 P(18) | 0.002 and 0.189 | 0.226 | 0.894 | 0.553 |