Photoinduced melting of superconductivity in the high-Tc superconductor La2-xSrxCuO4 probed by time-resolved optical and THz techniques.
Abstract
Dynamics of depletion and recovery of superconducting state in La2-xSrxCuO4 thin films is investigated utilizing optical pump-probe and optical pump - THz probe techniques as a function of temperature and excitation fluence. The absorbed energy density required to suppress superconductivity is found to be about 8 times higher than the thermodynamically determined condensation energy density and nearly temperature independent between 4 and 25 K. These findings indicate that during the time when superconducting state suppression takes place ( ps), a large part (nearly 90%) of the energy is transferred to the phonons with energy lower than twice the maximum value of of the SC gap and only 10 % is spent on Cooper pair breaking.
I Introduction
In the last decade or so numerous real-time studies of carrier relaxation dynamics in cuprate superconductors have been performed utilizing pump-probe techniques. The initial studies were aimed at the understanding of relaxation,Han ; Stevens ; Kabanov ; EPL ; Segre ; Schneider ; THzAveritt ; KaindlBiSCO ; RT and the interplay between the superconducting gap and the normal state pseudogap.YBCOOver ; kaindl ; YBCO124 ; KusarPRB Recently, however, several reports explored the dependence on excitation intensity of depletion of superconducting stateKusar ; Giannetti1 ; Pashkin ; Giannetti2 as well as of photoinduced structural dynamicsCarbone and phase transitions.Gedik ; Radovic
It has been known since 1971 that an intense laser pulse can destroy the superconducting (SC) state non-thermally - the absorbed energy density is lower that the energy density required to heat up the sample to the critical temperature.Testardi The rapid development of stable amplified laser systems, producing optical pulses with sub 100 fs pulse duration has enabled studies of dynamics of SC suppression in real time.MgB2 This technique enables direct measurement of the SC condensation energy, (the difference in the free energy density between the SC and normal states at zero temperature). If, following photoexcitation with a fs optical pulse, the absorbed energy remains in the electronic subsystem during the process of SC state destruction, the absorbed (optical) energy density required to suppress SC, , should be equal to . In conventional superconductors can be directly determined by measuring the thermodynamic critical magnetic field, , where . However, in high- cuprate superconductors the critical magnetic fields are very high and hardly accessible experimentally. To determine in cuprates, the T-dependence of the electronic specific heat has been studied.Loram ; CpLSCO However, since is determined by measuring the total specific heat of the SC sample, and subtracting the phonon part (obtained by measuring the specific heat of an impurity doped non-SC sample), it may be prone to some uncertainty.
In a recent optical pump-probe (OPP) study, an attempt was made to determine in single crystals of high temperature superconductor La2-xSrxCuO4 (LSCO) by means of ultrafast optics.Kusar was found to be about one order of magnitude higher than the thermodynamically determined .CpLSCO This large difference can hardly be attributed to the experimental uncertainties, so it was concluded that the major part of is transferred to the phonon subsystem on the sub-picosecond timescale.Kusar Indeed, a recent optical-pump – THz probe (OPTP) study in optimally doped YBa2Cu3O7-δ (YBCO),Pashkin showed rapid heating of the two infrared-active c-axis phonon modes on the timescale of 150 fs.Pashkin Moreover, was also found to be about 10 times larger than .Pashkin Similar studies on Bi2Sr2CaCu2O8+δ (Bi2212) single crystals Giannetti1 ; Giannetti2 ; Uwe also indicate that .
Here we report the results of study of La2-xSrxCuO4 (x = 0.08, 0.16, 0.21) thin films using both OPP and OPTP. In addition to the low-temperature measurements, the temperature dependence of was studied. We find that, within the experimental uncertainty, both OPP and OPTP give an identical value of for LSCO. This observation is of particular importance, since OPTP is probing the gap resonantly. The obtained value of is nearly identical to the one extracted from the OPP studies on LSCO single crystals.Kusar In addition, we find almost no temperature dependence of below . This observation, together with the fact that , strongly suggest that during the time when the SC state suppression takes place most of the absorbed energy is transferred to phonons with energy lower than , where denotes the value of the SC gap maximum. Because of strong reduction in the density of states at low energies in d-wave superconductors, Cooper pair breaking by phonons with is strongly suppressed. In LSCO about of the absorbed energy is directly released to the lattice due to strong e-ph relaxation and only is spent on destruction of the condensate (Cooper pair breaking).
II Experimental
The LSCO thin films used in this study were grown on LSAO substrate either by molecular beam epitaxy (MBE)MBE or by pulsed laser deposition (PLD)PLD . The film grown by MBE (x = 0.16) had a thickness of 52 nm with surface roughness less than one monolayer, and exhibited a critical temperature, Tc, of 31 K. The films grown by PLD (x = 0.08, 0.21) were nm thich with surface roughness of about 2 nm, and Tc’s of 22, and 25 K, respectively. The OPP experiments were performed in a high sensitivity pump-probe set-up utilizing a 250 kHz regenerative Ti:Sapphire amplifier, delivering 50 fs pulses at 800 nm (1.55 eV), and a fast-scan technique.BBHanjo The pump and probe beam diameters were measured accurately with a CCD camera, and were 120 m and 60 m, respectively, to insure a homogeneous excitation profile. The OPTP experiments were performed using a set-up based on the same amplifier system, employing a large-area photoconductive finger emitter generating phase-locked THz pulses with spectrum covering 0.2 - 3 THz range.OptExp The THz beam was focussed to about 1.5 mm, while the pump beam diameter was about 3 mm, to insure a homogeneous excitation profile. Experiments were conducted in a wide range of excitation fluences (3 orders of magnitude), spanning from F = 0.1 J/cm2 up to 200 (100) J/cm2 in the OPP (OPTP) configurations.
III Results
Figure 1 presents the photoinduced (PI) dynamics probed by the OPP and OPTP configuration at 4K. The PI reflectivity () traces for different excitation fluences (in J/cm2) are shown in Fig. 1a. Like in many cuprate superconductors,EPL ; YBCO124 ; KusarPRB two distinct relaxation components are observed in time-domain studies in LSCO, one (A) being present only below the SC critical temperature, while the other one (B) being sensitive to the opening of the normal state pseudogap.KusarPRB ; Kusar At low temperatures and excitation densities the component A is dominant.KusarPRB It is characterized by a rise-time of 0.7 ps and the decay time on the 10 ps timescale. The component B, on the other hand, is characterized by a sub 100 fs rise-time and the recovery that is weakly dependent on temperature and excitation fluence, with the recovery time-scale not exceeding 1 ps. Upon increasing the excitation fluence, F, the component A shows saturation (see Fig. 2a), while the component B increases linearly with F up to much higher fluences. Given the fact that the component A can be attributed to suppression and recovery of the superconducting gap, its saturation observed at high excitation densities can be naturally attributed to the complete destruction of superconductivity.
To measure the dynamics of SC suppression and recovery in the THz range, over large range of F, we have performed studies of the spectrally integrated conductivity change (often refereed to as a 1-dimensional scan technique).Future Here the photoinduced change in the optical conductivity, , is proportional to the photoinduced change in the transmitted electric field , where is a fixed point of trace - see the insert to Fig. 1b. In LSCO THz, so the SC-induced change in the THz optical conductivity modifies the transmitted electric field transient mainly because of the appearance of the so-called kinetic inductance.MgB2 To achieve a high dynamic range, ps was recorded (marked by an arrow in insert to Fig. 1b), where the change in the electric field transmitted through the sample, , corresponding to the transition between the SC and normal states, is the highest. The PI traces recorded in near optimally doped sample (La1.84Sr0.16CuO4) at 4 K and at various fluences are displayed in Fig. 1b. Similarly to the component A from the OPP data, the amplitude of the induced change initially increases linearly with F and shows saturation at high F, as shown in Fig. 2b.
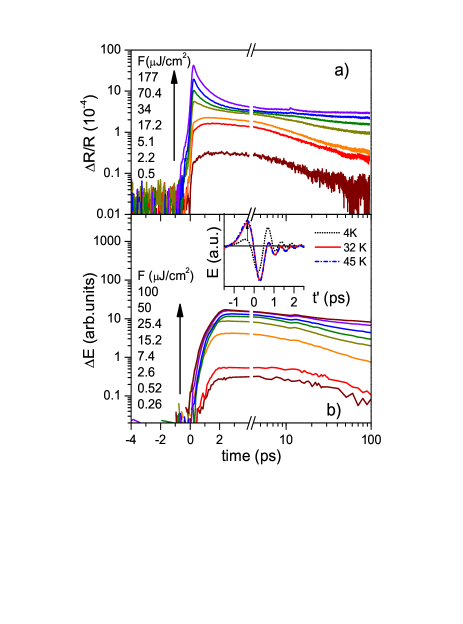
Another noteworthy feature of the data shown in Fig. 1 is the dependence of the recovery dynamics on fluence. At lowest excitation densities, the PI changes in reflectivity and in THz conductivity almost completely recover, with the characteristic decay time of ps (using the exponential decay fit). At higher excitation fluences, after the initial recovery on the 10 ps timescale, the induced change reaches plateau, with further recovery proceeding on a much longer timescale. As we discuss below, this plateau can be attributed to an overall increase in the film temperature and its recovery is governed by the heat diffusion to the substrate. Indeed, as the excitation density is increased above J/cm2, the PI signal at the time delay of 100 ps, which is much longer than the characteristic SC state recovery time of ps, also shows a saturation behavior - see Figs. 2c and 2d.
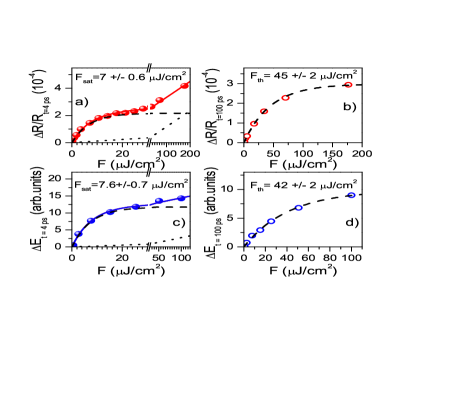
In Fig. 2a we plot the F-dependence of the magnitude of component A, which is related to SC state suppression. In order to avoid picking up the contribution from component B, which starts to dominate once the component A saturates, we plot the magnitude of the signal at the time delay of 4 ps. To determine the characteristic fluence required to suppress SC, we use a simple saturation model:
| (1) |
The first term corresponds to the saturating part, where is the excitation fluence required to suppress the SC. The second term in Eq.(1) is accounting for small contribution from the component B, which at high F is not negligible despite the fact that the recovery time of component B is less than 1 ps. and are constants. From the best fit to the data (solid curve in Fig. 2a) we obtain J/cm2. In Fig. 2c, we plot the F-dependence of the corresponding induced change in the transmitted THz electric field, , again recorded at 4 ps after photoexcitation. Similarly to the OPP data, the saturation of the induced change is observed with J/cm2. Within the uncertainty in the absolute excitation densities in the two configurations, the values for obtained in the two experimental configurations are identical.
To accurately determine the absorbed energy density, which corresponds to the optically induced suppression of the SC state, we have measured the dielectric constants of La2-xSrxCuO4 at the excitation photon energy of 1.55 eV (800 nm). By measuring the reflectivity R and transmission T through the film on substrate and through the bare substrate, and using the appropriate Fresnel equations we numerically solved a system of equations for R and T.Harbecke The extracted complex refractive index of La1.84Sr0.16CuO4 is nm. From the measured reflectivity and the extinction coefficient (cm-1) we obtained the absorbed energy density that corresponds to , . For near optimally doped La1.84Sr0.16CuO4 Jcm-3, which corresponds to kBK per Cu atom (i.e. K/Cu).
In Figs. 2c and 2d, we plot the F-dependence of the PI change in reflectivity and in the transmitted THz electric field, at the time delay of 100 ps. Since this is substantially longer than the timescale for SC recovery, we can assume that 100 ps after photoexcitation the film is in the quasi-equilibrium, where the electronic system and the underlying lattice are thermalized at a given temperature. Similarly to the PI amplitude at short time delays, the saturation of the signal is observed with a characteristic fluence J/cm2, which corresponds to the absorbed energy density Jcm K/Cu.
We should note that in our case the excitation density is nearly homogeneous throughout the probed volume, since i) the pump spot diameter is twice bigger than the probe spot diameter and ii) the film thickness (52 or 75 nm) is substantially lower than the optical penetration depth (e.g. nm). Thus the values for and are quite precise.
The absorbed energy density corresponding to transiently suppressing the SC state, is about 8 times higher than K/Cu.CpLSCO On the other hand, is by about a factor of 5-6 lower than the energy required to heat up the excited sample volume to above . Using the reported data on the total specific heat for the optimally doped LSCO,Junod we obtain Jcm K/Cu. This value is in very good agreement with K/Cu, implying that at fluences above , superconductivity is also thermally suppressed, with its recovery proceeding on the timescale determined by the heat diffusion. The excellent agreement between obtained by OPP and OPTP techniques, as well as the agreement between and strongly indicate that , where is determined thermodynamically.
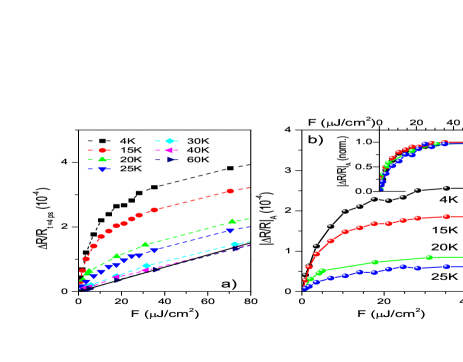
To gain further insight into the energetics of the photoinduced SC to normal phase transition, we have performed the first temperature dependent studies of photoinduced quenching of superconductivity. Importantly, continuous heating of the sample is in the case of thin films substantially reduced in comparison to single crystals, since the low temperature thermal conductivity of LSAO substrate LSAOthermal is much higher than that of LSCO (especially in the c-direction).LSCOKappa Therefore the cumulative temperature increase of the probed spot is negligible enabling such studies all the way up to close vicinity of Tc. In Fig. 3, we present the F-dependence of PI reflectivity change at time delay of 4 ps, recorded in near optimally doped LSCO at several temperatures below and above Tc = 31 K. Above Tc, all the data fall on the same curve, displaying linear F-dependence of the normal state response. Below Tc, the signal clearly shows two contributions, one (A) showing saturation above Fsat, while the other (B) showing linear F-dependence, with the slope being T-independent in the range of temperatures studied. By subtracting the contribution of the component B from all the data, we obtain the fluence dependence of the component A - see Fig. 3b. Interestingly, Fsat () is found to be nearly temperature independent up to 25 K.
Similar data to the one on a near optimally doped film (Fig. 3) were obtained also in an underdoped x=0.08 and an overdoped x=0.21 films prepared by pulsed laser deposition. Figure 4 summarizes the results on a x = 0.08 sample in the optical pump-probe configuration (similar data are obtained in the optical pump THz probe configuration). Here also, in the normal state the photoinduced reflectivity change varies linearly with fluence (component B). When the normal state response is subtracted from the data, the superconducting response (component A) shows clear saturation (Fig. 4b), with the threshold fluence, Fsat, required to transiently suppress superconductivity being nearly temperature independent all the way to T K.
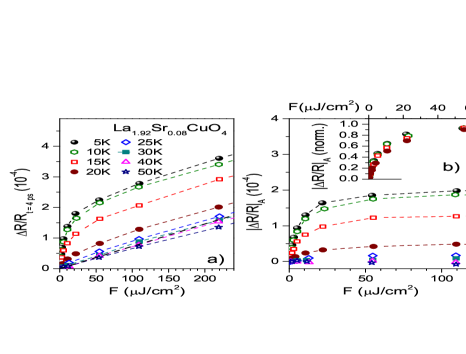
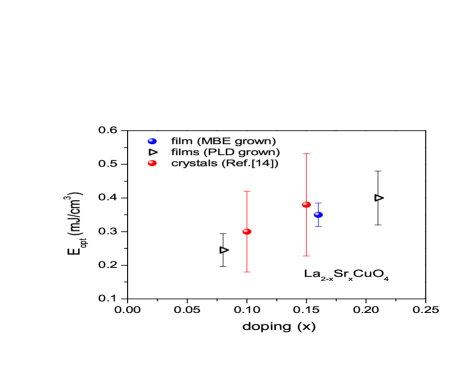
Figure 5 summarizes the values of the for various dopings obtained in La2-xSrxCuO4 thin films together with the values obtained on the single crystals.Kusar For all films the values of the complex refractive index were determined by measuring reflectivity and transmission at near normal incidence through the film and the bare substrate and numerical analysis of Fresnel equations.Harbecke The larger error bars on films grown by pulsed laser deposition stem from the uncertainty in the film thickness of nm.
IV Discussion
The observation of being nearly T-independent below with is in striking contrast to similar studies on the NbN superconductor.Beck There, was foundBeck to be equal to , with both following the temperature dependence of . The large disproportionality between the and was arguedKusar to be due to transfer of a large fraction of the absorbed optical energy to high frequency () phonons on the timescale required to suppress superconductivity ( ps in LSCO). On the other hand, in conventional superconductors like MgB2MgB2 and NbN,Beck the optically induced suppression of SC state also takes place via a two-step process.MgB2 Here, high energy electrons(holes) created by absorption of photons with energy much larger that the gap energy, first relax towards the gap via e-e and e-ph scattering. The fact that the pair-breaking time ( ps) is large and excitation density dependentMgB2 was attributed to the fact, that during the initial e-e and e-ph scattering a high density of optical phonons with energies larger than is generated, which subsequently break Cooper pairsRT on the 10 ps timescale. The question arises, then, why in LSCO and YBCO, while in NbN? To answer this question, we discuss the nature of e-ph scattering processes and compare the phonon spectra and sizes of the superconducting gaps between the two cases.
As it was pointed out also in Ref.kabalex , the dominant process in cooling of photoexcited electrons (holes) is the inelastic scattering by phonons; e-e scattering is dominant only if the energy of the electron (hole) is far from the Fermi energy. Here we would like to address the issue of the energy and momentum distributions of phonons generated by hot electrons (holes). Generally, the transition rate of the electron with momentum and energy to the state with the momentum via emission of a phonon with the momentum and frequency is given by
| (2) |
where is the matrix element which depends on the e-ph scattering mechanism while and are the equilibrium distribution functions of phonons and electrons, respectively. By integrating Eq.(2) over one obtains the number of phonons generated by a hot electron (or hole) per unit of time. Note that this expression represents only one part of the e-ph collision integral.kabalex The second part describes the phonon absorption (mainly Cooper pair breaking), which is strongly energy dependent in the case of a superconductor with the gap in the quasiparticle excitation spectrum. Frequently, one is not interested in the momentum distribution of phonons and electrons and considers their distribution as a function of energy only. However, here one should consider also the momentum distribution of generated phonons. To find the rate of generation of phonons at a particular wave-vector , we integrate the expression (2) over the angular part of , keeping the modulus of constant. Since experiments are performed at low temperatures and rather low excitation densities, we can assume that . Under this assumption, we obtain
| (3) |
where is the effective mass of charge carriers. Eq.(3) describes the phonon generation rate by hot electrons (holes). For metals, we can substitute in Eq.(3) by the Fermi wave vector assuming a large Fermi energy. Because of the energy conservation, , and momentum conservation, the phonon wavevector in Eq.(3) is restricted by where and .
In most metals, screening is strong, and the matrix element of the electron interaction with optical phonons (deformation optical phonon scattering, DO) isgantmah momentum independent . Since - see Eq.(3) - generation of optical phonons at is dominant. Yet, since the phase volume of phonons is small, when we integrate Eq.(3) with , the total energy accumulated by the low- optical phonons remains small.
The matrix element of the interaction of electrons with acoustic phonons (deformation acoustic phonon scattering, DA) has dependence,gantmah and thus is momentum independent; hence, the energy is mainly transferred to the high- (high-) acoustic phonons due to their large phase volume.
In NbN, the phonon spectrum consists of acoustic branches extending up to meV and the weakly dispersing optical branches at meV,NbNneutrons while meV Dressel . From the above considerations, it follows that the inital e-ph scattering process generates a high density of optical phonons and high-frequency acoustic phonons, all of which have energy larger than . All of these phonons can effectively break Cooper pairs. When on the timescale of Cooper pair breaking ( ps in NbN) the quasi-equilibrium is established between the populations of quasiparticles and phonons with , the excess energy is almost exclusively stored in the electronic subsystem.RT ; comment Therefore it is no surprise that , as experimentally observed.
In high- superconductors, however, in addition to the DO and DA processes, the scattering on the c-axis polar (infrared active) optical phonons (polar optical scattering, PO) is possible. Since the -axis plasma frequency is low, the polar optical phonons are unscreened.caxisphonons As it is well known,gantmah the matrix element of the interaction of electrons with polar optical phonons scales as . Since , the non-equilibrium distribution function of polar c-axis phonons is strongly peaked at low-. Moreover, in the case of PO, the integration over the phase volume does not cancel the dependence of the generation rate. Therefore for scattering on polar optical phonons also most of the energy is accumulated near the point of the Brillouin zone, and it can be sizeable as demonstrated.Pashkin
In LSCO, acoustic branches extend up to meV, while the spectrum of optical phonons continuously extends all the way to 100 meV with a maximum in the phonon density of states near 20-30 meV.PDOSlsco On the other hand, in LSCO the value of the gap maximum in the anti-nodal direction isLSCOgap meV. Comparison of meV with the phonon density of states, taking into account the different e-ph scattering mechanisms, reveals that in LSCO the e-ph scattering creates a high density of phonons with . The Cooper pair breaking process by absorption of phonons with is strongly suppressed even in d-wave superconductors, due to the energy and momentum conservation laws and the strong reduction in the density of states at low energies Hirschfeld . Therefore the generation of phonons with can present a parallel energy relaxation channel, competing with Cooper pair breaking. Since does not change substantially between 4K and 0.8 Tc, it is conceivable that relaxation via these channels is the cause of the observed large difference between and .
The calculation of phonon emission rates for various possible e-ph scattering processes is generally difficult and clearly beyond the scope of this paper. However, for the generation of c-axis polar modes via the polar optical phonon scattering such a calculation is rather straightforward, and can be directly compared with the recent studies of time-resolved c-axis THz conductivity dynamics in the superconducting state of YBCO.Pashkin In this work in addition to the QP relaxation dynamics the dynamics of two infrared active phonons have been investigated, showing a remarkably fast increase in the phonon population density of the apical phonon on the timescale of fs.Pashkin Integrating Eq.(3) with and taking into account that where , and are the static and the high frequency dielectric functions, respectively, we obtain (see also Eq. (4.53) in Ref.gantmah )
| (4) |
where is the permittivity of vacuum. Using the values for the c-axis dielectric constants , dielectric where is the lattice constant, and the free electron mass, we obtain fs for the generation of one c-axis polar optical phonon with meV. Therefore, in the absence of phonon re-absorption processes, the electron (hole) at eV above(below) the Fermi energy releases its excess energy to c-axis polar optical phonons on the timescale of fs, consistent with measurements on YBCO.Pashkin Indeed, the maximum photoinduced softening of the apical phonon in YBCO is comparable to the effect induced by a thermal phonon population at K,Pashkin suggesting that the phonon distribution function is on the sub picosecond timescale highly non-thermal.
As we have shown, following absorption of high energy photons, hot electrons (holes) in cuprate superconductors rapidly relax towards the gap energy by generating large densities of phonons (predominantly zone edge acoustic and zone center polar optical phonons). Since in cuprates (investigated to date) is comparable to the phonon cut-off frequency, large portion of the absorbed energy is on the 100 fs timescale transferred to phonons without affecting superconductivity.
The doping dependent study - see Fig. 5 - reveals a nearly linear increase of as a function of doping. Qualitatively, the increase of from the strongly underdoped LSCO towards optimal doping could be understood within the above scenario to be a result of an increase in the gap energy scale and therefore the number of phonon modes with upon doping. However, given the fact that shows a decrease upon entering the overdoped range,Yuli ; TcVsDop one would expect to follow this dependence. The fact that shows no decrease in the overdoped regime, however, implies that the generation rate of phonons is also affected by doping, increasing with .
The question arises, however, whether the observation that the generation rate of phonons is increasing with doping necessary means that the electron-phonon coupling constant is increasing with doping? The short answer is no. The dimensionless e-ph coupling constant , which in the BCS theory determines the value of the critical temperature, is defined as
| (5) |
where is the Eliashberg function, which depends only on the phonon frequency . In general, however, the Eliashberg function depends also on the energy of electron. For simplicity, let us consider good metals, where screening is large, and the momentum dependence of electron-phonon interaction becomes less important. In this case, according to the Eq.(28) of Ref.[36], the relaxation of hot electrons can be described in terms of the Eliashberg function , which depends both on phonon frequency as well as the electron energy, , counted from Fermy energy, .kabalex ; Allen Since the characteristic energy of electron in the thermodynamic equilibrium is small (of the order of ), it is usually neglected in the Eliashberg function which enters into Eq.(5), i.e. . However, after photo excitation the characteristic energy of hot electrons is sufficiently higher then . Since the phonon generation rate by hot electrons is proportional to the spectral function of the electron-phonon interaction,kabalex neglecting the dependence in the Eliashberg function may be incorrect. If the function at of the order of the photon energy, , is sufficiently different from Eliashberg function at , this can have a very strong effect on the optical energy required for the depletion of the superconducting state. For example, if hot electrons interact mainly with the low frequency phonons (i.e. is peaked at low frequencies), while is peaked in the range of high-frequency phonons, the initial relaxation of hot electrons may create phonons which do not interact with electrons at and do not give rise to Cooper pair breaking. In the oposite case, when hot electrons interact mainly with the high frequency phonons, while is peaked at low frequencies, the electrons near the Fermi energy are only weakly coupled to the high frequency optical modes. In such a case, the optical phonons first need to decay into the low-frequency ones before Copper pair-breaking can take place, and the pair-breaking process will be strongly delayed.
From the experiments performed on cuprates thus far,Kusar ; Pashkin ; Giannetti1 ; Giannetti2 the characteristic time-scales for suppression of superconductivity are in the range of 100 to several 100 femtoseconds. From the above considerations we suggest, that in cuprates the dominant part of the absorbed energy is on the 100 fs timescale transferred to phonons, which do not take part in the Cooper pair-breaking process. To further clarify these interesting observations, systematic studies of the Cooper pair-breaking process as a function of excitation photon energy, measuring both the dynamics of the condensate as well as that of the phonons Pashkin are required, some of which are already on the way.
V Conclusions
Utilizing optical pump-probe and optical pump-THz probe techniques, we have performed systematic studies of the dynamics of suppression and recovery of superconducting state in La2-xSrxCuO4 thin films. The results clearly demonstrate that the absorbed energy density required to suppress superconductivity exceeds the thermodynamically determined condensation energy by a factor of , yet this energy is by a factor of lower than the energy required to thermally heat up the photoexcited volume to above Tc. While there is some uncertainty in the existing determination of the condensation energy, it could hardly explain the observed high ratio. Moreover, the lack of temperature dependence of up to Tc clearly suggests that the measured , and suggests the existence of a parallel energy relaxation channel. By considering various e-ph scattering mechanisms we conclude that in cuprates a large amount of the absorbed optical energy is transferred to phonons with , on the 100 fs timescale. Since Cooper pair breaking by phonons with is strongly suppressed, it is the e-ph scattering to these phonons that presents the parallel relaxation path.
Acknowledgements.
J.D. acknowledges discussions with T. Dekorsy, A. Leitenstorfer, A. Pashkin, K.W. Kim and P. Leiderer. The research was supported in parts by the Sofja-Kovalevskaja Grant from the Alexander von Humboldt Foundation, Zukunftskolleg and CAP at the University of Konstanz, joint German-Israeli DIP Project - grant No. 563363, and the Karl Stoll Chair in advanced materials (Technion).The work at BNL was supported by US DOE contract MA-509-MACA.References
- (1) S.G. Han, Z.V. Vardeny, K.S. Wong, O.G. Symko, and G. Koren, Phys. Rev. Lett. 65, 2708 (1990).
- (2) C.J. Stevens, et al., Phys. Rev. Lett. 78, 2212 (1997).
- (3) V.V. Kabanov, J. Demsar, B. Podobnik, and D. Mihailovic, Phys. Rev. B 59, 1497 (1999).
- (4) J. Demsar, et al., Europhys. Lett. 45, 381 (1999).
- (5) G.P. Segre, et al., Phys. Rev. Lett. 88, 137001 (2002).
- (6) M.L. Schneider, et al., Eur. Phys. J. B 36, 327 (2003).
- (7) R.D. Averitt, et al., Phys. Rev. B 63, 140502(R) (2001).
- (8) R.A. Kaindl, M.A. Carnahan, D.S. Chemla, S. Oh, and J.N. Eckstein, Phys. Rev. B 72, 060510 (2005).
- (9) V.V. Kabanov, J. Demsar, and D. Mihailovic, Phys. Rev. Lett. 95, 147002 (2005).
- (10) J. Demsar, B. Podobnik,V.V. Kabanov, T. Wolf, and D. Mihailovic, Phys. Rev. Lett. 82, 4918 (1999).
- (11) R.A. Kaindl, et al., Science 287, 470 (2000).
- (12) D. Dvorsek, et al., Phys. Rev. B, 66, 020510 (2002).
- (13) P. Kusar, J. Demsar, D. Mihailovic, and S. Sugai, Phys. Rev. B 72, 014544 (2005).
- (14) P. Kusar, et al., Phys. Rev. Lett. 101, 227001 (2008).
- (15) C. Giannetti, et al., Phys. Rev. B 80, 235129 (2009).
- (16) A. Pashkin, et al., Phys. Rev. Lett. 105, 067001 (2010).
- (17) G. Coslovich, et al., arXiv:1005.4320.
- (18) F. Carbone, D-S. Yang, E. Giannini, A.H. Zewail, Proc. Natl. Acad. Sci. USA 105, 20161 (2008).
- (19) N. Gedik, et al., Science 316, 425 (2007).
- (20) Z. Radovic, N. Bozovic, and I. Bozovic, Phys. Rev. B. 77, 092508 (2008).
- (21) L.R. Testardi, Phys. Rev. B 4, 2189 (1971).
- (22) J. Demsar, et al., Phys. Rev. Lett. 91, 267002 (2003); J. Demsar, et al., Int. J. Mod. Phys. B 17, 3675 (2003).
- (23) J. W. Loram, K. A. Mirza, J. R. Cooper, W. Y. Liang, and J. M. Wada, J. Supercond. 7, 243 (1994).
- (24) T. Matsuzaki, N. Momono, M. Oda, and M. Ido, J. Phys. Soc. Jpn. 73, 2232 (2004).
- (25) R. Cortés, et al., arXiv:1011.1171v1
- (26) I. Bozovic, G. Logvenov, I. Belca, B. Narimbetov, and I. Sveklo, Phys. Rev. Lett. 89, 107001 (2002); I. Bozovic, et al., Nature 422, 873 (2003).
- (27) O. Yuli, I. Asulin, O. Millo and G. Koren, Phys. Rev B 75, 184521 (2007).
- (28) A. Tomeljak, et al., Phys. Rev. Lett. 102, 066404 (2009); H. Schäfer, et al., Phys. Rev. Lett. 105, 066402 (2010).
- (29) M. Beck, et al., Opt. Express 18, 9251 (2010).
- (30) Detailed spectrally resolved equilibrium and non-equilibrium THz conductivity dynamics will be presented elsewhere.
- (31) R. Harbecke, Appl. Phys. B 39, 165 (1986).
- (32) A. Junod, et al., Jap. J. Appl. Phys. 26, 1119 (1987).
- (33) D.T. Morelli, J. Mater. Res. 7, 2492 (1992).
- (34) X. F. Sun, J. Takeya, S. Komiya, and Y. Ando, Phys. Rev B 67, 104503 (2003).
- (35) M. Beck, et al. , in preparation.
- (36) V.V. Kabanov and A.S. Alexandrov, Phys. Rev. B 78, 174514 (2008).
- (37) V.F. Gantmakher and Y.B. Levinson, Carrier scattering in metals and semiconductors, Modern Problems in Condensed Matter Science, Vol 19, Elsevier Science Publishers B.V. 1987.
- (38) A.N. Christensen, et al., Sol. State Comm. 31, 795 (1979).
- (39) K.E. Kornelsen, M. Dressel, J.E. Eldridge, M.J. Brett, and K.L. Westra, Phys. Rev. B. 44, 11882 (1991).
- (40) S. L. Chaplot, W. Reichardt, L. Pintschovius, and N. Pyka, Phys. Rev. B. 52, 7230 (1995).
- (41) A. Ino, et al., Phys. Rev. B. 65, 094504 (2002); Q. Zhang, et al., Physica C 386, 282 (2003).
- (42) P. C. Howell, A. Rosch, and P. J. Hirschfeld, Phys. Rev. Lett. 92, 037003 (2004).
- (43) To estimate the amount of energy in the high frequency () phonon subsystem, which is in the bottleneck case in the quasi - thermal equilibrium with the electronic subsystem, we evaluate the energy required to heat up the high frequency phonon subsystem to . This energy in negligible compared to in both NbN and LSCO.
- (44) C. Bernhard, et al., Phys. Rev. Lett. 80, 1762 (1998); M. Grüninger, D. van der Marel, A. A. Tsvetkov, and A. Erb, Phys. Rev. Lett. 84, 1575 (2000); M. A. Quijada, et al., Phys. Rev. B. 52, 15485 (1995).
- (45) D. Reagor, et al., Phys. Rev. Lett. 62, 2048 (1989).
- (46) H. Takagi, et al., Phys. Rev. B. 40, 2254 (1989).
- (47) O. Yuli, I. Asulin, O. Millo, and G. Koren, Phys. Rev. B. 75, 184521 (2007).
- (48) P.B. Allen and B. Mitrovic, Sol. State Phys. 37, 1 (1982).