Effective Administration of a Large Undergraduate Physics Class: From Enrolment to Assessment Feedback
Administración Efectiva de un Grupo Grande de la Licenciatura en Física: Desde la Inscripción hasta la Retroalimentación de Evaluaciones
Abstract
At the beginning of academic year 2007-08, staff in the School of Physics & Astronomy at the University of Glasgow started to implement a number of substantial changes to the first year physics class. The main aims were to improve the academic performance and progression statistics for the class, with early identification of “at-risk” students being one priority. The introduction of novel electronic and computer-based data processing strategies ensured both a quick turnaround time in processing student records and also a much-improved confidence in the accuracy of assessment feedback returned to students. These techniques were a contributory factor in helping raise the pass-rate by and the direct progression rate by by the end of 2008-09. The effectiveness of these processes have proved adequate for coping with the unexpected and dramatic 50% increase in class size 2009-10 and are now in the process of being rolled out to other classes within the School.
Keywords: undergraduate, administration, streamlining, retention, attendance
Abstract
Al comienzo del año académico 2007-08, el personal en el Departamento de Física y Astronomía en la Universidad de Glasgow empezó a implementar una serie de cambios sustanciales al grupo de física de primer año. Los principales objetivos fueron el mejorar el rendimiento académico y el ascenso estadístico del grupo, con la identificación temprana de estudiantes en riesgo como una primera prioridad. La introducción de nuevas estrategias electrónicas y de procesamiento de datos basados en computadoras, aseguraron un tiempo rápido de entrega de notas a los estudiantes, así como una muy mejorada confianza en la precisión de la retroalimentación de las evaluaciones hacia ellos. Éstas técnicas fueron un factor que contribuyó en el incremento de la razón de pase en aproximadamente un 10% y en la razón de progression directa en aproximadamente 13% hacia el final de 2008-09. La efectividad de estos procesos ha probado adecuadamente como enfrentarse al inesperado y dramático incremento del 50% en el tamaño del grupo en 2009-10 por lo que éstos están ahora siendo aplicados en otros grupos dentro del Departamento.
Palabras Claves: licenciatura, estructuración, administración, retención, asistencia
Journal of Science Education / Revista de Educación en Ciencias 12 (2), 2011
Journal of Science Education / Revista de Educación en Ciencias 12 (2), 2011
1 Introduction
Retention and completion rates for first year classes have been an area of concern in UK universities for some time [1]. Large first year class sizes have traditionally presented challenges for staff wishing to identify and track students who have disengaged from the process of studying; first year physics at the University of Glasgow is no different. In 2007-08, staff initiated a number of substantial changes to the ways in which academic assessment and personal support were offered to students [2, 3]. In order to manage this effectively, concerted effort was also directed towards the development of computer-based data processing strategies.
The use of computer-based technologies to administer large classes is not a new idea [4, 5] nor is the idea of using such technologies to track and support students classified as being “at-risk” [6]. In this case, however, increasing student numbers as well as an increase in the fraction of continuous assessment required for credit in the class demanded that all existing administrative processes be streamlined. The purpose of this paper is to present an overview of the development of those strategies as well as a review of their effectiveness.
2 First year Physics at the University of Glasgow
The context of first year physics within the wider structure of undergraduate degrees both at the University of Glasgow and within the Scottish Educational System is described elsewhere [2, 3]. In summary, first year science students undertake a general curriculum with physics making up one third of that year’s credits; typically 50% of those students do not initially intend to continue with physics beyond first year.
The main part of the academic year at the University of Glasgow runs from September to March with two 11-week semesters [7]. The majority of course material in first year physics is delivered via full-class lectures although laboratory classes play an important role. Assessment is weighted towards the end-of-year examination (60% of the final grade) but continuous assessment plays an important role throughout the year in the form of regular workshop-tests (20% of final grade) and laboratory classes (20% of the final grade). The main peaks of activity in terms of data-processing are: enrolment (mid-September to mid-October); lecture attendance monitoring (daily); laboratory attendance monitoring (daily) and workshop-test attendance monitoring and marking (four per semester)
When the workshop-tests were introduced in 2007-08 in a class of students, it became impractical to continue to process records manually and the decision to introduce computer-based technologies was made. A minimum of 50% attendance at laboratory classes and workshop-tests is required for credit in first year physics. Low levels of engagement, academic performance and retention have been found to be correlated with low attendance at lectures [8, 9] and a decision was made to monitor lecture attendance too.
3 New Technologies and Processes for 2007-08
In order to process data by computer, form recognition software [10] and portable barcode scanner technologies [11] were introduced to the administration of the class. Form recognition software is capable of interpreting hand-written letters and numbers by means of optical character recognition (OCR) as well as reading shaded “bubbles” and “ticked boxes” on forms. Thus, it is particularly useful for collating the answers from multiple choice question (MCQ) papers.
3.1 Enrolment
Students wishing to take first year physics must enrol in the class in two different ways: formally in the University records system (Websurf) and, separately, by filling out a paper enrolment form at the first class meeting. The paper enrolment form (Figure 1) is designed for form recognition, batch-processed by a high-speed document scanner [12] and the data therein downloaded into a bespoke MySQL [13] database from which all post-processing originates.
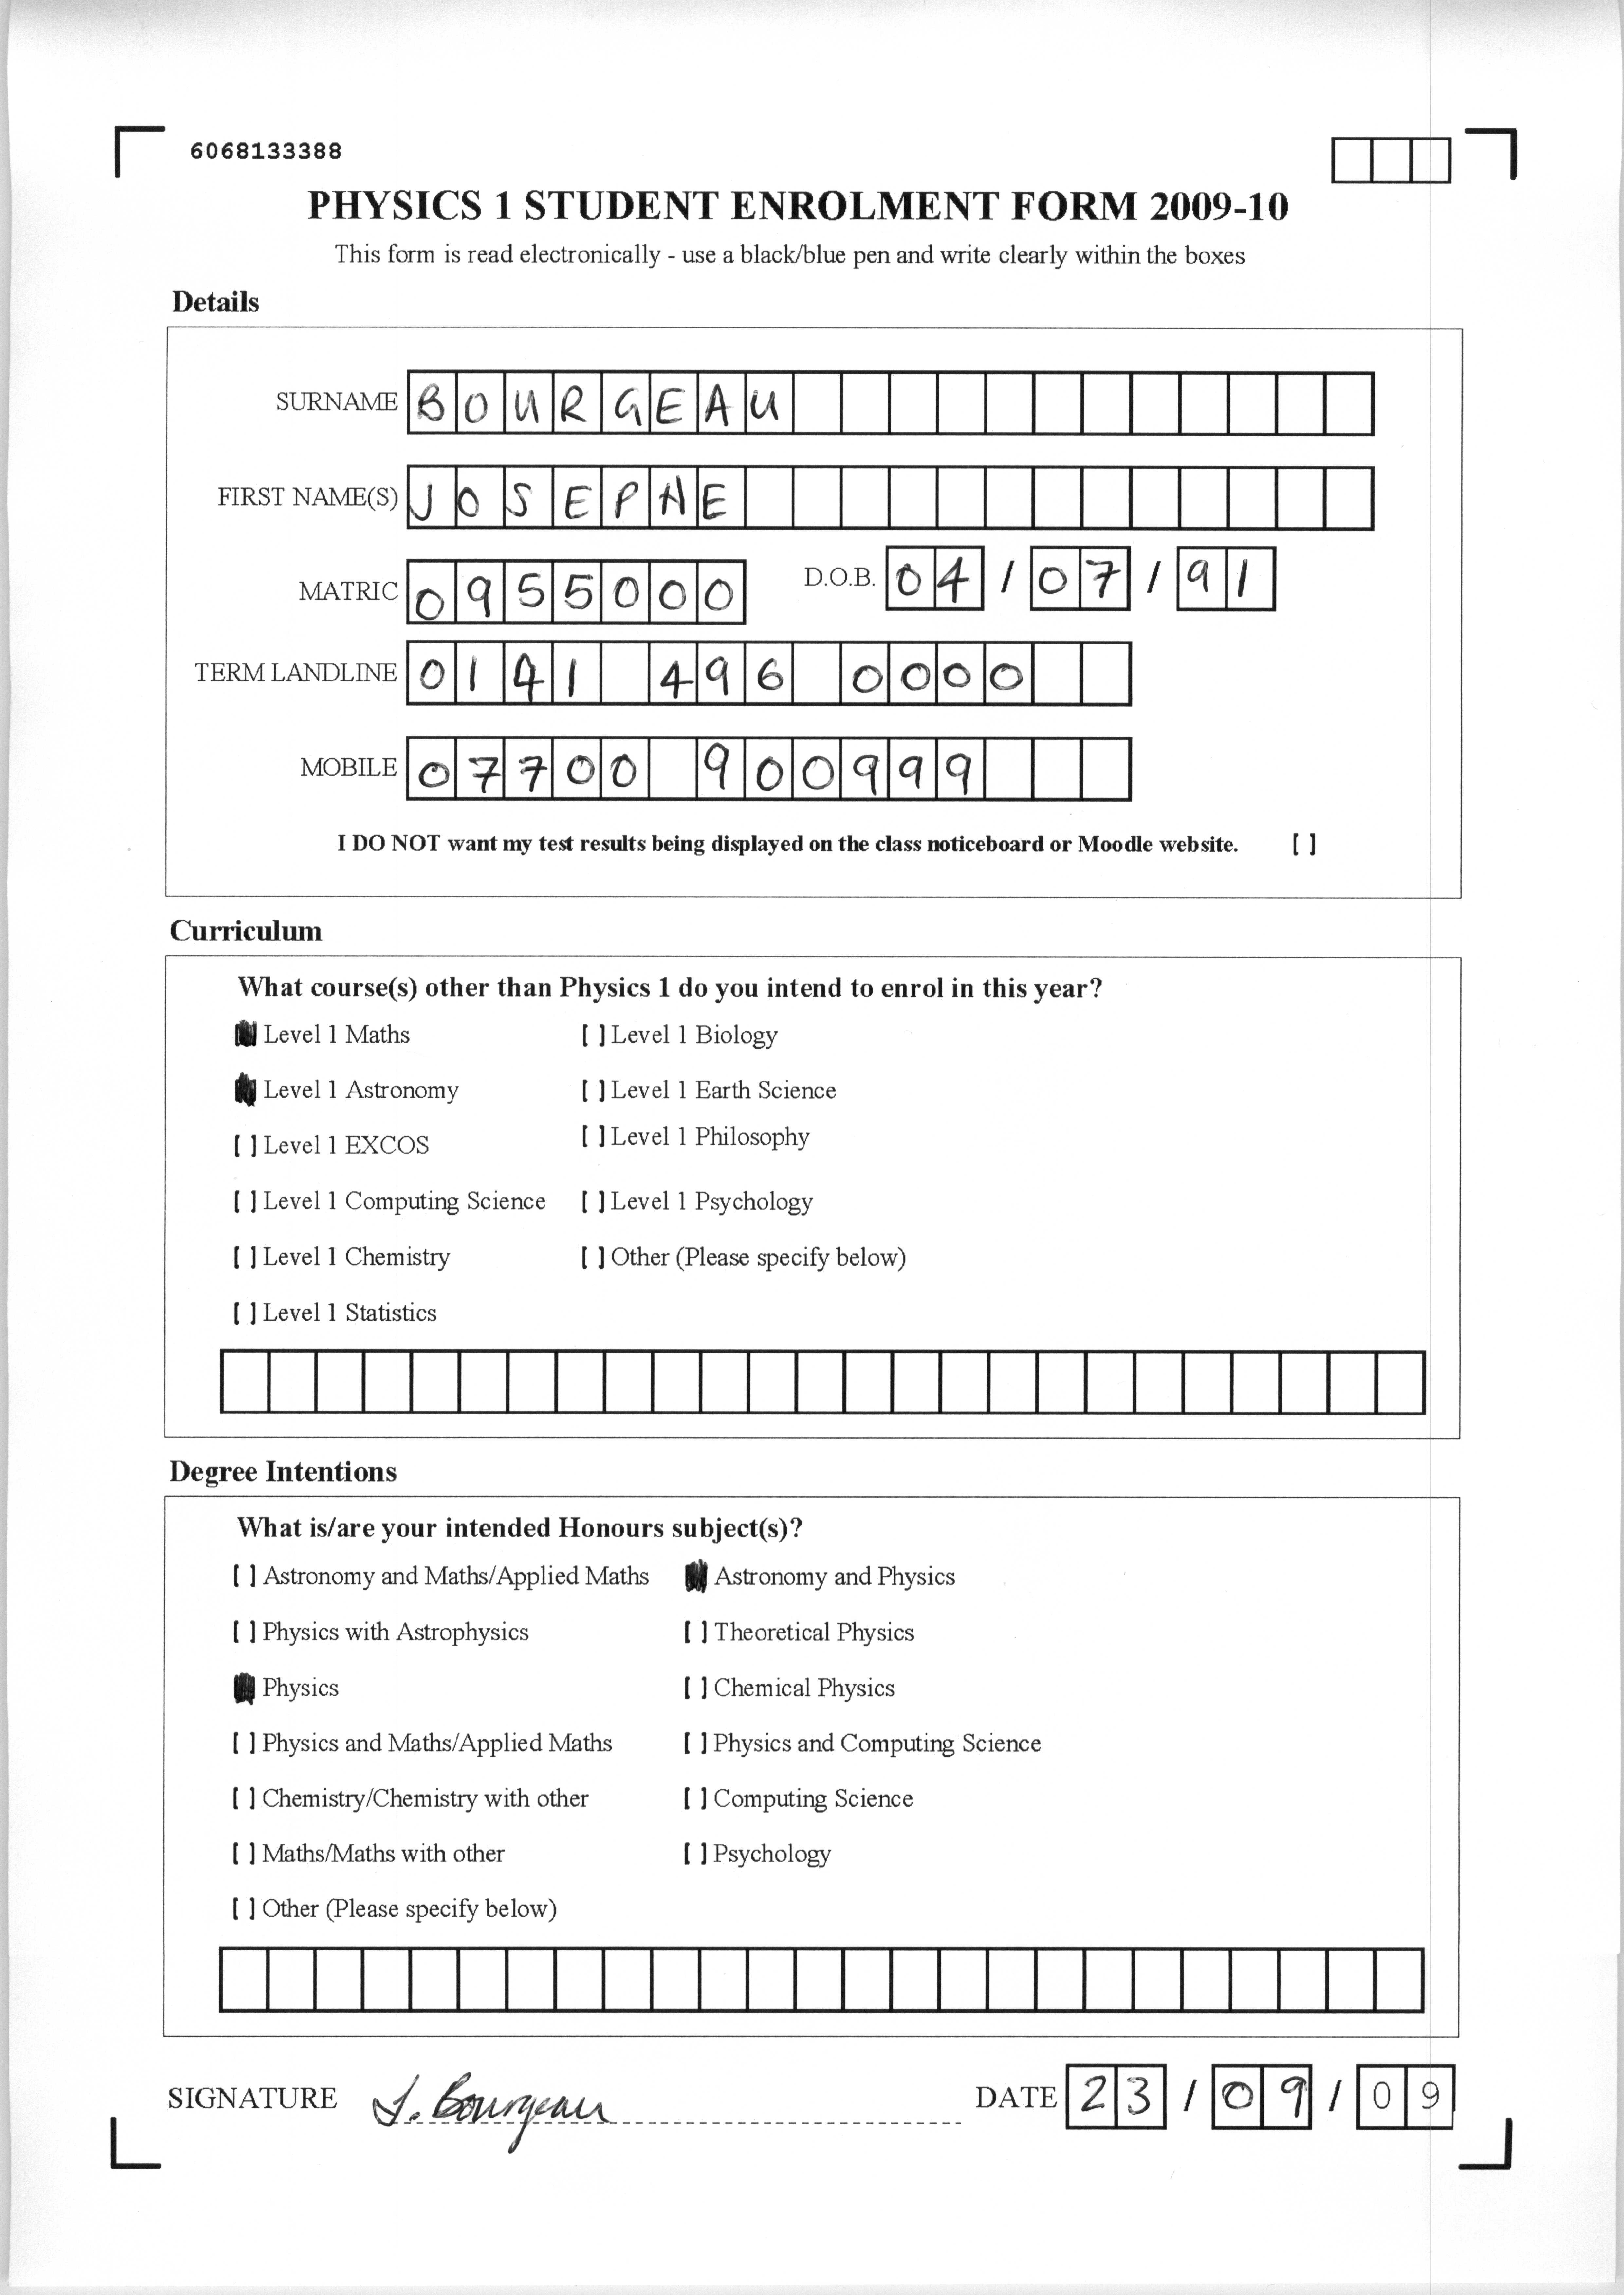
The information requested in the enrolment form may appear minimal and, indeed, consists primarily of data used for internal statistical purposes such as predicting and tracking progression rates (“Curriculum” and “Degree Intentions” sections). Student addresses are not requested because this information already exists in the University’s student records system, Websurf, but mobile telephone numbers are important as they can be used to contact students by Short Message Service (SMS) [2]. To conform to the UK Government’s Data Protection Act [14], students are requested to object to having their continuous assessment results published on the School’s lecture theatre notice boards.
Although it may appear a straightforward task to ask students to enrol in two separate ways, it is one which is presents a number of pitfalls. At the start of the academic year, students often change classes and degree courses after only a few days attendance; frequently they do this without informing staff. Consequently, the class list contained in the central records system, Websurf, may not reflect the local class list held by the School. It is not always possible to differentiate between students who have enrolled in Websurf but have dropped the class without informing a member of staff and students who have enrolled in Websurf but are simply not attending class meetings.
Effective monitoring of attendance and associated work submission stems from having an accurate class register and the problem in finalizing the class register can be illustrated graphically (Figure 2). At approximately 3 weeks into the semester (when it is assumed that the flux in student numbers has fallen effectively to zero), a snapshot from the Websurf list is compared to the paper enrolment forms and the class register is initially compiled from both lists. However, because those two sets can be mutually exclusive, regions Y, Z and T signify varying degrees of confidence in the attendance data collected for any class component.
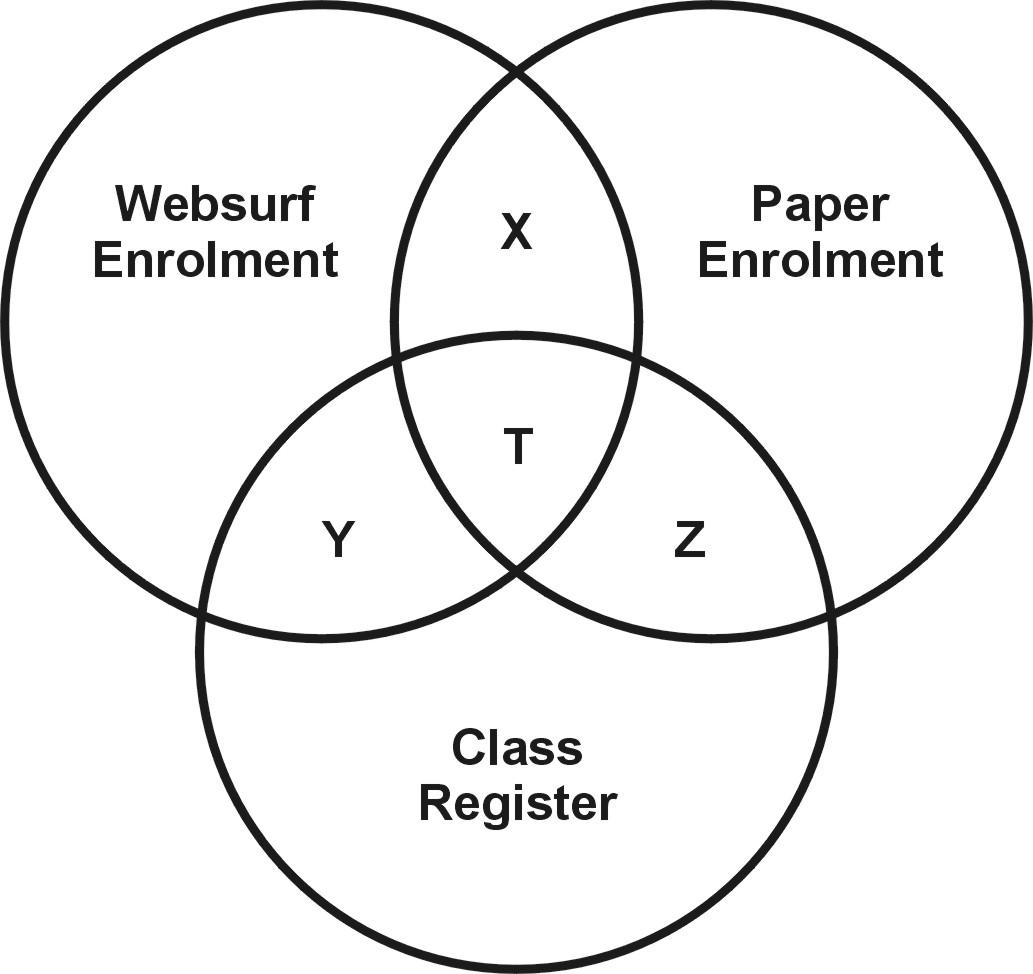
The problem in administering the class is that it is not efficient to spend time chasing apparently absent students who have departed the class without telling anyone. Such students would not be expected to attend but it is not always possible to tell them apart from students who have not dropped the class but who have been absent. When analysing the attendance data, there is maximum confidence for students whose names appear in region T. There is a lack of confidence in determining the absence of students whose names appear in regions Y or Z because they may have dropped the class without informing staff. Region X, however, signifies a genuine absence from someone who would be expected to be present.
The intention is to minimize the amount of time spent chasing non-existent students. Therefore it is desirable to force an overlap between the data from the Websurf and Paper Enrolment sets since that maximizes confidence in correctly contacting “at-risk” students. Experience has shown that this requires the application of personal contact with students.
3.2 Lecture Attendance Monitoring
All students at the University of Glasgow are issued registration cards (formally known as matriculation cards) at the start of each academic session. This identification card has a unique barcode related to the student’s registration number printed on the front which can be read by any commercial barcode scanner. It would be possible to monitor attendance at lectures or laboratory classes by installing fixed barcodes scanner at the entrance to all rooms. Prior to the current system being introduced, a barcode scanner system was installed at the entrance to one lecture room. However, this resulted in severe bottle-necking as large numbers of students tried to enter or leave the room in the 10-minute switchover period between lectures. Therefore, the decision was taken to purchase several portable hand-held barcode scanners [11]. Students were asked to pass these round the lecture theatre during the lecture itself, a quiet beep from the scanner indicating success in scanning the registration card’s barcode.
The use of portable hand-held barcode scanners also makes the system adaptable to future changes; if a lecture is moved at short notice to another room or, even, another building, a lecturer does not have to rely on the installation of fixed scanners in that new room; the portable scanner can be taken with them. More pertinently, the system has already been adapted for use in other classes within the School (such as second year physics) by purchasing, at low additional cost, extra handsets with the use of multiple handsets eliminating ambiguity in the data from different classes.
A priori, staff opinion was that the beeping would be disruptive to lectures (it was less disruptive than students talking quietly), that the scanners would be removed by the students (this has never happened) or that the students would resent being asked to record their attendance every day (in fact, students appear entertained by idea of scanning their registration cards). The worst that has happened so far is that students, as well as scanning their registration cards, sometimes also scan the bar codes on junk-food packaging. However the barcode numbers on junk-food packaging are sufficiently different to those on the University of Glasgow’s registration cards so can be easily filtered out of the data-stream.
The data from the barcode scanner is downloaded into a MySQL database on a daily basis and post-processing allows the profiling of whole-class or individual attendance trends as required. The provision of an accurate class register ensures that, first and foremost, any non-attending students can be identified and, subsequently, contacted to ascertain if they would benefit from any extra support. Post-processing of the whole-year lecture attendance data may also be undertaken to analyse longitudinal trends.
3.3 Laboratory Attendance Monitoring
Initially, it was believed that the lecture attendance model described above could be applied wholesale to the laboratory classes. However, the laboratory classes are often subdivided into several rooms which made identification of individual students problematic. Therefore, a hybrid system where students signed a paper register was introduced.
A typical paper laboratory register (Figure 3) consists of the list of students assigned to a particular experiment on a particular day of the week. As well as the usual name, registration number and signature there is a barcode version of the student’s registration number. Students sign against their name on the list and a manual scan of those barcodes with signatures next to them will provide a list of those who are present in the class. The column marked ‘Tut’ is used for noting which students have handed in their pre-laboratory tutorial questions.
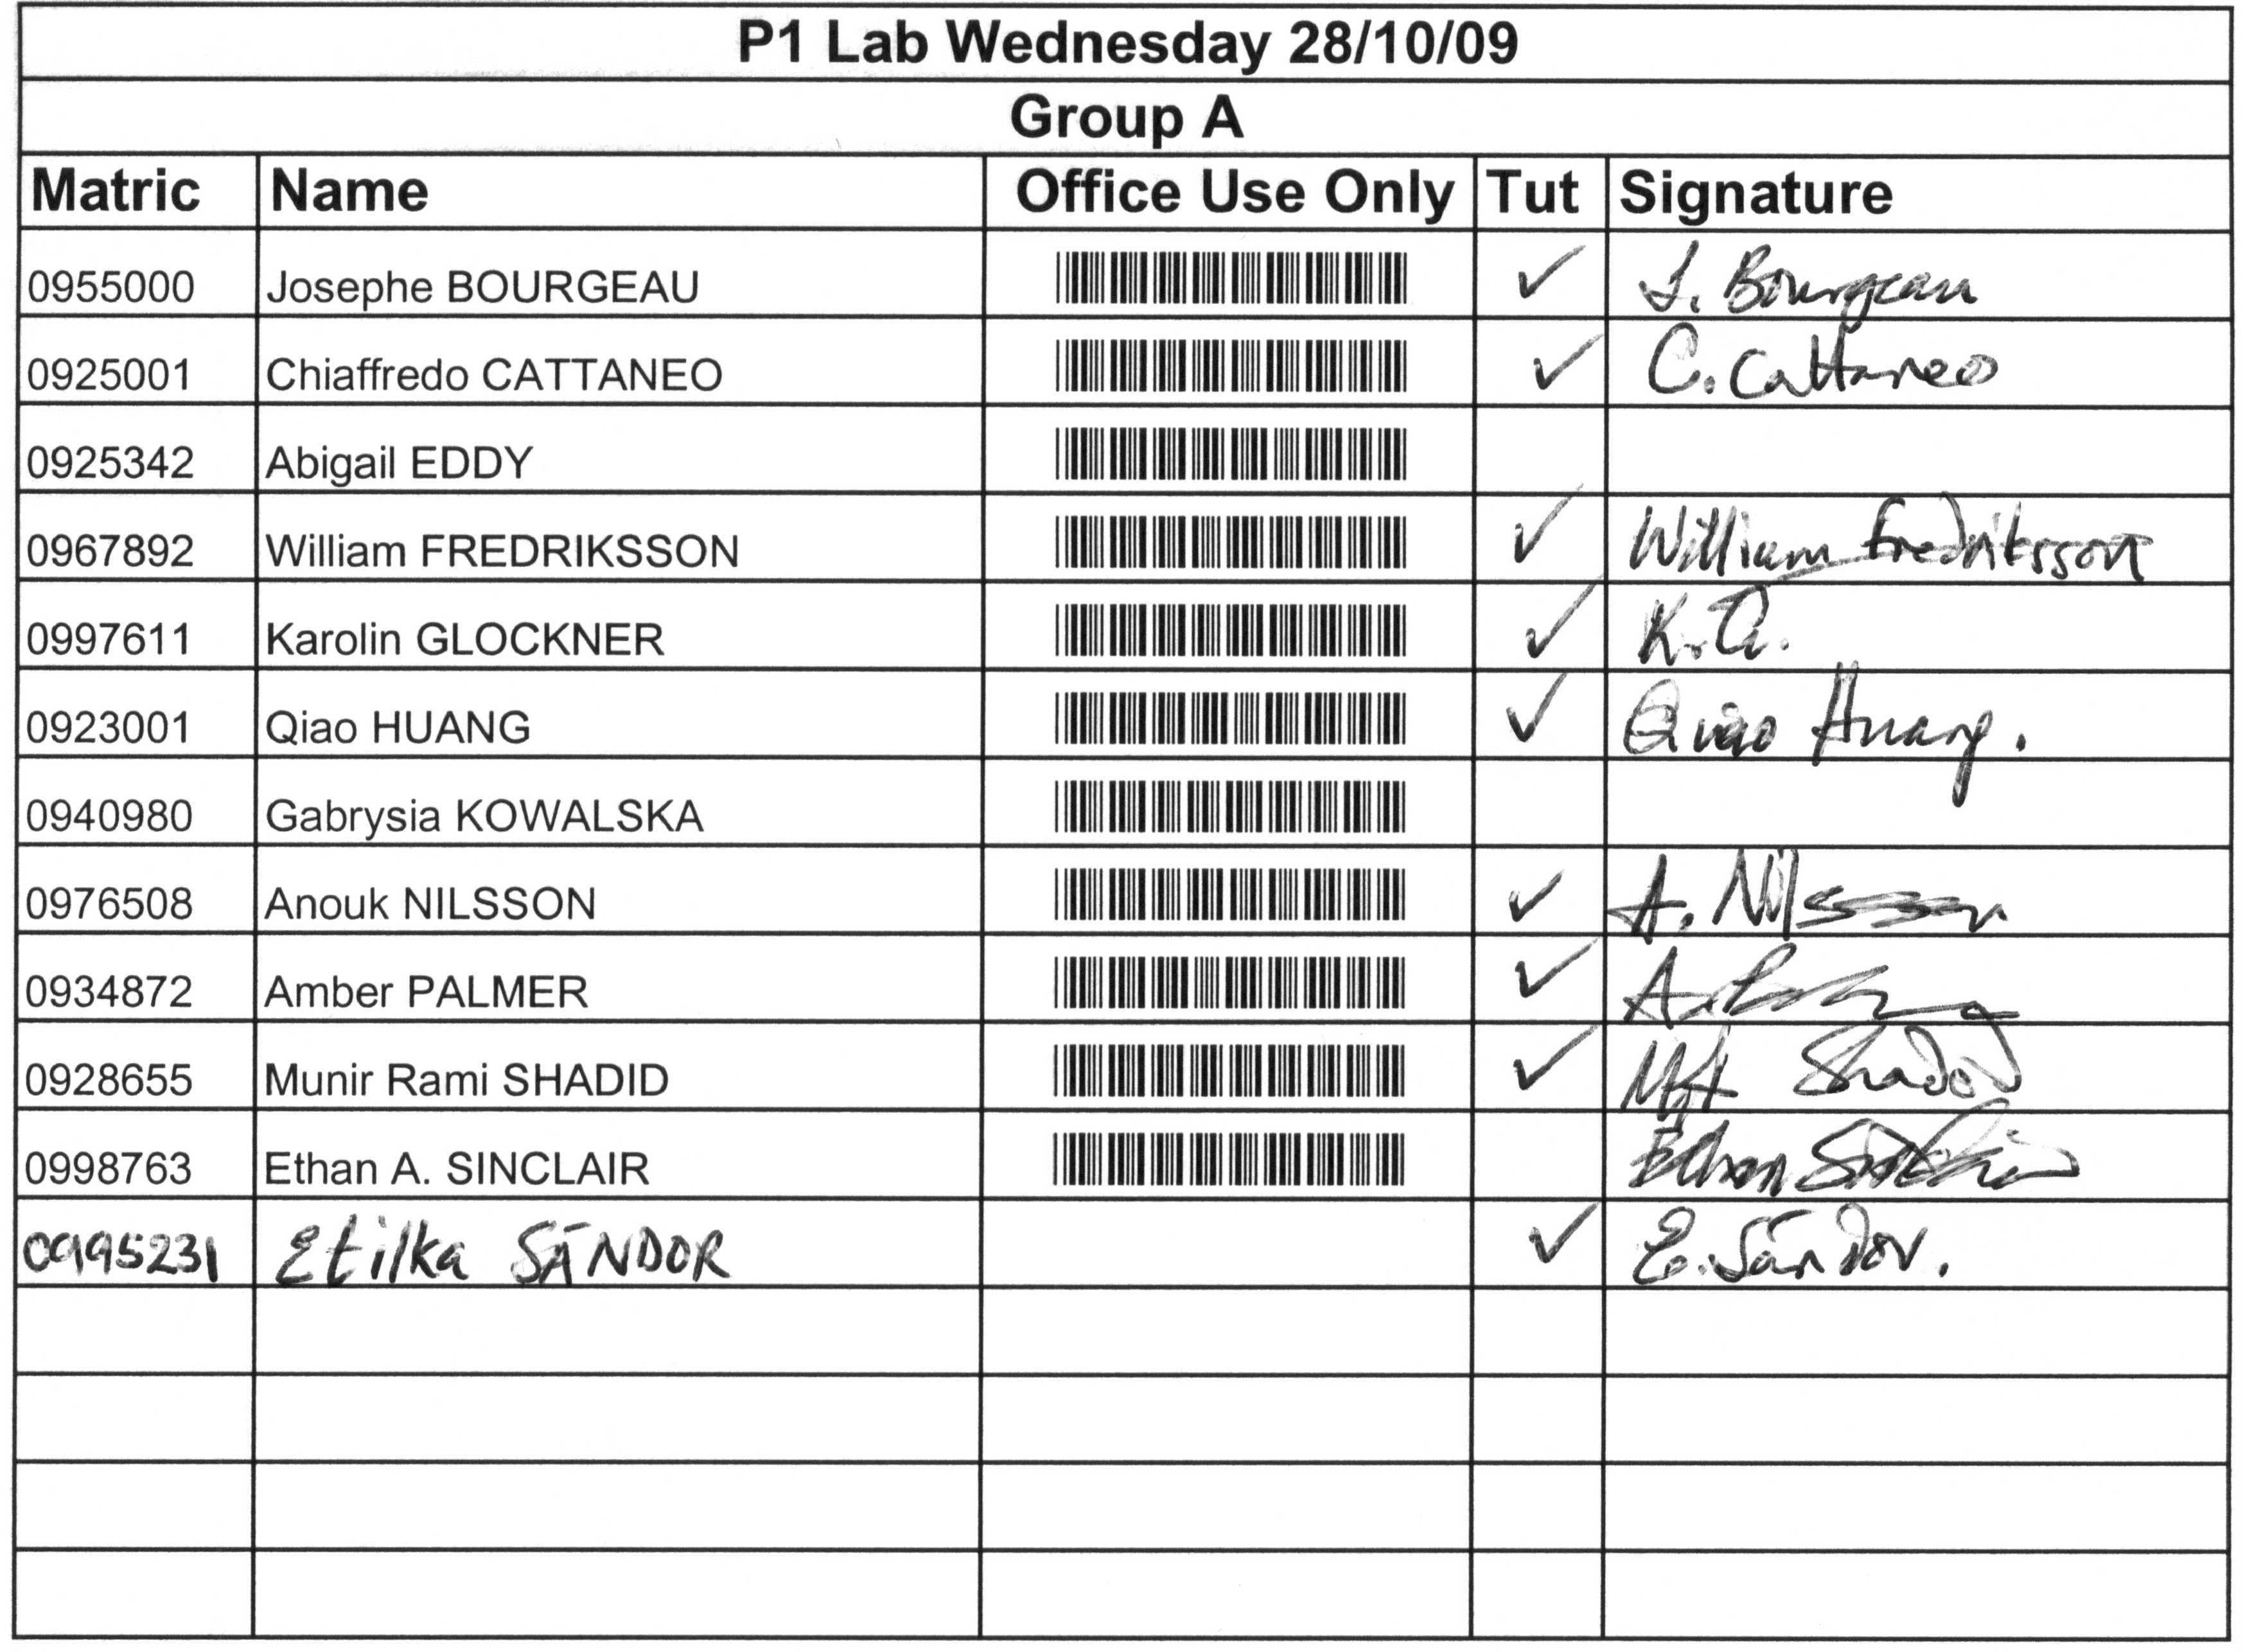
The staff member in charge of the laboratory class that day has responsibility for asking students to sign the register and ensuring that the number of signatures matches the number of bodies in the room. Because students are allowed some flexibility in attending the laboratory on a day different to their nominated day or, for that matter, twice in one week to make up a missed class, they are allowed to sign their name at the end of the main list. A cross-check of the number of signatures against the number of barcodes downloaded to the database subsequently reduces the margin for false positives in attendance to zero.
By the start of 2009-10, there were 240 students in the class but the job of processing the from students housed in up to three separate rooms on five separate laboratory days was refined enough that the task would typically be finished within 30-minutes to one hour of the start of any laboratory class. This meant that absent students could be contacted very quickly. In fact, during the first week of laboratory classes, the policy was to contact students by SMS within one hour of the laboratory class starting every day. After the first week of laboratory classes, the data-processing frequency was reduced to once-weekly to reduce staff effort.
3.4 Workshop-test Attendance and Marking
In 2007-08, the class head introduced a series of regular multiple choice question tests (MCQ) as a means of increasing the fraction of continuous assessment attributed to the first year physics course. It was desirable to mark these tests quickly, accurately and with a minimum of staff effort. Therefore, computer-based marking was implemented with form recognition technology used to read the answer-sheets (Figure 4) and log the answers into the database for attendance monitoring as well as test-marking.
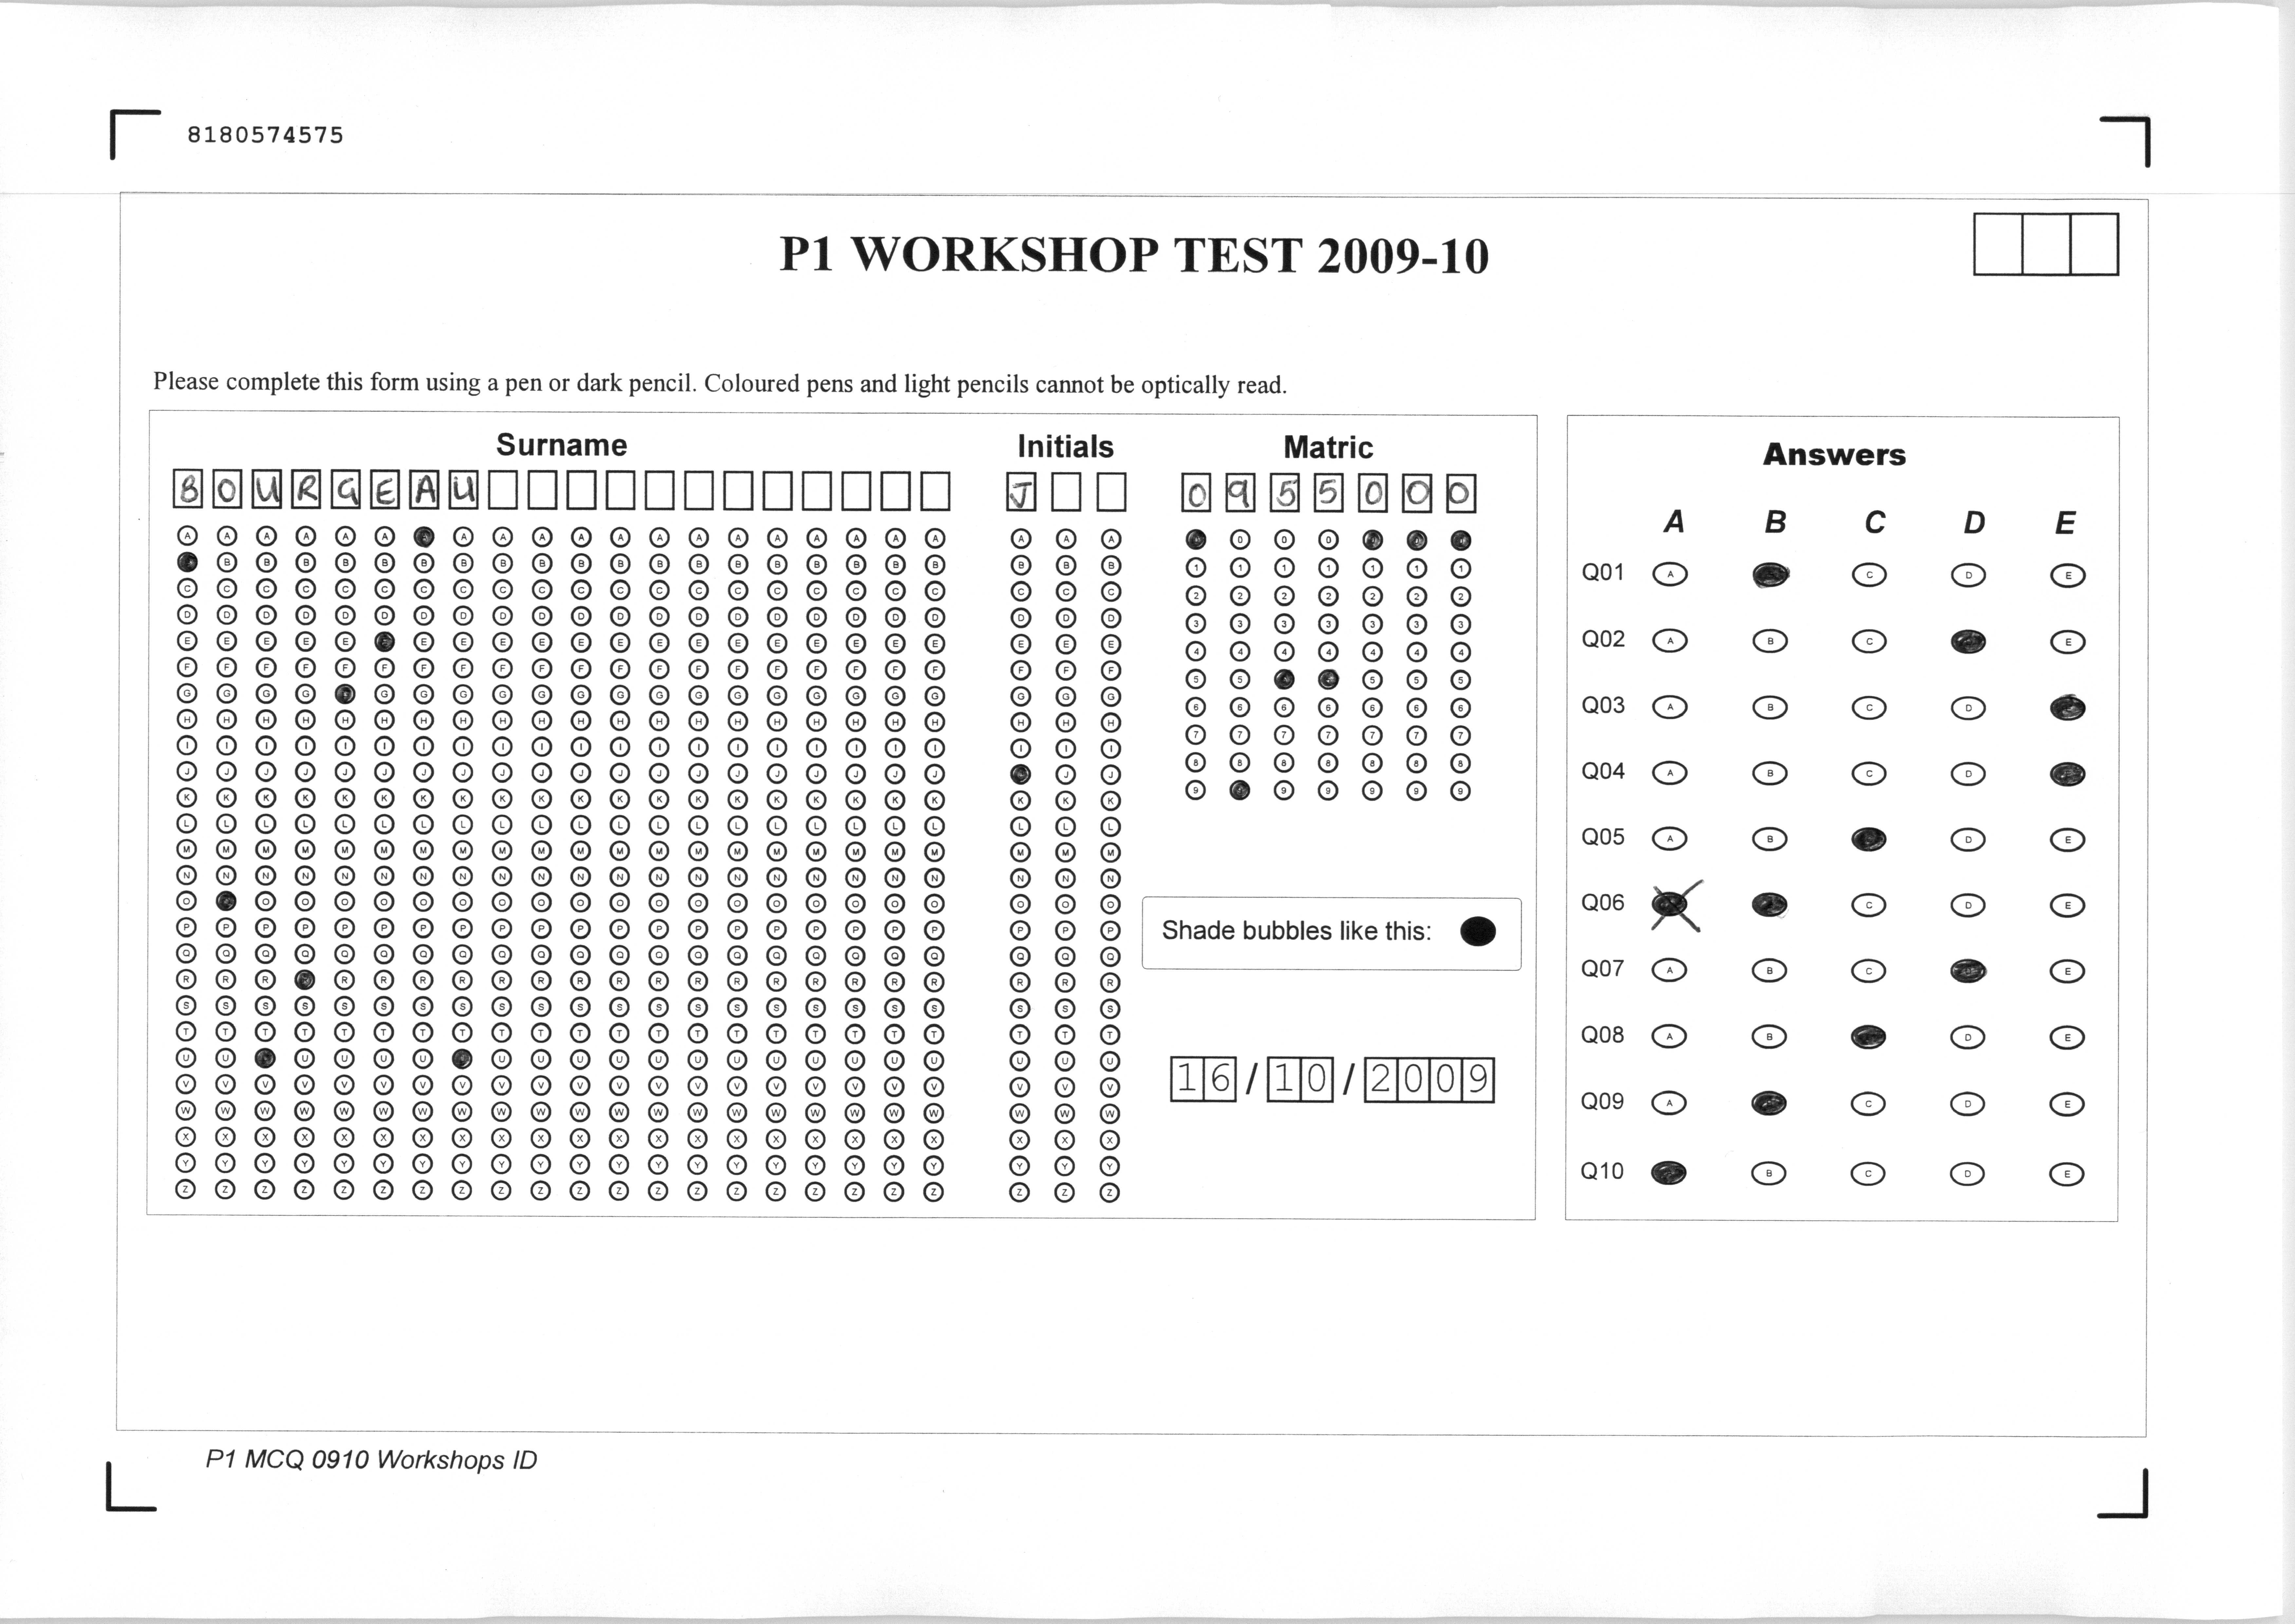
Students shade in the circles corresponding to the letters in their surname and numbers corresponding to their matriculation number. Although they can also write their name and matriculation number in the boxes above, it is the shaded circles that are read by the form recognition software. Students fill in their answers to the multiple-choice questions via the panel on the right-hand side. If they change their mind about the answer they wish to submit (as shown in question Q06), they may put a cross through the old answer and shade in a new answer. In such cases, the computer software used to scan the answer sheet generates a request for manual intervention to resolve the conflict.
3.4.1 Workshop-test Attendance
Attendance at the workshop-tests was checked by a series of measures. The answer sheets themselves should provide a definitive attendance so long as no answer sheets are misplaced. Two measures were routinely employed to ensure confidence: at least two staff members in each lecture theatre would undertake a manual headcount and, separately, the students were asked to scan their registration cards as in a normal lecture. In 2007-08 processing the workshop-test data was possible within 30 minutes of the end of each test for a class of 160 students. By the start of academic session 2009-10, this task was routinely carried out in the same timescale but for a class size of 240 students.
3.4.2 Workshop-test Marking
The marking of the workshop tests was done by form recognition on the scanned answer sheets. Mostly, this was a problem-free process so long as students used a dark enough pen or pencil to shade in the answer bubbles and did not change their mind after shading in an answer. Because the computer software was programmed to expect a single answer and query both blanks and multiple answers, it would stop processing the answer sheets and request user intervention for a decision about the intention of the student in such cases; this happened for about three or four forms at every test.
After the data had been downloaded, individual student records were compared with the nominally correct answers. Thus a final score could be provided to individual students and, more importantly, the statistical distribution of answers for individual questions could be checked. If it appeared that a significant fraction of the class had answered any question wrongly, further investigations sometimes revealed either a question that was too difficult for the level of the class or an ambiguously worded question. In all cases, feedback was given to the lecturer who had set the question so that subsequent questions would be refined.
Overall, the multiple-redundancy involved in checking the marks ensured complete confidence in the accuracy of the data and, although these checks could typically be completed within 30-60 minutes of the test finishing, publication of the test results was typically delayed for several days to allow further quality assurance checks to be undertaken.
4 Results and Analysis
The introduction of computer-based technologies to aid the administration of the first year physics class has proved extremely beneficial. The main objectives of monitoring attendance and tracking students identified as being at risk of disengaging from study hinged on the production of an accurate class register early in the session. Although computer-based technologies assisted in the production of an initial class register, it was found that significant human effort was required to finalize it. Subsequently, confidence in the accuracy of data collated as well as turnaround times for processing were dramatically improved over previous years when computer-based technologies were not used (Table 1).
| Task | 2006-07 | 2007-08 | 2009-10 |
|---|---|---|---|
| students | students | students | |
| Produce class register | 3-5 weeks | 3 weeks | 3 weeks |
| Take lecture attendance | N/A | Weekly | Daily |
| Take laboratory attendance | Submitted work | 60 minutes | 30 minutes |
| Take workshop-test attendance | N/A | 180 minutes | 30 minutes |
| Mark workshop-test scripts | N/A | 180 minutes | 30 minutes |
The first column shows representative data from 2006-07, before which computer-based technologies were not in use. Thus, lecture attendance was not taken before 2007-08 and the workshop-tests were not part of the continuous assessment in the class. Historically, the laboratory attendance was derived from the submitted work at the end of each semester by which point there was no possibility for students to catch up on missed work. In 2007-08, with the introduction of the computer-based technologies, turnaround times for data processing and, particularly, some marking tasks decreased significantly. By 2009-10, the system was adequate for coping with the unexpected 50% increase in class size. The turnaround times for production of a class register have not improved because this process is primarily driven by flux in the student population near the start of the session.
The decrease in turnaround times and associated increase in confidence regarding the accuracy of the data collected has allowed issues of absenteeism in the student body to be addressed at an early stage in the semester rather than at the end. In the case of the workshop-tests and laboratory classes, students can be contacted within 30-minutes of the end of a workshop-test or the start of a laboratory. Early contact of absent students has proved vital in terms of improving student retention and progression statistics. Indeed, it is believed that this is a contributory factor to the increase in direct progression from first to second year physics between 2006-07 and 2008-09.
The form recognition-based marking of the workshop-tests has proved invaluable in terms of providing students with feedback on their progress. Staff are now in a position to mark and return assessment feedback within 30-minutes of the end of an assessment session for a class size of 240 students. In the previous technology-sparse era, this would not have been possible or even considered due to the numbers of students involved.
5 Summary and Future Work
The main aims in streamlining the administration of the first year physics class appear not only to have been effective but, on some levels, surpassed. The almost immediate processing of lecture and, more importantly, laboratory and workshop-test attendance data with previously unknown levels of confidence has allowed the early identification and contact of students identified as being at risk of disengaging from the process of studying.
It is believed that the combination of administration and academic changes have been contributing factors in helping improve the course pass-rate with and the first to second year progression rate by between 2006-07 and 2008-09. Experience gained in 2007-08 was further developed and refined in 2008-09 so that the unexpected 50% increase in student numbers by the start of the 2009-10 session did not present significant problems in class administration. Future work will centre around rolling out these techniques to other large classes within the School specifically the second year physics class, currently also undergoing a surge in student numbers. Interest in the administration techniques developed herein is also being shown further afield within the University of Glasgow.
Acknowledgements
The authors would like to thank Dr Stephen McVitie, current class head of the first year physics course at the University of Glasgow, for many helpful discussions in refining the logic of these new processes and also for proof-reading this paper prior to submission. The authors would also like to thank Mr Ignacio Santiago Prieto at the University of Glasgow for the providing the Spanish translation of the title, abstract and keywords.
References
References
- [1] Glenda Crosling, Liz Thomas, and Margaret Heagney, editors. Improving Student Retention in Higher Education: The Role of Teaching and Learning. Routledge, Abingdon, UK, 2008. ISBN: 978-0-415-39921-0.
- [2] Morag M. Casey. Supporting level 1 physics & astronomy students at the University of Glasgow. In Proceedings of Frontiers of Physics Education, GIREP-EPEC Conference 2007, pages 283–287, Sveuilina Knjinica Rijeka, 2007. ISBN: 978-953-55066-1-4.
- [3] Morag M. Casey and Stephen McVitie. Academic performance and student engagement in level 1 physics undergraduates. European Journal of Physics, 30:1153–1162, 2009.
- [4] Denis J. Simair. Computer uses in school administration: a pilot project. 1982.
- [5] Adrie Visscher, Phil Wild, Debbie Smith, and Len Newton. Evaluation of the implementation, use and effects of a computerized management information system in english secondary schools. British Journal of Educational Technology, 34, 2003.
- [6] Walter Middleton. Electronically tracking and supporting students at risk. International Journal of Electrical Engineering Education, 39(3):253–262, 2002.
- [7] University of Glasgow. Undergraduate Prospectus. University of Glasgow, Glasgow, UK, 2009. URL: http://www.gla.ac.uk.
- [8] Maureen Maloney and Brenda Lally. The relationship between attendance at university lectures and examination performance. Irish Journal of Education, 29:52–62, 1998.
- [9] Andrew Thatcher, Peter Fridjhon, and Kate Cockcroft. The relationship between lecture attendance and academic performance in an undergraduate psychology class. South African Journal of Psychology, 37(3):656–660, 2007.
- [10] Autonomy. Autonomy Teleform Software. Autonomy Systems Ltd., Cambridge, UK, 2009. URL: http://www.autonomy.com.
- [11] Opticon Sensors Europe. OPL972X / CRD972X User’s Manual. Opticon Ltd., Luton, UK, 2003.
- [12] Canon. DR-5010C High Speed Document Scanner. Canon (UK) Ltd., Surrey, UK, 2009. URL: http://www.canon.co.uk.
- [13] Sun Microsystems. MySQL Database Software. Sun Microsystems Ltd., Surrey, UK, 2008. URL: http://www.mysql.com.
- [14] UK Government. Data Protection Act 1998 (Public General Acts - Elizabeth II). Stationery Office Books, Norwich, UK, 1998. ISBN: 978-0105429982.