75282
S. Giacintucci
33email: simona@astro.umd.edu
Diffuse radio sources in colliding galaxy clusters
Abstract
The knowledge of the origin and statistical properties of diffuse radio emission in galaxy clusters has appreciably improved thanks to the GMRT Radio Halo Survey, a project based on 610 MHz observations of clusters belonging to a statistically complete sample. However, the spectral properties of cluster diffuse sources are still poorly known and uncertain. High sensitivity and multi-resolution observations at low frequency (0.3 GHz) are needed for accurate spectral studies. Here, GMRT images at 325 MHz are presented for the clusters A 2744, A 1300, A 1758N and A 781, all hosting cluster-scale diffuse emission in the form of a giant halo and/or relic. These observations are part of a new observational campaign to follow up with the GMRT at 150, 235 and 325 MHz all diffuse radio sources in the cluster sample of the GMRT Radio Halo Survey and obtain detailed information on their radio spectral properties.
keywords:
radiation mechanism: non-thermal — galaxies: clusters: general — galaxies: clusters: individual: A2744, A1300, A1758N, A7811 Introduction
The presence of non-thermal phenomena in galaxy clusters is nowadays firmly assessed by radio observations. Synchrotron giant radio halos and peripheral relics prove the existence of relativistic particles and magnetic fields in clusters (Ferrari et al., 2008; Cassano, 2009) – see also Venturi, Brunetti and Murgia, this volume.
Radio relics are believed to arise at merger shocks via diffusive Fermi acceleration (Enßlin et al., 1998; Hoeft & Brüggen, 2007; van Weeren et al., 2010). A spatial connection between an X-ray shock and radio emission is indeed observed in a number of clusters (e.g., Markevitch 2010 and this volume). While relics mark the locations of shocks, giant halos may be caused by in-situ reacceleration of pre-existing, lower-energy and long-lived relativistic electrons by turbulence during cluster mergers (Brunetti et al., 2001; Petrosian, 2001). Hadronic collisions between thermal and relativistic protons may be alternative or additional sources of relativistic electrons (Pfrommer et al. (2008); Pfrommer, this volume).
The 610 MHz GMRT Radio Halo Survey, investigating a statistically complete sample of clusters (Venturi et al., 2007, 2008), addressed the question whether all clusters exhibit a giant radio halo. The survey led to the detection of new diffuse cluster-scale sources and provided a statistical confirmation that giant halos are hosted exclusively by massive and merging systems (Brunetti et al., 2007; Cassano et al., 2008, 2010) – see also Cassano, this volume.
Here, we present some initial results of a low frequency follow up
with the GMRT at 325, 235 and 150 MHz
of all halos, relics and candidates in the
GMRT Radio Halo Survey sample. The project aims to
increase our knowledge of the spectral properties
of halos and relics, which is still very poor and uncertain.
Most of them have been imaged only at 1.4 GHz
and interferometric high-sensitivity observations at low frequency
( 0.3 GHz), with the range of resolutions needed to perform
such study, are available only for a handful of clusters.
We use H0=70 km/s/Mpc, =0.3, =0.7.
2 GMRT observations and images
Halo and relic emission usually embeds a number of discrete sources, which need to be thoroughly removed to perform proper imaging and accurate flux density measurements. The wide range of spacings provided by the GMRT configuration is particularly well suited for removal of discrete sources, as it provides a simultaneous range of resolutions, which allow to accurately subtract individual objects and image the diffuse emission in its whole extent.
The sample selected for the low frequency follow up of the GMRT Radio Halo Survey includes all clusters with a detected radio halo or relic and those with candidate diffuse emission. Table 1 provides the list of clusters observed so far. Three clusters have been subject of dedicated papers (see notes to the table); the 235 and 325 MHz observations of the remaining ones will be presented in Venturi et al. (2011a). The reduction of the 150 MHz data is in progress (Macario, this volume).
Here, we present the 325 MHz images of A 2744, A 781, A 1300 and A 1758N. These clusters were observed with the GMRT for a total of 8 hours each, using the default spectral-line mode, with a 32 MHz total band. The data were calibrated and reduced as described in Giacintucci et al. (2008). Residual amplitude errors are 5%.
Despite the massive data editing required by radio frequency interference, the quality of the 325 MHz images is good, with a 1 rms level in the range mJy/beam at full resolution ( 10′′). Sets of low resolution (35′′- 40′′) images were also produced for each cluster, after careful subtraction of the individual radio sources from the u-v data.
| Cluster | Source | |
| (MHz) | ||
| A 2744 | 325 | R+H |
| A 209 | 325 | H |
| A 521 | 150, 235,325 | R+H 1,2 |
| A 697 | 150, 325 | H 2,3 |
| A 781 | 325 | R 4 |
| Z 2661 | 325 | cH |
| A 1300 | 325 | R+H |
| A 1682 | 150, 235 | cH 2 |
| RXCJ1314.4-2515 | 235,325 | 2R+H |
| A1758N | 325 | H |
| RXCJ2003.5-2323 | 235,325 | H 5 |
2.1 A 2744
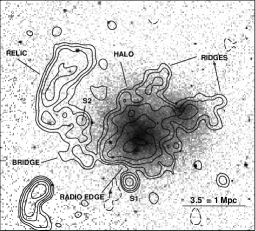
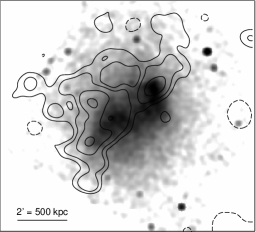
A 2744 is a spectacular example of cluster-cluster merger, likely in a post-core passage state, complicated by the infall of a third subcluster from the NW (Owers et al., 2011). An X-ray shock front was recently discovered SE of the main cluster (Markevitch, 2010; Owers et al., 2011). The cluster is impressive also in the radio band, hosting a very large radio halo and a giant relic (Govoni et al., 2001; Orrú et al., 2007).
Fig. 1 shows the GMRT 325 MHz low-resolution contours on the Chandra image. The halo and relic appear connected by a faint bridge, visible also at 1.4 GHz (Govoni et al., 2001). The radio halo is larger than previously imaged at 327 MHz (Orrú et al., 2007); including the two prominent ridges of emission detected toward the N and NW, the halo reaches a size of 1.9 Mpc. The relic has a higher surface brightness compared to the halo, and its size is Mpc, in agreement with the literature images. The bridge extends for 700 kpc between the halo and relic.
The halo covers the whole cluster X-ray emission. Interestingly, the NW ridge seems to follow the same direction of the subcluster X-ray emission. A positional shift between the X-ray and radio peaks is observed for both the main cluster and subcluster. The relic is located just outside the detected X-ray emission. The shock front in the SE periphery of the cluster coincides with an edge-like feature of the radio halo, as observed in few other radio-halo clusters (Markevitch 2010 and this volume).
The halo has a flux density of 32316 mJy at 325 MHz (excluding the bridge and S1), and the relic has mJy (bridge and S2 excluded). The flux density in the bridge is mJy. These measurements are considerably higher than those in Orrú et al. (2007). Integration of the GMRT image over the same area imaged by Orrú et al. gives mJy, to be compared to mJy. For this reason, the resulting 0.3-1.4 GHz spectral index is steeper than reported in Giovannini et al. (2009): (using mJy) is found for the halo and =1.3 for the relic.
2.2 A 1300
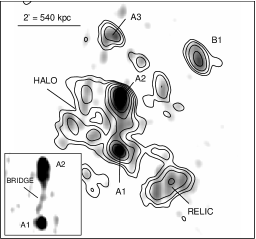
A 1300 is a complex merging cluster with a global temperature of 11 keV, which places the system among the hottest clusters known. It hosts a radio halo and a candidate relic (Reid et al, 1999).
Fig. 2 (left) shows the 325 MHz low-resolution contours overlaid on the full resolution image, displayed in grey scale to highlight the position and morphology of the radio galaxies embedded in the diffuse emission (the sources are labelled following the notation in Reid et al. 1999). A faint bridge of emission connects the head-tail A2 and point source A1 (see inset). It is not clear whether such feature is physically related to A2 or is part of the underlying radio halo. The right panel shows the residual diffuse emission after subtraction of the individual radio galaxies (the bridge was also subtracted), overlaid on the Chandra image. The radio halo brightness distribution is fairly uniform and there is little gradient going from the central part to the periphery. Its shape is similar to the higher frequency images, with the emission extending mainly E of A1 and A2. The size is 890 kpc, comparable to the extent reported in Reid et al. The candidate relic, too, is similar in shape, extent (450 kpc) and brightness distribution to the earlier images.
The flux density of the halo at 325 MHz is = 1307 mJy. Reid et al. report = 10 mJy with ATCA, while the halo has = 20 mJy on the NVSS . The spectral index of the halo is =1.3 using NVSS and =1.8 using the ATCA value. The candidate relic has =754 mJy. Its spectral index is =0.9 between 325 and 843 MHz and =1.3 in the 1.3-2.4 GHz range.
Fig. 2 shows that the halo extends mainly NE of the X-ray peak, while the candidate relic is located in the SW periphery of the detected X-ray emission. On the basis of its morphology, location and steep spectral index, we support the interpretation that this source is a relic.
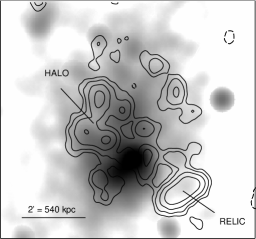
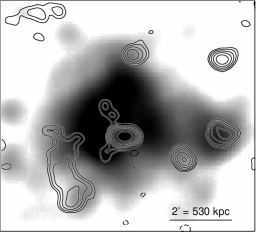
2.3 A 1758N
A 1758N is part of a well-known pair of two merging clusters, A 1758N and A 1758S, both characterised by very complex X-ray morphology, with several clumps of emission, as typical of ongoing mergers (Kempner & David, 2004). A 1758N shows more extreme X-ray properties, with higher X-ray luminosity and temperature compared to A 1758S. It is also more interesting in the radio band, hosting a spectacular diffuse radio source visible both on the NVSS and WENSS (Kempner & Sarazin, 2001). Deep VLA observations at 1.4 GHz were presented in Giovannini et al. (2009).
The GMRT 325 MHz images of A 1758N are shown in Fig. 3. On the left, the full resolution contours are overlaid on the optical image. The right panel shows the overlay of the residual diffuse emission (after subtraction of the discrete sources S1 to S5) on the Chandra X-ray image. The diffuse radio source is filamentary and occupies mainly the central and NE region of the cluster. Its flux density at 325 MHz is 1467 mJy and the total size is 1.5 Mpc.
The overall shape and size are in partial agreement with the VLA 1.4 GHz image in Giovannini et al. (2009), who classify the radio emission as a radio halo and a double peripheral relic. Indeed the morphology of this source is very peculiar, however the spatial coincidence between the radio and X-ray emission (Fig. 3) suggests that the source is centrally located. Hence, here it is classified as a radio halo. Its spectral index, using the 1.4 GHz flux in Giovannini et al. (2009), is .
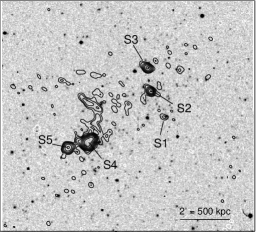
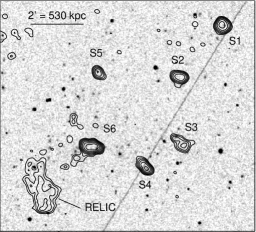
2.4 A 781
A 781 (z=0.298) has complex X-ray emission, with multiple peaks in the central region and a secondary SE condensation at , associated with the galaxy cluster CXOU J 092053+302800 (z=0.291). The GMRT 610 MHz observations revealed a diffuse source at 3′ SE the cluster centre, which was classified as candidate radio relic (Venturi et al. 2008). The new 325 MHz images are presented in Fig. 4. Beyond the individual sources (S1 to S6), the candidate relic is the most striking feature in the field. The source is much more extended than at 610 MHz, with a total size of 700 kpc. The brightness is peaked in the southernmost part of the source, which is also edge-brightened, in agreement with the 610 MHz images. The flux density of the candidate relic is S=935 mJy, fairly consistent at all resolutions. Flux density measurements at 1.4 GHz from NVSS and archival VLA images (Venturi et al., 2011b) provide S15 mJy. The resulting spectral index is 1.25. The nature of this source remains uncertain. Its properties - morphology, size, peripheral location and steep spectrum - suggest that it might be indeed a radio relic. However, the edge-brightening in the southern region of the source is unusual for a relic.
To check for a possible extension of the relic towards the cluster centre, and/or for a central radio halo undetected at 610 MHz, the A 781 field was imaged at low resolution (from 30′′ to 60′′). Images of the residual emission after subtraction of the individual radio galaxies were also produced. While a 10 mJy extension of the candidate relic is observed in the direction of the double source S6, no large-scale, cluster-centre diffuse emission is detected at the sensitivity level of these images ( mJy/beam). Flux density measurements on the same images suggest residual emission of the order of 20-30 mJy (including the 10 mJy extension of the relic) over a 1 Mpc-diameter region around the cluster center. The total flux density in the individual sources and in the relic is 526 mJy, and the residual flux density is 5% of this value. A thorough multi-frequency investigation of A 781 will be presented in Venturi et al. (2011b).
3 Summary
GMRT observations at 150, 235 and 325 MHz of the diffuse radio sources in the GMRT Radio Halo Survey sample (Venturi et al. 2007, 2008) will provide valuable information on the radio spectral properties of giant radio halos and relics (Venturi et al., 2011a). Here, deep 325 MHz images have been shown for the spectacular merging clusters A 2744, A 1300, and A 1758N, belonging to the sample and previously known to possess impressive radio emission on the Mpc-scale. Images for A 781 have been also presented. An extended radio feature at the periphery of this merging system was classified as a candidate relic at 610 MHz. The relic is much more extended in the new images at 325 MHz and exhibits a spur of emission toward the cluster centre. Beyond such spur, no further diffuse emission seems to be present at the cluster center, at least at the sensitivity level of the 325 MHz images (Venturi et al., 2011b).
Acknowledgements.
I aknowledge my collaborators T. Venturi, R. Cassano, G. Brunetti, D. Dallacasa, G. Macario and M. Markevitch. I also thank N. Kantharia, R. Athreya and the staff of the GMRT for their help during the observations. GMRT is run by the National Centre for Radio Astrophysics of the TIFR. Support was provided by NASA through Einstein Postdoctoral Fellowship PF0-110071 awarded by CXC, which is operated by SAO, and by the Chandra grant AR0-11017X.References
- Brunetti et al. (2001) Brunetti, G., et al., 2001, MNRAS, 320, 365
- Brunetti et al. (2007) Brunetti, G., et al., 2007, ApJ, 670, L5
- Brunetti et al (2008) Brunetti, G., et al., 2008, Nat, 455, 944
- Cassano et al. (2008) Cassano, R., et al., 2008, A&A, 480, 687
- Cassano (2009) Cassano, R., 2009, ASPC, 407, 223
- Cassano et al. (2010) Cassano, R., et al., 2010a, ApJL, 721, L82
- Dallacasa et al. (2009) Dallacasa, D., et al., 2009, ApJ, 699, 1288
- Enßlin et al. (1998) Enßlin, T.A., et al., 1998, A&A, 332 395
- Ferrari et al. (2008) Ferrari, C., et al., 2008, SSRv, 134, 93
- Giacintucci et al. (2008) Giacintucci, S., et al., 2008, A&A, 486, 347
- Giacintucci et al. (2009) Giacintucci, S., et al., 2009, A&A, 505, 45
- Giovannini et al. (2009) Giovannini, G., et al., 2010, A&A, 507, 1257
- Govoni et al. (2001) Govoni, F., et al., 2001, A&A, 376, 803
- Hoeft & Brüggen (2007) Hoeft, M., et al., 2007, MNRAS, 375, 77
- Kempner & Sarazin (2001) Kempner, J.C., Sarazin, C.L., 2001, ApJ, 548, 639
- Kempner & David (2004) Kempner, J.C., David, L.P., 2004, MNRAS, 385, 392
- Macario et al. (2010) Macario, G., et al., 2010, A&A, 517, A43
- Markevitch (2010) Markevitch, M., 2010, arXiv:1010.3660
- Orrú et al. (2007) Orrú, E., et al., 2007, A&A, 467, 943
- Owers et al. (2011) Owers, M.S., et al., 2011, ApJ, in press
- Petrosian (2001) Petrosian, V., 2001, ApJ, 577, 560
- Pfrommer et al. (2008) Pfrommer, C., et al., 2008, MNRAS, 385, 1211
- Reid et al (1999) Reid, A.D., et al., 1999, MNRAS, 302, 571
- van Weeren et al. (2010) van Weeren, R.J., et al., 2010, Sci, 330, 347
- Venturi et al. (2007) Venturi, T., et al., 2007, A&A, 463, 937
- Venturi et al. (2008) Venturi, T., et al., 2008, A&A, 484, 327
- Venturi et al. (2011a) Venturi T., et al., 2011a, A&A, to be submitted
- Venturi et al. (2011b) Venturi T., et al., 2011b, A&A, submitted